HAL Id: hal-02448394
https://hal.archives-ouvertes.fr/hal-02448394
Submitted on 22 Jan 2020
HAL is a multi-disciplinary open access
archive for the deposit and dissemination of
sci-entific research documents, whether they are
pub-lished or not. The documents may come from
teaching and research institutions in France or
abroad, or from public or private research centers.
L’archive ouverte pluridisciplinaire HAL, est
destinée au dépôt et à la diffusion de documents
scientifiques de niveau recherche, publiés ou non,
émanant des établissements d’enseignement et de
recherche français ou étrangers, des laboratoires
publics ou privés.
geothermal wells in Rittershoffen (Upper Rhine Graben,
eastern France): a key for future geothermal wells
Philippe Duringer, Coralie Aichholzer, Sergio Orciani, Albert Genter
To cite this version:
Philippe Duringer, Coralie Aichholzer, Sergio Orciani, Albert Genter. The complete lithostratigraphic
section of the geothermal wells in Rittershoffen (Upper Rhine Graben, eastern France): a key for future
geothermal wells. Bulletin de la Société Géologique de France, Société géologique de France, 2019,
190, �10.1051/bsgf/2019012�. �hal-02448394�
The complete lithostratigraphic section of the geothermal wells in
Rittershoffen (Upper Rhine Graben, eastern France): a key for
future geothermal wells
Philippe Duringer
1,*, Coralie Aichholzer
1, Sergio Orciani
2and Albert Genter
31
Université de Strasbourg (Unistra), École et Observatoire des Sciences de la Terre (EOST), Institut de Physique du Globe (IPGS), CNRS / UMR 7516, 1, rue Blessig, 67084 Strasbourg Cedex, France
2 Via Defendi Semeghini, 15, 46026 Quistello, Italy 3
ES-Géothermie, 5, rue de Lisbonne, 67300 Schiltigheim, France Received: 20 February 2019 / Accepted: 15 July 2019
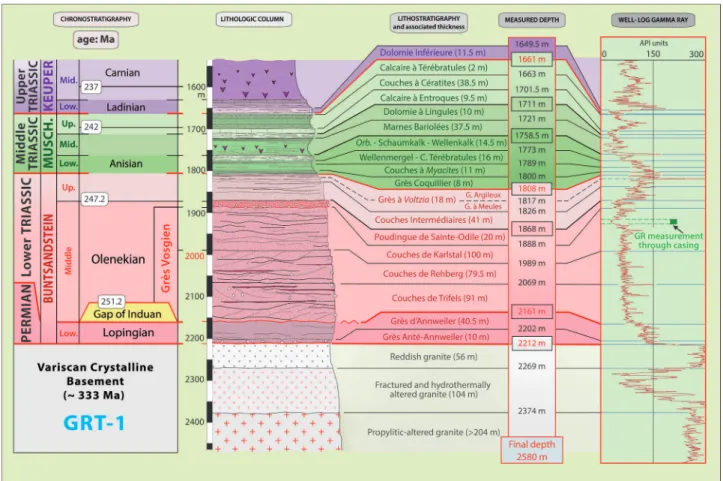
Abstract – Between 2012 and 2014, in Rittershoffen, in the Upper Rhine Graben, two geothermal boreholes (GRT-1 and GRT-2) reached the granitic basement at a depth of around 2150 m. The wells crossed about 1160 m of Cenozoic and 1050 m of Mesozoic. In the Cenozoic, these wells crossed the greatest part of the Eocene, the lower part of the Oligocene and a thinner Pliocene. The Quaternary is poorly represented (less than 10 m). In the Mesozoic, the wells crossed the Lower Dogger, the entire Lias and the entire Triassic. A reduced thickness of about 50 m of Upper Permian terminates the sedimentary column before entering into the granitic basement. A major erosional unconformity separates the Middle Jurassic from the Tertiary units (the Upper Jurassic, entire Cretaceous and Paleocene are absent). The Rittershoffen drilled doublets were the subject of particular attention concerning the acquisition of a very precise stratigraphic profile. In this paper, we give the recognition criteria for the fifty-seven formations crossed by the GRT-1 well and their upper and lower boundaries as well as their specific gamma ray signatures. The data are presented in four figures: a general complete log displaying the main sets and three detailed, precise logs showing the sedimentary formations overhanging the granitic basement: the Tertiary, the Jurassic, the Triassic, the Permian and the basement.
Keywords: Rhine Graben / geothermal wells / rift stratigraphy / gamma ray / sedimentology / palaeoenvironment Résumé – La colonne lithostratigraphique complète du doublet géothermique de Rittershoffen (Fossé Rhénan Supérieur, Est de la France) : les clés pour de futurs puits géothermiques.Entre 2012 et 2014, à Rittershoffen, dans le Fossé Rhénan Supérieur, deux puits géothermiques (GRT-1 et GRT-2) ont atteint le socle granitique vers 2150 m de profondeur. Les forages ont traversé environ 1160 m de Cénozoïque et 1050 m de Mésozoïque. Le Cénozoïque montre la plus grande partie de l’Eocène, la partie inférieure de l’Oligocène et une faible épaisseur de Pliocène. Le Quaternaire est très faiblement représenté (moins d’une dizaine de mètres). Le Mésozoïque montre un Jurassique incomplet dans sa partie supérieure. Les puits ont rencontré la partie inférieure du Dogger, l’intégralité du Lias et du Trias. Un Permien très réduit d’une cinquantaine de mètres termine la colonne sédimentaire avant de rentrer dans le socle granitique. Une discontinuité majeure sépare le Jurassique Moyen des séries Cénozoïques (tout le Jurassique Supérieur, le Crétacé ainsi que le Paléocène sont totalement absents). Ces puits ont fait l’objet d’une attention particulière dans la détermination des formations sédimentaires. Dans cet article, nous donnons tous les critères de reconnaissance de la soixantaine de formations traversées par le puits GRT-1, les cotes exactes des limites de formation, ainsi que leurs signatures spécifiques du gamma ray. Les données sont présentées en 4 figures : un log général complet et simplifié montrant les grands ensembles et trois logs précis détaillant toutes les formations : Tertiaire, Jurassique, Trias, Permien et socle.
Mots clés : Fossé Rhénan / forage géothermique / stratigraphie de rift / gamma ray / sédimentologie /
paléoenvironnement
*Corresponding author:duringer@unistra.fr https://doi.org/10.1051/bsgf/2019012
Available online at: www.bsgf.fr
1 Introduction
The site of Soultz-sous-Forêts (eastern France) located 40 km NNE from Strasbourg (Fig. 1) in the Upper Rhine
Graben (URG) is one of the first pilot geothermal projects in the world that made the proof of the concept of enhanced geothermal systems by producing energy from a deep-seated granite (Herbrich, 1988;Gérard et al., 2006). The rift basin was
explored in the past for oil and potash (Haas and Hoffmann, 1929; Clapp, 1932; Maïkovski, 1941; Schnaebele, 1948; Blumenroeder, 1962;Sittler, 1972,1985;Courtot et al., 1972; Blanc-Valleron, 1990). It is now exploited mainly for geothermal energy (Munck et al., 1979;Genter, 1989;Genter
et al., 2003;Gérard and Kappelmeyer, 1987;Kappelmeyer et al., 1992;Gérard et al., 2006;Guillou-Frottier et al., 2013;Genter
et al., 2015). No fewer than 15 deep wells were drilled during the last 30 years in the URG to exploit heat resources (Genter et al., 2015;Glaas et al., 2018;Vidal and Genter, 2018).
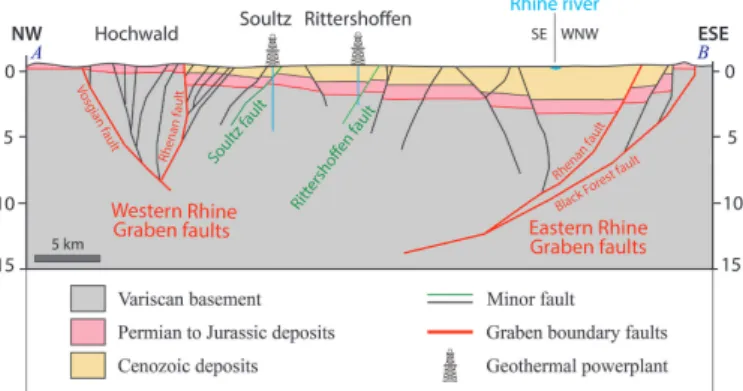
Between 2012 and 2014, two new geothermal boreholes, GRT-1 and GRT-2, were successfully drilled into the granitic basement in Rittershoffen (Fig. 1). The geothermal doublet studied here is located in the western part of the Rhine Graben approximately 7 km from Soultz-sous-Forêts and 13 km from the western main border fault (Fig. 2). It crosses the so-called Rittershoffen fault not far from the top of the granitic basement (Vidal et al., 2017). The final vertical depths of GRT-1 and GRT-2 were 2562 and 2707 m, respectively (Baujard et al., 2017,2018). This industrial geothermal project was initiated in 2004 (Baujard et al., 2017). The industrial production of hot water began in early 2016.
These geothermal wells crossed most of the Tertiary from Pliocene to the Middle Eocene (Quaternary is poorly represented), part of the Dogger, the entire Lias and Triassic and a reduced Permian before entering into the fractured granitic Paleozoic basement. The bottom of the sedimentary cover overlying the granitic basement is composed of 400 m thick coarse- to fine-grained fluvial and aeolian sandstone deposited during the Lower Triassic and Permian. The Middle Triassic (Muschelkalk) is 150 m thick. It consists of a succession of marine to evaporitic limestones, dolomites, marls and dolomitic marls with some occurrences of anhydrite. The 200 m thick Upper Triassic (Keuper) is mainly evaporitic. It is made up of dolomitic limestones and marls with occasional anhydrite levels from the base to the top. The Lower and Middle Jurassic is a fully marine unit displaying very homogenous facies. It consists essentially of clays and marls with intercalation of some limestone marker beds.
A major erosional unconformity separates the Middle Jurassic from the Tertiary (Sittler, 1967, 1969a, b, 1992) composed exclusively of Eocene (Paleocene is missing in the URG), Lower Oligocene and a small part of Pliocene strata.
The thickness of the Tertiary exceeds 1 km and is composed of marls and dolomitic marls with some occurrences of anhydrite. The lower part of this column (Eocene and Lower Oligocene) is lacustrine and evaporitic, whereas the upper part (from the Série Grise) is fully marine. The Pliocene is an 80 m thick sandy/clayey continental deposit. The Quaternary reaches a maximum of 10 m in thickness and is composed of loess and clayey-loess units dated to the Pleistocene (Ménillet et al., 2015).
The Rittershoffen drilled doublet was the subject of particular attention in the acquisition of a very precise and detailed stratigraphic profile recorded to date only in an internal broadcast record (Duringer and Orciani, 2015). The present study displays all basic data as well as all characte-ristics and criteria for the recognition of the fifty-seven sedimentary formations overhanging the granitic basement observed in GRT-1 and GRT-2. However, as the two wells are very close and similar, only GRT-1 has been considered in this paper (well not deviated). Four logs are presented: a general complete log (Fig. 3) with gamma ray (GR) signatures shows only the main divisions and three detailed logs with GR curves describing successively the complete Tertiary (Fig. 4), the Jurassic and Keuper (Fig. 5), and the Muschelkalk and Buntsandstein (Fig. 6) with the granitic basement. These detailed logs present all formations with precise thicknesses from the top to the base. The names of the formations used in this work are those defined by the last geological synthesis of the region (Ménillet et al., 2015). The names of the formations are given in French.
2 Geological background
The NNE-trending Upper Rhine Graben (URG) located in northeastern France (Figs. 1and2) is a segment of the European Cenozoic Rift System that extends from the North Sea up to the Mediterranean (Illies, 1967;Bergerat, 1985;Brun and Wenzel, 1991; Schumacher, 2002; Ziegler and Dèzes, 2005, 2006; Rotstein et al., 2005a, b; Edel et al., 2007). The URG is approximately 300 km long and 30 km wide and is limited by the Rhenish Massif to the north and the Jura Mountains to the south. The URG is delineated by both eastern and western systems of major faults (Fig. 2) separating the sediment-filled graben (Tertiary history) from the uplifted graben shoulders (Vosges and Black Forest). A wide fault zone separates the eastern and western parts of the graben from the Paleozoic massif (Vosges and Black Forest). In the studied region (Figs. 1and2), this large fault zone is limited in the west by the western Rhine Graben border fault (Vosgian fault) and in the east by the western Rhine Graben Main fault (Rhenan fault) (Sittler, 1992;Eisbacher and Fielitz, 2010; Duringer, 2014; Bauer et al., 2015). The maximum vertical displacement, particularly in the southern part of the URG, reaches 5 km (Sittler, 1992). The thickness of the Tertiary sedimentary filling can reach 3.5 km in the deepest part of the Mainz Basin (north of the URG) (Sittler, 1965; Doebl and Olbrecht, 1974; Rotstein et al., 2006; Hinsken et al., 2011; Duringer, 2014,2016). The URG is an asymmetrical graben with thicker deposits in the north than in the south (Sittler, 1965,1969a, b;Doebl and Olbrecht, 1974;Sissingh, 1998;Schumacher, 2002; Roussé, 2006;Hinsken et al., 2011) and is composed of many subbasins that are all different from each other.
Fig. 2. Schematic geological cross section through the Upper Rhine
Graben at the latitude of Rittershoffen. Cross section modified after Brun et al. (1992)andKappelmeyer et al. (1992).
Indeed, these subbasins reflect the complicated geological history of the URG over 45 Ma, and each of them has a singular architecture and history. Because of the presence of all these
subbasins with generally various sedimentary environments and deposits, the Cenozoic stratigraphic chart (Sittler, 1965; Duringer, 1988,1999,2016) is made of the juxtaposition of
several tables according to the studied deposits in each subbasin (Fig. 1): the Pechelbronn Basin in the north, the Potash Basin between Mulhouse and Colmar, the Mulhouse Horst at the south, and marginal basins composed of coarse-grained facies deposited at the foot of the surrounding reliefs, to name only the most important ones (Sittler, 1965;Courtot
et al., 1972; Duringer, 1988; Duringer and Gall, 1994; Duringer, 1995; Roussé, 2006;Pirkenseer et al., 2010). This led to the development of a specific stratigraphic table for each subbasin that can create many complications for lateral correlations. The correlations between all nomenclatures have been published in several papers (Sittler, 1965, 1992; Duringer, 1988, 1999; Roussé, 2006; Pirkenseer, 2007; Pirkenseer et al., 2010). In this work, located in the northern part of the basin, we use the Couches de Pechelbronn nomenclature, but to avoid any misunderstanding, a
synthe-tized stratigraphic table is given inFigure 7. See also the work by Berger et al. (2005a, b) for additional details across the region from south to north, including the Swiss Molasse Basin.
3 Materials and methods
The first work was done on the rig. Every cuttings coming back to the surface with the drilling mud were studied in the cabin during the drilling phase of Rittershoffen. The analysis of the cuttings was conducted under binocular after washing and sieving. Through this adequate detailed observation, it has been possible to evaluate with a good precision the facies observed in the cuttings and the type of formation crossed. The sampling is performed every 5 m from 40 to 1180 m and every 3 m from 1180 to 2580 m and represents an “average” facies.
Fig. 4. Complete chrono-lithostratigraphic log of the Tertiary with the gamma ray-log showing all the limits and geological formations
The most important document is therefore the masterlog of GRT-1 synthesizing a series of physical parameters and geological information measured while drilling such as the description of the rock succession from top to bottom of the well based on cuttings analysis. The masterlog also displays a complete calcimetry log giving the calcite/dolomite ratio, which is often essential to interpreting initial data, especially in the Middle and Upper Triassic, where the occurrence of dolomite can help greatly in the identification of some formations. The calcite/ dolomite ratio is acquired on each cutting samples collected. The ROP data (Rate of Penetration of the tool in the rock given in m/h) is another criterion for finding formation boundaries but its use remains generally delicate. Linked to the lithology, the ROP variation (from clay to limestone, for example) provides information of the hardness of the rocks during drilling. However, the value of ROP is generally counterintuitive because of clogging problems. Indeed, clayey formations are often more difficult to drill than pure limestone or sandstone. Practically, it is not simple to interpret the ROP, but it can provide some additional information.
The masterlog also provides the nature and importance of the organic gases (alkanes, C1 through C5) trapped in the rocks. It is measured continuously while the drilling. A priori, the presence of organic gases is not an essential criterion, but a sudden increase or decrease in its value must be taken into account because it can characterize formations rich in organic matter such as the formation of the Schistes à Poissons or the Schistes Carton known for their high gas content compared to the neighboring formations. The gamma ray-log (GR) is used
to confirm or adjust the positions of tops and bases of the formations because it has the highest resolution (up to 20 cm). In fact, it is probably the most important tool in the search for formation boundaries and associated electrofacies to precise the general trend of each formation.
The masterlog also provides parameters such as the weight on bit [T], rate of penetration (see above), drill revolution per minute, surface drilling string torque [lbf.ft], and mud injection pressure [bar]. In addition to that, mud loggers duplicate these sensors and acquire other parameters such as mudflow rate in and out [l/min], mud temperature in and out [°C]. Mud parameters, such as density, viscosity, salinity are also carefully followed and adjusted by mud engineers. These data are gathered together on a day-to-day basis by mud loggers (the Masterlog). The characteristics of the drilling mud are also recorded in the survey reports. In Rittershoffen, an improved bentonitic mud, resistant to high temperature (HT), was used. For the geothermal reservoir (phase 8 1/2), a biodegradable polymer with salt water was used.
In parallel with the drilling basic data, we studied the 30-year-old EPS-1 well at Soultz-sous-Forêts located 7 km west of Rittershoffen (Aichholzer et al., 2016). Only the cores from the lower part of this well (granitic basement, Buntsandstein and basal part of the Muschelkalk) were available. However, studying this well was very decisive for the interpretation of the monotonous sandy Middle Buntsandstein (Grès Vosgien) that would not have been possible otherwise. At the end of the drilling, after the first log construction, an important fieldwork campaign was conducted to validate the proposed formation
Fig. 5. Complete chrono-lithostratigraphic log of Jurassic and Keuper with the gamma ray-log showing all the limits and geological formations
boundaries. Luckily, in the URG region, in a circle of 100 km around the wells of Rittershoffen, there is a wide range of good outcrops for almost all formations, especially in the Triassic, part of the Tertiary and some outcrops in the Jurassic. Inside the clayey/marly Jurassic, where the limits of formations are based mainly on ammonite zones, we sampled some of the Jurassic beds in rare outcrops and compared them with the cuttings of the wells. This work allowed us to significantly refine the determinations of the formation boundaries.
4 Outcomes
4.1 Introduction
The description of the constructed log is presented from top to base. The advantage is that it is exactly conformed to how the geologists discovered the succession of the formations step by step during the progression of the drilling. This mode of description is also a guide for all future drilling especially for the determination of the tops of the formations. In this paper, we present only the formation boundaries that are character-ized by obvious criteria and that can be found in most other boreholes. For each boundary, we give the most important signals and criteria that can distinguish each formation from the previous and from the next one.
4.2 Quaternary and Pliocene
The first 7 m thick clayey to sandy loess representing the Quaternary (Complexe Loessique) has not been described in the masterlog (Figs. 3and4). As often occurs, the first meters are drilled during the previous phase to set up the conductor pipe. This first deposit in Rittershoffen can be clearly observed in the large quarry in Betschdorf, one km west of the well (see Ménillet et al., 2015 for more details). The next 71 m of Pliocene formation (Complexe Argilo-sableux) (Figs. 3 and4) was the subject of a complete coring during the first phase of exploration (Adam et al., 2014; Duringer and Orciani, 2015). This formation consists of a metric-scale clay, sand and sandy-clays alternation. The sands are white to gray according to the clay content, and the clays, pure or sandy, are brown to dark brown depending on the organic matter content. The top of the formation is usually sandy, whereas the lower part is more clayey. The sandy part of this formation can be examined in several sand quarries in the region of Rittershoffen (quarries of Riedseltz, Soufflenheim and Hatten in a circle of less than 1 km from the well). It is mainly a fluvial deposit with clay deposits rich in organic matter deposited in oxbow lake. The source of material (sandstone from Buntsandstein) is located on the rift shoulders less than 15 km east from Rittershoffen.
Fig. 6. Complete chrono-lithostratigraphic log of the Muschelkalk, Buntsandstein and granit with the gamma ray log showing all the limits and
geological formations encountered in Rittershoffen’s well. Orb.: Couches à Myophoria orbicularis; G.: Grès; C.: Couches; Musch.: Muschelkalk.
4.3 Oligocene
4.3.1 The Série Grise
The Série Grise (Figs. 3,4and7) is a typical marine unit (Sittler, 1965, 1969a, b; Doebl et al., 1976; Berger et al., 2005a,b;Roussé, 2006;Pirkenseer, 2007;Le Metayer et al., 2008; De Pietri et al., 2010; Roussé et al., 2012). The stratigraphic attribution (Fig. 7), owes much to the work of Gillet (1944,1950,1953,1954). The Série Grise includes from top to base (Figs. 4 and 7) four formations: the Marnes à Cyrènes, the Couches à Mélettes, the Schistes à Poissons and the Marnes à Foraminifères. The Série Grise is, in general, a gray-blue clayey and marly clayey formation interstratified intermittently by some metric to plurimetric, poorly cemented sandstone banks essentially in the topmost part of the Marnes à Cyrènes (Sittler, 1965;Roussé, 2006). In Rittershoffen, it lacks the complete Marnes à Cyrènes and around the upper half of the Couches à Mélettes displaying a stratigraphy gap of nearly 25 Ma (Fig. 4).
4.3.1.1 Couches à Mélettes
The Couches à Mélettes is made of monotonous gray to blue-gray marly clays intersected occasionally by some scarce sands and poorly cemented sandstone bodies up to 2 m thick. Its upper boundary is easily determined by three main
features (Fig. 4). First, the transition from sandy facies and pure clay from the Pliocene to marly clay as soon as we pass into the Couches à Mélettes is unquestionably the best signal. At the same time, the carbonate content goes from a value close to zero to approximately 20–25% in this formation. The second indicator is the GR signal, which shifts from a large swinging signal from right to left due to the sands/clays bodies’ alternation to a more regular serrated signal in the Couches à Mélettes. Lastly, a good indicator is the disappearance of the small milky quartz gravels existing only in the Pliocene.
4.3.1.2 Schistes à Poissons
The formation is made of brown, gray to black marly clays characterized by the occasional occurrence of bituminous marls with abundant remains of fishes (Gaudant, 1981; Pharisat, 1991a, b), particularly with amphisiles (Aeoliscus
heinrichi), giving another name to this formation: Schistes à
Amphisiles (less used today) (Fig. 4). The entry into the Schistes à Poissons is underlined by an increase of the GR (see also the next paragraph for more details) accompanied by a sudden increase in the gas concentration (which was very low before). From this depth, the gas occurrence remains important and relatively constant in the complete column until the middle Buntsandstein. Concerning the facies, the occurrence of a
Fig. 7. Comparative stratigraphic table between the formations of Pechelbronn (North URG) and the Potash Basins and Mulhouse/Sundgau
horst (South URG). The Marnes à Cyrènes and the topmost part of the Couches à Mélettes (Upper Rupelian) are lacking in the GRT wells. The Calcaire à Planorbes (Lutetian) is lateraly discontinuous and was not intercepted by the wells of Rittershoffen.
millimeter-scale alternation of gray to black marly clays with white chalk is unique in the entire column of the Tertiary. This specific facies easily visible on cuttings alone allows the unquestionable identification of the formation.
4.3.1.3 Marnes à Foraminifères
In the field, the Marnes à Foraminifères appears generally gray to beige, but this criterion cannot be used in the drilling, where all is gray (Fig. 4). Practically, the best criterion is the occurrence of abundant large-sized foraminifera and the disappearance of the millimetric chalk laminae characterizing the Schistes à Poissons. Up to 144 species of foraminifera have been described in the Marnes à Foraminifères, including some giant species such as Cyclammina placenta (Doebl et al., 1976) that are visible easily to the naked eye. The GR signals in both formations, Schistes à Poissons and Marnes à Foraminifères (Fig. 4), cannot be objectively used in the GRT-1 well because they correspond to the limits of the GR signals measured inside and outside the casing. However, observations of GR signals from GRT-2 well and the neighboring wells such as Schweighouse (SHM-1D) and Rohrlach (Roh.1) (both wells located at few kilometers from Haguenau) gave a good idea of how the signal is normally expressed. From the top of the Schistes à Poissons to the base of the Marnes à Foraminifères, three large successive radioactive trends can be observed. The two first rounded curves (which have the highest amplitudes potentially explained by the presence of organic matter) belong to the Schistes à Poissons; the third with a slowly decreasing amplitude belongs to the Marnes à Foraminifères.
4.3.2 Couches de Pechelbronn supérieures
The Couches de Pechelbronn supérieures are monotonous formations made of nearly 185 m of thick marly clays and marls containing fine sandstone beds and some gypsum in the upper part (Figs. 4and 7). The transition from the Marnes à Foraminifères to the Couches de Pechelbronn supérieures is characterized by the arrival of a sandy fraction absent in the previous formation and the first occurrence in the drilling of anhydrite, indicating the passage from fully marine to lacustrine/ evaporitic environments (Schnaebele, 1948;Sittler, 1969a,b; Courtot et al., 1972; Berger et al., 2005a,b;Duringer, 1988; Blanc-Valleron, 1990;Schuler, 1990;Roussé, 2006). The GR signal shifts sharply to the left and oscillates more in response to the occurrence of some sandstone banks. Otherwise, the basal part of the Couches de Pechelbronn supérieures can be identified with certitude due to the occurrence of the Zone Détritique de Glaswinkel developed only in the northern part of the Rhine rift. This detrital episode consists of an approximately 10 m thick sandstone formation that marks the base of the Couches de Pechelbronn supérieures. Its GR signature is one of the best signals in the Tertiary column with an important deviation to the left at the top of the Zone Détritique de Glaswinkel and a shift to the right at its base corresponding to the entry in the Couches de Pechelbronn moyennes (Figs. 4and7).
4.3.3 Couches de Pechelbronn moyennes or Zone Fossilifère
The Couches de Pechelbronn moyennes (Fig. 7), also called Zone Fossilifère, is in the URG, a very homogeneous
formation from north to south regardless of its geographic location (Figs. 4and7). In fact, it is the only formation that displays similar facies everywhere in the Rhine basin except along the detrital border where the facies are interbedded with conglomerates. It contains, from the top to the base, a succession of three representative fossils: the Zone à Hydro-bies, Zone à Bryozoaires and Zone à Mytilus (Sittler, 1965). All these fossils can be found easily even in the detrital border facies (Duringer, 1988). The occurrence of these fossils, especially the genus Hydrobia, frequently mentioned in wells, unambiguously characterizes the top of the formation. Concerning the sedimentary facies, this formation is generally more clayey with few and very thin sandstone beds and with scarce or total absence of anhydrite occurrences. The Zone Fossilifère represents the largest lacustrine transgression (Gaudant, 1979; Duringer, 1988; Fontes et al., 1991) in the Tertiary rift basin. The identification of the top of the formation is also based on the disappearance of anhydrite.
4.4 Eocene
4.4.1 Couches de Pechelbronn inférieures
This lower part of the Couches de Pechelbronn is not truly different from the Couches de Pechelbronn supérieures (Figs. 4 and7). It is made of calcareous clays with some interbedded fine sandstone beds (Fig. 4). Two obvious changes can be observed in the transition between the Couches de Pechelbronn moyennes and inférieures: the appearance of some reddish hues among the calcareous clays, which were dominated by brown and green colors before, and a drop in the percentage of carbonate from approximately 20% to approximately 5% or less (a transition from calcareous clays to pure clays). The GR log does not show objective changes on either part of the limit. Unusually, some thin and discontinuous decimetric coalbeds can occur in this formation.
4.4.2 Couche Rouge
The Couche rouge, made of brick red dolomitic to marly clays, is named after the characteristic red color of the formation (Figs. 4 and 7). The boundary with the previous strata corresponds exactly to the massive arrival of red mud from the drilling. As in the previous formations, some fine sandstone beds exist throughout the formation. Otherwise, part of the red color disappears progressively toward the base of the formation. Other criteria, such as the GR signal or the carbonate percentage, are not characteristic. Southward, approximatively from Strasbourg, this formation disappears and is replaced by salt and salty marls (Fig. 7).
4.4.3 Zone Dolomitique
Most of the time, the name of this formation is not truly justified because of the low dolomite content, though dolomite is not totally absent. Furthermore, the calcite percentage remains largely unchanged compared to previous zones. The Marnes Vertes à Limnées (upper part of the Zone Dolomi-tique), are made of marly clays, sometimes bituminous and interbedded by some fine sandstone beds (Figs. 4and7). The marls display several colors: light to dark gray and sometimes brown and green. The best justification for the determination of
the upper boundary is the arrival of a succession of fine-grained sandstone beds poorly represented in the Couche Rouge and a GR signal displaying a weak shift to the left. At the base of the Marnes Vertes à Limnées, the limit with the Marnes Calcaires Grises à Anhydrite has been put at the first occurrence of anhydrite, which also corresponds with the strong decrease/ disappearance of the sandstone downwards.
4.4.4 Calcaire à Planorbes
The occurrence of the formation of the Calcaire à Planorbes through the basin is highly variable (Fig. 7). Where it has been identified, it varies from few meters to about 30 m especially in the Bouxwiller area (25 km west from Haguenau) where the name was given (a quarry was opened in this formation in the first part of the twentieth century, but it is currently totally filled). This formation has not been identified in the well.
4.4.5 Zone de Transition
The Zone de Transition is a very complex and polymorphous set of marls and calcareous clays interbedded usually with gray to yellowish sandstone that is sometimes oxidized and often contains removed sediments from the underlying Jurassic series (Figs. 4and7). Furthermore, breccias and conglomerates as well as laterite and karst filling can occur according to the site (Sittler, 1965;Duringer, 1988). However, if we examine the Tertiary/ Jurassic unconformity in the field, the occurrence and thickness of this formation can be discussed because most of the time it does not exist: the Tertiary covers the Jurassic often without a transitional zone (Duringer, 1988). In Turckheim, for instance (close to Colmar), or in Britzingen (close to Oberweiler in Germany), the conglomerates or sandstones from the detrital border zone are plastered on the Jurassic limestone without any other deposits (Duringer, 1988). In old boreholes close to Strasbourg, the thickness is also highly variable: 0 m in Meistratzheim (MEI-2), Binnenweg (BWG.1), Lipsheim (LIP-2) and Schaeffersheim (SCS.101), approximately 10 to 12 m at Eschau (ESC-1) and Reimerswiller 1, and up to 17 m and 20 m in Rittershoffen 4 and Pechelbronn 1266, respectively. Our impression is that what is described as the Zone de Transition corresponds more to indecision about the determination of the Jurassic formation’s boundary than to a true formation. During the drilling, at the passage downwards to the Tertiary/Jurassic contact, the mudlogger put all deposits that cannot be identified with certainty as Tertiary or Jurassic in the Zone de Transition. In the well of Cronenbourg, about 70 m of Tertiary were even mistakenly put in the Jurassic. This explains the large thickness change from one well to another of this so-called transitional zone. We had the same problem during the drilling in Rittershoffen (GRT-1), which led us to define, at that time, a Zone de Transition of approximately 10 m. After new investigations in the field and examinations of Rittershoffen masterlog, cuttings and GR logs several years after the drilling, this thickness has been revised to 2 m, which is sufficiently large or perhaps even too much. Another important problem is that the measurements of the GR in GRT-1 in this critical transitional zone were measured through the casing. In summary, the best signals of the entrance into the Jurassic are the total disappearance of anhydrite and the arrival of marine fossils, as echinoderm fragments that are always visible on cuttings.
4.5 Jurassic
The 17 formations from the Jurassic (Figs. 3 and5), are difficult to identify fore sure with only cuttings for several reasons. The main problem comes from the great monotony of the facies composed of repetitive unicolor gray to black clays and marly clays. Otherwise, how should we identify the tops and bases of the formations, knowing that the limits of the formations are based mainly on ammonite zones, which cannot be used on an examination of cuttings? The second disadvantage is that there are no recent data since the works of Deecke (1884), Mieg (1885), Haug (1885, 1888), Van Werveke (1895, 1897), Schneider (1927), Gillet (1937), Théobald (1953),Blanalt et al. (1972)andSchmitt (1987). The most interesting works are undoubtedly those of Schirardin (1923,1938,1960a,b)recently synthetized byMénillet et al. (2015). Ménillet gives an interesting compiled log that summarizes the most important points of the Liassic formations. Inside the approximately 170 m thick clayey formations, two solid limestone banks evidenced in the Pliensbachian constitute the heart of the stratigraphic interpretation of the wells: the Calcaire de Kirrwiller and the Calcaire de Zinswiller. Inside the Dogger, the starting point is the presence of sandy clays characterizing the middle Aalenian (Formation de Schalkendorf). In the Hettangian, the monotonous marl-limestone alternation of the Calcaires et Marnes à Gryphées point out the lower part of the Lias. The research on formation boundaries in the Jurassic begins with the identification of these four valuable marker beds, giving the first frame. All other formations are then deduced from their positions.
4.5.1 Lower Bajocian
4.5.1.1 Marnes et Calcaires d’Ettendorf (Couches à Sonninia sowerbyi)
Described bySchirardin (1960a,b), this formation is made of sandy to silty marls interbedded with some thin limestone banks (Fig. 5). Oxidized facies occur intermittently. From the base of the Tertiary, the significant arrival of mixed sandstone/ limestone levels signals the entry into the formation. At the same time, the GR signal, which was relatively flat in the Zone de Transition, becomes more oscillatory and in all case, more radioactive than in the Tertiary.
4.5.2 Aalenian
4.5.2.1 Argiles Sableuses (Zone of Ludwigella concava) and Formation de Schalkendorf (Couches à Ludwigella murchisonae)
The Argiles Sableuses displays uniform facies made of sandy clays from the top to the base. The GR signal shows a continuous increase from the Marnes et Calcaires d’Ettendorf up to the base of the Argiles Sableuses (Fig. 5). The Formation de Schalkendorf, sometimes called Grès de Schalkendorf, is characterized by a sudden increase in poorly to moderately cemented sand amount, leading to sandstone beds cemented by clays and carbonates. In the field, the Formation de Schalkendorf displays a compact appearance due to the superposition of several solid sandstone beds forming small escarpments. This characteristic is well expressed in the GR
signal: weakly radioactive on the top of the formation, the GR increase slowly downward with large swings from left to right due to sandstone/marl alternations. These characteristics allow a clear limit to be marked between these two formations. In all cases, the massive arrival of sand unambiguously characterizes this middle part of the Aalenian.
4.5.2.2 Formation de Gundershoffen (Couches à Trigonia navis)
The facies of this formation is fairly monotonous and made mainly of gray to dark clays (Fig. 5). The first signal for the oncoming of this formation is the disappearance of the sandy fraction present in the previous formations. The GR signal is also typical to the formation. Largely swinging in the Formation de Schalkendorf due to the alternation of calcareous clays and solid sandstone banks, the GR signal becomes quite uniform with very minor variations from top to the base as soon as the Formation de Gundershoffen is entered.
4.5.3 Toarcian
4.5.3.1 Formation de Printzheim (Couches à Astarte voltzi) – Marnes de Schillersdorf (Couches à
Jurense) – Couches à Dactylioceras commune (from top to bottom)
Those three formations are presented together because it is very difficult to distinguish for certain their boundary (Fig. 5). The facies are very monotonous and made of gray to black clays. From top to base, the carbonate content remains close to zero, which is not as frequent in the Jurassic units. In the field, an examination of these samples to identify the different formations does not provide further information (the identification of the formation is based entirely on ammonite determinations). The GR signal is similar in amplitude to those observed in the previous formations but displays a continuous decrease in radioactivity (from right to left) from top to base. This characteristic signal marks the passage through the three formations from the base of the Formation de Gundershoffen.
4.5.3.2 Marnes à Posidonomyes
If the Marnes à Posidonomyes (Posidonomya bronni) or Schistes Carton is easily recognizable in the field due to its characteristic “paper cleavage”, its recognition is more difficult because the cuttings are similar to those of the three previous formations (Fig. 5). The bituminous aspect can be a signal, although it can also occur in other formations from the Lias. Concerning the gas amount, we can observe a small increase at the top followed by a decrease at the base. This is a good first signal, but the two best justifications are (1), the sudden increase from zero to 30% from top to base in the carbonate content attributed to the occurrence of fine-grained broken shells and (2), the very high GR value due to the occurrence of organic matter at the base of the formation. 4.5.4 Pliensbachian
4.5.4.1 Calcaire de Kirrwiller (Zone à Pleuroceras spinatum)
The Calcaire de Kirrwiller is one of the four marker beds of the Lias described above (Fig. 5). This formation is a
fossil-rich gray to blue hard limestone bank containing a great number of ammonites, bivalves, crinoid remains and petrified wood. This formation cannot be missed in either the field or the wells. With its 0.20 m to 1.50 m thickness (Ménillet et al., 2015), it is more a marker bed than a real formation. The GR signal is one of the most important characteristics for the Jurassic series. The GR low value corresponds to the compact limestone bank coming just after a high value from the base of the Schistes Carton due to the occurrence of organic matter.
4.5.4.2 Marnes à Septaria – Marnes à Ovoïdes – Marnes Feuilletées (from top to bottom) grouped in the Formation de Mutzenhouse, also called Couches à Amaltheus margaritatus
Due to the difficulty of literally separating these three units, they are presented together (Fig. 5). There is a succession of gray clays and silty clays without great facies variations. In the geologic map (Ménillet et al., 2015), these three formations are grouped under the name of Formation de Mutzenhouse for the same reason. The GR signal does not show objective variations. Without the previous good marker bed (Calcaire de Kirrwiller), it would be totally impossible to know in which part of the Lias we are. The given limits inFigure 5are based mainly on the known facies parameters described byMénillet
et al. (2015). In all cases, finding the true limits remains difficult. In the field, Marnes à Septaria and Marnes à Ovoïdes can be differentiated due to the occurrence of well-developed
septaria nodules of approximately 5 to 20 cm in the first unit
and limestone ovoids on the same scale in the second unit.
4.5.4.3 Calcaire de Zinswiller (marker bed with Prodactylioceras davoei)
Within the monotonous clayey/marly Middle Lias (Pliensbachian), it is impossible to miss the Calcaire de Zinswiller, the second and best limestone marker bed for the Lias (Fig. 5). Based on scarce field data,Ménillet et al. (2015) give this bed a thickness of approximately 1 m, but in Rittershoffen, this marker bed displays a larger thickness. In GRT-1, it exceeds 5 m. In neighboring wells at few kilometers from Rittershoffen, such as Schweighouse (SHM-1D), Rohrlach (Roh.1) or Oberroedern (Ober 101), this thick limestone bank was not named, but it exists in same thickness and with exactly the same GR signature at the same stratigraphic level in the Lias. This marker bed is made of a solid and compact limestone bank often subdivided into smaller units. Echinoderms, belemnites and ammonites are common on outcrops. The GR log displays an unquestionable signal characterized by a sharp and strong curve to the left at the top, followed by a sharp and strong curve to the right at its base, drawing perfectly the shape and precise size of the marker bed. There are few formations displaying such a well-expressed GR signal as the Calcaire de Zinswiller.
4.5.4.4 Formation de Bossendorf, also called Marnes à Zeilleria numismalis
The Formation de Bossendorf is made of light gray marls containing many fossils, especially the flat Terebratula (Zeilleria numismalis), giving the name to the formation (Fig. 5). An objective identification of the formation is based
entirely on the presence of the massive limestone of the Calcaire de Zinswiller formation just above and on the Calcaire de Gundershoffen formation located just below. On the GR log, the flattened radioactive pulse between the two marker beds characterizes the Formation de Bossendorf.
4.5.5 Sinemurian and Hettangian
4.5.5.1 Calcaire de Gundershoffen
The Calcaire de Gundershoffen is quite similar to the previous marker bed (Calcaire de Zinswiller) but poorly developed (Fig. 5). In the field, it sometimes differs by the occurrence of ferruginous oolites, which are not always visible on cuttings. The GR signal displays a discrete flattened signal to the left just below the well-developed GR signal to the right from the formation of Bossendorf.
4.5.5.2 Formation d’Obermodern or Argiles à Aegoceras dudressieri
This formation is made mainly from top to base of clays containing small amounts of scattered silt and sand (Fig. 5).
The color is light to dark gray. The GR log is relatively uniform from top to base. In fact, it is difficult to find reliable criteria for the identification of this clayey formation. The best method is the identification of the Calcaire de Gundershoffen and the Calcaires et Marnes à Gryphées on top and base from the formation, respectively.
4.5.5.3 Calcaires et Marnes à Gryphées (Liogryphaea arcuata)
This formation at the base of the Lias, also called Formation de Hochfelden, is one of the easiest to identify for several major reasons (Fig. 5). The first reason is its typical facies characterized by a monotonous marl-limestone alterna-tion from the top to the base of the formaalterna-tion. The size of the limestone banks varies from approximately 20 to 40 cm, and the marls vary from 30 to 80 cm on average, giving a typical repetitive high-low GR signal. The second reason is the sudden increase in the carbonate content from close to zero to 40% at the top of the formation, which is the cause for the leftward shift of the GR signal. The sudden fall in the carbonate percentage at the base of the formation marks the passage to the Keuper formations. The GR is not left out. Indeed, as soon as we cross the Lias-Keuper boundary, the GR shows a general shift to the right due to the disappearance of limestone banks combined with the sudden increase in clays from the Argiles de Levallois characterizing the top of the Keuper.
4.6 Keuper
Except for the thin sandstone beds in the Upper, Middle and Lower Keuper (Grès Rhétiens, Grès à Roseaux and Grès de la Lettenkohle respectively), the Keuper is mainly clayey, marly, dolomitic and anhydritic (Figs. 3,5and8). Its thickness is close to 200 m (Figs. 5and8). The sandstone bodies from middle and lower Keuper characterize fluvial environments (Wurster, 1964; Emmert, 1965; Palain, 1966) whereas sandstone from Upper Keuper are interpreted as shallow marine deposits probably tide dominated (Durand, 1980). The clayey facies of the rest from the Keuper are mainly evaporitic. Due to the rapid alternation of massive gypsum, dolomite banks and true clays, the GR displays an amplitude of radioactivity ranging from 5 to 220 API units, which is unique in the entire sedimentary column. This huge “right to left” oscillation from top to base of the Keuper is one of the most prominent criteria for the identification of the Keuper. The second criterion is the wide range of colors, dominated by red, blue, purple, white, and green as well as black and gray. The third criterion is the occurrence of anhydrite, which is totally absent in the Jurassic. Finally, the determination of the limits of the formation is also based on the three sandstone marker beds mentioned above. Many studies have been devoted to the Keuper (Ricour, 1962). Among them, Van Werveke (1897), Finaton (1936) and Schnaebele (1948) are dedicated to the stratigraphy and geologic mapping of the Pechelbronn Basin. The Lower Keuper (Lettenkohle) has been studied byDuringer (1982, 1984, 1987, 1999), Duringer and Gall (1987), and Duringer and Doubinger (1985). Palain (1966) focused his research on the Grès à Roseaux in Lorraine. The latest studies have focused on the general stratigraphy and stratigraphic cycles (Bourquin and Guillocheau, 1996; Durand and
Fig. 8. Chrono-lithostratigraphic table of the Muschelkalk and the
Bourquin, 2001; Ménillet et al., 2015). The stratigraphic nomenclature being a little complicated, we propose a synthetic table of the Keuper and Muschelkalk inFigure 8. 4.6.1 Upper Keuper (Rhaetian)
4.6.1.1 Argiles de Levallois
The red to brown color in natural outcrops disappears almost completely from wells where the formation appears generally gray to light gray (Figs. 5and8). Silts and micas are present. Compared to the Formation de Hochfelden (Calcaires et Marnes à Gryphées) just above, the GR displays a rapid shift to the right followed by a constant increase in the value up to the base where the radioactivity reaches 200 API units, which is the highest radioactive signal since the top of the sedimentary column (a value that will be exceeded in GRT-1 only by the hugest signal at the top of the Buntsandstein).
4.6.1.2 Grès Rhétiens
The Grès Rhétiens is one of the three sandstone bodies constituting a good marker bed in the Keuper (Figs. 5and8). Under the most favorable conditions, this formation is constituted by a massive sandstone unit that is approximately 15 m thick. Its color is light gray to light green without evident clays or marl layers beyond a few centimeters. The cementation is variable according to outcrops, from well to poorly cemented. In fact, the recognition of the formation is very easy due to a low GR signal compared to the high value (often over 150 g API) just above and the exceptionally well-sorted fine sand that occur for the first time in the well since the Middle Tertiary. However, the thickness and facies can change drastically laterally over a few kilometers. The thickness reported byMénillet et al. (2015)in a circle of approximately 20 km from the well of Rittershoffen ranges from 15 m to 0 m. Moreover, according to the location, this formation can be characterized only by unconsolidated fine sand or clayey siltites. Under such conditions, the high value of the GR from the bottom of the Argiles de Levallois marks the top of this Rhaetian sandstone. In the geologic map of Haguenau (Ménillet et al., 2015), the Grès Rhétiens are placed in a larger unit called Formation de Froeschwiller or Grès et Pélites à Avicula contorta. The main justification is that the sandstone is not always well defined but belongs to a larger sandy/silty/ clayey unit in which the Grès Rhétiens appears occasionally with variable thickness. In all cases, the sandiest facies are located at the top of the Formation de Froeschwiller, whereas siltier and more clayey facies occur at the base. This leads to a GR signal of relatively low radioactivity at the top that progressively increases toward the base.
4.6.2 Middle Keuper
4.6.2.1 Marnes Irisées Supérieures 4.6.2.1.1 Argiles Bariolées Dolomitiques
The Argiles Bariolées Dolomitiques unit is very homoge-neous in facies, mostly the upper two-thirds of the formation (Figs. 5and8). It is made of multicolored clays and marls and is sometimes lowly dolomitic. It is in this formation that the colors are the most variable. They are usually fairly pale in color, pinkish to purplish, greenish, gray or bluish. These clays
and marls alternate with centimetric to decimetric solid dolomitic banks colored most of the time either yellow or white. The first criterion to recognize this formation is therefore the large variety of colors associated with a sudden increase in the dolomite proportion (up to 20% on total carbonates), which is the highest value since the top of the well. The second criterion is the great amplitude of the oscillation of the GR signal linked to the high frequency of clay/dolomite/anhydrite centimeter to decimeter alternations.
4.6.2.1.2 Argiles de Chanville
The arrival of this formation during mud logging cannot be missed because of the intensity and persistence of the red color associated with obvious clayey facies (Figs. 5and8). These two aspects alone are enough to characterize the formation in both the well and the field. It is accompanied by a striking GR signal to the right (up to 200 API units) that slowly decreases toward the base of the formation.
4.6.2.2 Marnes Irisées Moyennes 4.6.2.2.1 Dolomie de Beaumont
This pure and massive well-developed dolomite forma-tion in Lorraine with a thickness of 10 m (Ricour, 1962; Bourquin and Durand, 2007,2008) is poorly represented and rarely reported in wells in the Alsace region (Figs. 5and8). After Ménillet et al. (2015), in the north of Haguenau, this formation rarely exceeds 1 m when it is present and is entirely replaced by banded anhydrite. Therefore, in the absence of dolomitic facies, the arrival of a sudden large proportion of anhydrite can be considered the best signal of the top of this formation. The GR log displays a persistent weakly radioactive signal.
4.6.2.2.2 Argiles Bariolées Intermédiaires and Grès à Roseaux
The determination of the Argiles Bariolées Intermédiaires is based mainly on the characterization of both surrounding formations: the Dolomie de Beaumont and the Grès à Roseaux (Figs. 5and8). We can concretely put the upper limit of the Argiles Bariolées Intermédiaires at the disappearance of the anhydrite, which represents the base of the Dolomie de Beaumont, and the base of the formation can be placed at the arrival of the sandstone from the Grès à Roseaux. The term “Roseaux” (meaning “reeds” – genus Arundo or Phragmites) of the formation is a bad translation because it consists in fact of horsetail (Equisetum). It is a clayey fine-grained sandstone formation green in color (when not oxidized), and it is nearly similar in facies to the sandstone of the Grès Rhétiens (Upper Keuper) and the Grès de la Lettenkohle (Lower Keuper). Largely channelized, its thickness varies from a few meters to 25 m in less than 1 km (Ménillet et al., 2015) and may be even totally absent in some places, which means that its determination can be sometimes uncertain. The best signal is still the appearance of green-colored sandy facies with the occurrence of micas. The readability of the GR signal is directly linked to the variable thickness of the formation: strongly to the left in well-developed sandstone or practically nonexistent if the thickness of the formation is low. If this is the case, it is necessary to look for traces of sands in the cuttings.
4.6.2.3 Marnes Irisées Inférieures
The formation is made mainly of clays that are often silty (Figs. 5and8). The total carbonate content never exceeds 10%. On the other hand, anhydrite is present almost from top to base, thereby constituting the main criterion for the determination of this thick formation (Fig. 5). In the field, this formation displays many salt pseudomorphs that cannot be observed in the cuttings. The GR signal is not characteristic. It shows a “right-left” alternation defining an irregular log motif linked to the occurrence of banded anhydrite inside the clays. The best criterion is the determination of the base of the previous formation (Grès à Roseaux with a high shift of the GR) and the top of the dolomitic Lettenkohle Formation characterized by a sudden increase in the carbonate percentage, including dolomite.
4.6.3 Lower Keuper
Located between the marine Muschelkalk and the evaporitic Middle Keuper, the Lettenkohle Formation is very easy to recognize in the field due to its mixed continental/ marine facies, which includes tidal and fluvial environments (Duringer, 1987; Duringer and Gall, 1987). The Lettenkohle Formation is divided from top to base into three formations: the Dolomie Limite, the Argiles de la Lettenkohle and the Dolomie Inférieure (Duringer, 1987) (Figs. 5and8).
4.6.3.1 Dolomie Limite
The Dolomie Limite marks the top of the Lettenkohle. It consists of a 1 m thick yellow dolomitic shelly limestone which is difficult to identify with certainty in wells (Figs. 5and8). In geologic maps, this formation is sometimes attached to the massive dolomite bank of the topmost part of the following formation, which gives the wrong thickness by a half-dozen meters. In all cases, the upper boundary can be placed exactly on the disappearance of anhydrite, replaced by a large amount of dolomite.
4.6.3.2 Argiles de la Lettenkohle
The Argiles de la Lettenkohle are often called Marnes Bariolées, which can introduce some confusion with the Marnes Bariolées from the Middle Muschelkalk or from the Middle Keuper since the formation is not multicolored, as expected from the name “bariolées” (Figs. 5 and 8). The formation is made of yellow to blue clays and dolomitic marls alternating with decimetric beds of massive calcareous dolomites. Those latter appear especially in the upper part of the formation sometimes called Dolomie à Anaplophora because of great abundance of this fossil. The first signal for the identification of entry into the Lettenkohle is a sudden increase in the carbonate content up to 40%, at least half or more of which is composed of dolomite. The high frequency of dolomite banks interbedded with marls on the upper part gradually decreases downward to the benefit of clayey facies. This results in a GR signal displaying from top to base a progressive increase in radioactivity up to a maximum of 200 API units corresponding at the base of the formation to a plurimetric dark blue pure clay unit containing fossil plants (Duringer, 1982, 1987; Grauvogel-Stamm and Duringer,
1983). The sandstone body of the Grès de la Lettenkohle is situated on the base of these clays, giving a thin and low GR excursion. The rapid shift to the left of the GR signal downward marks the passage into the following formation (Dolomie Inférieure).
4.6.3.3 Dolomie Inférieure
This formation is made of a succession of decametric to metric yellow massive dolomitic limestones with few thin marl intercalations, especially in the topmost part of the formation (Figs. 5and8). In the field, shelly beds and fossils are very common and consist of a mixed marine/brackish water fauna with in situ Lingula, Estheria and vertebrate remains (fishes and reptiles) (Duringer, 1982,1987). The identification of this formation is easy due to the arrival of a great amount of carbonate reaching up to 80%, including approximately 20% dolomite. The GR signal shifts strongly to the left but displays some slight oscillations to the right, attesting to the occurrence of some thin marl alternations. The roof of the formation can be marked at the strong radioactivity decrease after the clayey unit of the previous formation.
4.7 Muschelkalk
The Muschelkalk represents the marine episode succeeding the fluvial depositional environments of the Buntsandstein and preceding the evaporitic-dominated sedimentation of the Keuper. It displays mainly argillaceous limestones, marl/ limestone alternations, dolomites, dolomitic marls and some anhydrite episodes in the lower part of the middle Muschelkalk (Figs. 3,6 and 8). The Upper Muschelkalk is a pure marine deposit displaying typical stenohaline organisms, such as cephalopods and echinoderms (Haguenauer, 1963; Kozur, 1974;Aigner, 1979,1985;Duringer, 1982,1984,1985;Duringer and Vecsei, 1998; Vecsei and Duringer, 2003). The Middle Muschelkalk (Van Werveke, 1917;Geisler, 1978;Adloff et al., 1982;Geisler-Cussey, 1986) is the result of both evaporitic and marine environments. The Lower Muschelkalk (Schumacher, 1890,1891; Van Werveke, 1897; Théobald, 1952; Perriaux, 1961;Schwarz, 1970) is made of dolomitic marls, dolomites and sandstones. It represents the marine transgression covering the siliciclastic fluvial-dominated Buntsandstein. A synthetic strati-graphic table of the Muschelkalk and Keuper is given inFigure 8. 4.7.1 Upper Muschelkalk
The three formations characterizing the Upper Muschel-kalk are named after their characteristic fossils, namely,
Terebratula, Ceratites and Entroques (crinoids),
correspond-ing respectively to the followcorrespond-ing from top to base of: the Calcaire à Térébratules, the Couches à Cératites and the Calcaire à Entroques (Figs. 6 and 8). Echinoderm remains (Entroques) can be found as microscopic fragments in all the upper Muschelkalk, but macroscopic pieces occur only in the Calcaire à Entroques. In many old well reports, the boundary between the Couches à Cératites and Calcaire à Entroques is often wrong because it is based only on the occurrence of small crinoid remains, while the real criterion is the disappearance of the marl content and the arrival of massive limestone without marl intercalations.
4.7.1.1 Calcaire à Térébratules
In the field, this formation is made of two characteristic massive shelly limestone banks that are approximately 1 m thick, each with numerous Térébratules (Coenothyris vulgaris) separated by approximately 20 to 30 cm of argillaceous limestone (Figs. 6and8). Small decimetric- to metric-scale oysters reefs (Placunopsis ostracina) can occur (Duringer, 1985). Some occurrences of oyster reefs are located also in the upper part of the Couches à Cératites but it is less frequent (Durand, 2010). The identification of the upper limit is particularly based on the disappearance of the dolomite content characterizing the previous formation (Dolomie Inférieure). The GR signal is not very useful insofar as marls are almost completely absent in both formations, giving a strong signal to the left.
4.7.1.2 Couches à Cératites
The formation is made of a monotonous alternation of limestones and marls (Figs. 6 and 8). The thickness of the limestone banks varies on average from 5 to 50 cm, whereas the marls can reach 1 m or more according to their geographic position in the basin (Duringer, 1982,1984,1999,Duringer and Hagdorn, 1987). The texture of the limestones is micritic and calcarenitic, including numerous shell fragments. The best criterion for the identification of this formation is given by the GR signal, slightly radioactive on the upper part, progressively increasing toward the middle formation and again slightly decreasing toward the bottom of the formation. This “back and forth” trend from top to base along the 35 m deposits is directly linked to the limestone/marl ratio. On top of the formation, this ratio is very high (15 or more). Then, toward the middle of the formation, the thickness of the marl increases progressively, whereas the thickness of the limestone bed decreases to a limestone/marl ratio of up to 0.5 or even more in the Lorraine Basin (Duringer and Hagdorn, 1987). From the middle to the base of the formation, the limestone/marl ratio increases again up to the top of the Calcaire à Entroques.
4.7.1.3 Calcaire à Entroques
The Calcaire à Entroques is the most characteristic limestone formation drilled in the well (Figs. 6 and 8). It consists of a succession of massive limestone banks stacked one over the other without marl intercalations except on the few first meters at the transition with the Couches à Cératites at its top (Duringer, 1982,1999;Duringer and Hagdorn, 1987). The name comes from the great abundance of complete or broken macroscopic crinoid remains occurring from the base to the top of the formation interspersed only by a few often deeply bioturbated micritic beds. This formation also displays a large amount of broken shells and small, well-rounded oolites (with a diameter of less than one mm), especially toward the base. In the well, the large amount of calcite (up to 85%) concomitant with the total disappearance of marls marks the entry into this formation. Therefore, the top of the formation is placed exactly where the carbonate amount strongly increases and the marl decreases. It also corresponds to the lowest GR signal at the base of the Couches à Cératites.
4.7.2 Middle Muschelkalk
4.7.2.1 Dolomie à Lingules or Couches Blanches
Despite the name “à lingules”, this formation is poor in fossils. It is made of yellow massive calcareous dolomite beds showing sometimes a white chalky facies in the Lorraine area. The formation is split into decametric- to metric-scale units (Figs. 6and 8). Very poor in clays or marls, the GR signal remains quite similar to that of the previous formation. Concerning the upper limit, the disappearance of echinoderms remains the first main signal of entry into this formation. The second signal is the sudden increase in the dolomite percentage (approximately 20%), which was almost totally absent in the Calcaire à Entroques (even if some specific bank can contain some dolomite). The third signal is the occurrence of banded black chert up to 10 cm thick in the upper part of the formation directly under the limit of the Calcaire à Entroques. It is the only place from the entire sedimentary column where chert can be found easely.
4.7.2.2 Marnes Bariolées
The upper part is characterized by dolomite banks alternating with dolomitic marls (Van Werveke, 1917), similar to the base of the Dolomie à Lingules (Figs. 6and8). In fact, this dolomitic transitional facies from the Dolomie à Lingules to the Marnes Bariolées are sometimes placed on several geologic maps in one or other formations which explain their apparent thickness variation. Moving down-ward, variegated clays and clayey dolomitic marls rapidly appear in grays, blacks, red and green colors mixed with large thicknesses of anhydrite and dolomite banks. Due to great facies similarities with the base of the Dolomie à Lingules, the entry into the Marnes Bariolées is not always clear. In a practical way, we can mark the upper limit of the formation where the total carbonate content decreases, accompanied by a low shift to the right of the GR signal due to an increase in marls. The drastic fall in the carbonate content and the arrival of anhydrite characteristic for the formation definitively remove any doubt.
4.7.3 Lower Muschelkalk
Except for the basal part of the Lower Muschelkalk (Grès Coquillier), which is well exposed in many quarries, no good outcrops exist in the Lower Muschelkalk for comparison (Figs. 6and8). The only references are those of Schumacher (1890,1891)performed for the geological map of Bitche, and recently used by Ménillet et al. (2015). According to these studies, the Lower Muschelkalk can be divided into seven units, displayed as follows from top to base: the Couches à Myophoria orbicularis (Rutte, 1958), the Schaumkalk, the Wellenkalk, the Wellenmergel, the Couches à Térébratules, the Couches à Myacites and the Grès Coquillier (also sometimes called the Zone à Entroques but less used). Since it has not been possible to define the objective boundaries of the top and base of each formation, the first three were grouped into one comprehensive unit as well as the next two (Fig. 6). The last two formations remain separated.
4.7.3.1 Couches à Myophoria orbicularis – Schaumkalk – Wellenkalk
These three formations grouped in Zone Dolomitique supérieure consist mainly of dolomite beds alternating with some very fine dolomitic marl layers (Figs. 6and8). While it is very easy to recognize most of these formations in the field (the facies of the Schaumkalk and Wellenkalk are very character-istic), it is almost impossible on cuttings. The first important signal of the entry into the tops of these three formations is the sudden increase in the carbonate percentage (approximately 60%), of which two-thirds is dolomite. The second criterion is the total disappearance of gypsum characterizing the Marnes Bariolées. The third criterion is the low GR signal corresponding to the occurrence of solid, relatively massive carbonate facies without marls, especially the Couches à
Myophoria orbicularis on the top.
4.7.3.2 Wellenmergel and Couches à Térébratules
These two formations placed in the upper part of the Zone inférieure Argileuse consist of dolomitic marls that alternate with thin beds of dolomites and rarely fine-grained sandstones (Figs. 6 and 8). In the field, many fossils, including brachiopods, pelecypods and echinoderms, which have not been objectively observed on cuttings, appear on scarce outcrops. The calcite content remains unchanged (approxi-mately 20%) from top to base, whereas the dolomite increases to 35% at the base of the formation. The GR signal increases slowly from the top to the base from 50 to 150 API units, retracing the progressive downward enrichment on dolomitic marls. At the extreme base, the strongly flattened signal to the left represents the main Terebratula bank described by Schumacher (1891)under the name “Haupt-Terebratel Bank”. Another signal to the left, a half dozen meters above, helps to locate the second Terebratula bank (Obere Terebratel
bank-Spiriferina, in the paper ofSchumacher, 1891).
4.7.3.3 Couches à Myacites
In the field, this formation consists of yellow silty clays interbedded with some thin decametric sandstone beds, which become more numerous toward the base of the formation (Figs. 6and8). Downward from the main Terebratula bank at the base of the Couches à Myacites, the GR signal displays a progressive increase in radioactivity. The base of the formation is characterized by the progressive arrival of sandstone concomitant with the high percentage of clays and the progressive disappearance of dolomite.
4.7.3.4 Grès Coquillier
The Grès Coquillier is an alternating sandstone/marl-dominated formation (Figs. 6and8). The sandstones are made of beds with thicknesses ranging from 20 to 80 cm, and marls vary from few centimeters to a half meter. The sandstones as well as the marls are mostly gray to light green, becoming yellow in weathered outcrops. Under good conditions, one or two crinoid-rich banks not identified in the cuttings can be observed (Schumacher, 1891). The upper limit is easy to identify due to the rapid change from clayey dominated facies to sandstone banks accompanied by a significant decrease in
the total carbonate and dolomite content (10–15% on average compared to 40–60% before). The occurrence of well-developed sandstone banks alternating with marl leads to a GR signal showing large oscillations from right to left. The Grès Coquillier is interpreted as shallow marine deposits close to the detrital input area (Ménillet et al., 2015).
4.8 Buntsandstein
The Buntsandstein sensu gallico is attributed in eastern France to the Lower Triassic and Upper Permian (Lopingian) (Durand, 2010, 2013, Ménillet et al., 2015) and consists mainly of a 450 m thick continental red sandstone that is fine to coarse-grained with some conglomeratic beds (Figs. 3and6). The Buntsandstein is subdivided into eight formations with thicknesses varying from 10 to 100 m. From the top to the base, these formations are the Grès à Voltzia and the Couches Intermédiaires in the Upper Buntsandstein, the Poudingue de Sainte Odile, the Couches de Karlstal, the Couches de Rehberg and the Couches de Trifels in the Middle Buntsandstein and the Grès d’Annweiler and the Grès Anté-Annweiler in the Lower Buntsandstein. Many works have been devoted to their thick detrital continental deposits (Perriaux, 1961;Gall, 1971,1972, 1985;Durand, 1978,2010;Dachroth, 1985;Mader, 1985and many others). The greatest part of the Lower Triassic is mainly fluvial with some Aeolian episodes in the Karlstal formation (Durand, 1987). Only the youngest formation of the Grès à
Voltzia shows progressive marine influences from the middle
part of the Grès à Meules and well developed in the Grès Argileux with an objective basal transgressive surface between the two units.
4.8.1 Upper Buntsandstein
4.8.1.1 Grès à Voltzia
The Grès à Voltzia (Perriaux, 1961;Gall, 1971,1972;Gall and Grauvogel-Stamm, 2005) is divided into two units, upper and lower: the Grès Argileux and the Grès à Meules (Fig. 6). The Grès Argileux displays a wide range of facies made of an alternation of clays, sandstones, and dolomitic and calcareous sandstones gray and green dominantly colored, and sometimes light pink. The thickness of massive banks as well as clay units can reach 1 m or more. The Grès à Meules is composed of fine-grained clayey sandstone colored gray to light pink represented by a succession of thick lenticular beds up to several meters in thickness separated by decimetric to pluridecimetric lenticular red to green clays and silty clays. The top of many sandstones are particularly rich in micas. The first criterion of entry into the upper Grès à Voltzia (Grès Argileux) is the arrival of a great amount of sands mixed with clays. The dominant colors are gray and green, but some light red color can occur. The second criterion is the reduction in the total carbonate content to 10% with the persistence of some percentage of dolomites. At the entry into the lower Grès à Voltzia (Grès à Meules), the cuttings are dominated by light red well-sorted sands. At the same time, the decrease in the total carbonate content continues with a total disappearance of dolomite. The GR signal is characteris-tic but slightly complex. From the top of the Wellenmergel downward, a continuous and gradual increase in the GR signal can be observed until an unusually large radioactive peak