Analysis of a Duo-Selecting Membrane Reactor for the
Water-Gas Shift
by
AliciA Jillian Jackson Hardy
Submitted to the Department of Mechanical Engineering
in partial fulfillment of the requirements for the degree of
Master of Science in Mechanical Engineering
at the
MASSACHUSETTS INSTITUTE OF TECHNOLOGY
May 2004 LQJ
/
C - C )The author hereby grants the Massachusetts Institute of Technology permission to
reproduce and to distribute copies of this thesis document in whole or in part.
A.epartment ofq4echanical Engineering
7 May 2004
C ertified by ...
Ernest G. Cravalho
Professor of Mechanical Engineering
Thesis Supervisor
A ccep ted by ...
Ain A. Sonin
Graduate Officer
MASSACHUSETTS INS OF TECHNOLOGYJUL 2 0 2004
Analysis of a Duo-Selecting Membrane Reactor for the Water-Gas Shift
byAliciA Jillian Jackson Hardy
Submitted to the Department of Mechanical Engineering on 7 May 2004, in partial fulfillment of the
requirements for the degree of
Master of Science in Mechanical Engineering
Abstract
The water-gas shift reaction is an exothermic and reversible catalytic process that converts carbon monoxide and water (steam) to hydrogen and carbon dioxide. In regard to energy-related issues, the water-gas shift is part of the process of reforming
hydrocarbons to produce hydrogen suitable for fuel cells; carbon monoxide poisons the low temperature fuel cells (phosphoric acid and polymer electrolyte membrane fuel cells) and must therefore be removed. The reaction is limited by thermodynamic equilibrium at higher temperatures, while kinetics are unfavorable at the lower temperatures. Current commercial technology uses at least two adiabatic beds with cooling between the beds to address this issue. The first bed is a high temperature shift in which reaction rates are high, and the second is a low temperature shift where final equilibrium conversions are high. The high temperature shift is made less unfavorable thermodynamically by reacting the gas with an excess of steam. Membrane reactors are expected to eliminate the
thermodynamics/kinetics trade-off by separating either the hydrogen or the carbon dioxide while the forward reaction is in progress. In such a reactor, excess steam might not be required; commercial catalysts are not well studied under conditions in which the pressure is high and the feed is near stoichiometric, as they would be in membrane reactor. Further study of old and new catalysts under these conditions is necessary step toward making membrane reactors marketable. There is a whole body of literature regarding new catalysts for the water-gas shift, and there are certainly other methods to produce hydrogen besides steam reforming natural gas. However, in order to be
marketable now, fuel cells need to use primary fuel sources from existing production and distribution networks (such as natural gas, gasoline, diesel fuel and jet fuel), and the exhaustive body of knowledge that has been gathered over the past century regarding today's common water-gas shift catalysts suggests that there are under-investigated design options to pursue. In this vain, the current work studies how to more efficiently use the most common and best understood high temperature water-gas shift catalyst: ferrochrome Fe304 with a Cr203 promoter. The current work suggests the application of this catalyst in a membrane reactor environment in which the partial pressures of both hydrogen and carbon dioxide are both low.
Thesis Supervisor: Ernest G. Cravalho Title: Professor of Mechanical Engineering
Acknowledgments
I would like to acknowledge Professors Cravalho, Brisson, Smith, Sonin, Ghoniem,
McKinley and Mikid, all of whom have very positively influenced me during my
development as a graduate student in the Master's program and while I assembled this body of work.
I would also like to acknowledge the graduate students with whom I have worked most closely and from whom I have consistently received support and encouragement: Franklin Miller, Fritz Pierre, Omar Roushdy, Matthew Traum, Sofy Tarud, Joan Tisdale, and Przemek Jamroz.
Contents
1 Introduction 12
1.1 Hydrogen Production Today . . . . 12
1.1.1 Consumption Around the World . . . . 12
1.1.2 Assessment of a Steam-Methane Reforming Plant . . . . 13
1.2 Some Research Efforts in Hydrogen Production and Reformer Technology . . . . 17
1.2.1 Additional Hydrogen Sources . . . . 17
1.2.2 On-board Hydrogen Production . . . . 18
1.2.3 Membrane Development . . . . 18
1.2.4 Cost as Motivation . . . . 19
2 Membrane Reactors 21 2.1 Advantages of Membrane Reactors . . . . 22
2.1.1 Steam-Methane Reforming . . . . 22
3 The Current Work 28 3.1 The Water-Gas Shift . . . . 28
3.2 Current Means of Catalyzing the Shift . . . . 30
3.3 Future Plans for Catalyzing the Shift . . . . 31
3.4 The Proposed Work . . . . 32
3.4.1 M em branes . . . . 33
4 The Thermodynamic Model 35 4.1 First and Second Laws of Thermodynamics . . . . 35
4.2 Isothermal Mode of Operation . . . . 37
4.3 Adiabatic Mode of Operation . . . . 37
5 The Kinetic Model 44 5.1 Fundamentals of Equilibrium . . . . 44
5.2 Gas-Phase Kinetics . . . . 49
5.2.1 Elementary Reactions . . . 49
5.2.2 Kinetics of the Homogeneous Water-Gas Shift . . . . 53
5.3 Heterogeneous and Catalytic Kinetics . . . . 59
6 Future Work 62 6.1 K inetics . . . . 62
6.2 Mass Flow Through Membranes . . . . 64
7 Conclusions 67 8 References 69 A Codework 72 A.1 Thermodynamic Model . . . . 72
A.1.1 Isothermal Mode of Operation . . . . 72
A.1.2 Adiabatic Mode of Operation . . . . 80
List of Figures
1.1 Block diagram of the hydrogen plant (Spath and Mann, 2002). . . . . 14 2.1 Schematic of a reforming membrane reactor. A porous catalyst is backed by a
hydrogen-permeable membrane. As the reaction proceeds forward, hydrogen is se-lectively removed and exits in a separate stream at low pressure. . . . . 22 2.2 Illustration of the relationship between extent of reaction and total pressure in a
non-membrane reactor. . . . . 24
2.3 Illustration of where equilibrium conditions are expected in a membrane reactor. . . 25
2.4 Dependence on pressure of the extent of reaction in a membrane reactor. . . . . 26 3.1 Dependence of the equilibrium constant for the water-gas shift reaction on temperature. 29
3.2 Schematic of the proposed membrane reactor for the water-gas shift. Carbon monox-ide and steam enter the reactor at high pressure, react on the surface of a porous catalyst that is backed on one side by a H2-selective membrane, and on the other side by a C0 2-selective membrane. These two products of the reaction exit the reactor
in two separate, low-pressure streams; the exhaust consists primarily of steam with trace amounts of unreacted CO and trace amounts of the products. . . . . 32
4.1 Set-up for the thermodynamic model. . . . . 35
4.2 Illustration of the relationship between q and 3 for the isothermal case. As expected, equilibrium conversions are highest at the lower temperatures. . . . . 38
4.3 The second law limit on the extent of reaction in the isothermal case when q is too low . . . . 39
4.5 Comparison of the extents of reaction in the two isothermal cases (T = 600 K and T = 750 K), the adiabatic case, and the limiting adiabatic case when the extent of
reaction is determined from the equilibrium constant at the flame temperature. . . . 41 4.6 Comparison of entropy generation in the two isothermal cases (T = 600 K and
T = 750 K) and the adiabatic case. . . . 42 4.7 Dependence of the flame temperature on r7 for r1 > 7min ~ 6 . . . . 43
5.1 Illustration of the linear relationship between ln Kp and 1/T. . . . . 48
5.2 Illustration of how the moles of CO and H2 vary with time as the water gas shift
proceeds in the gas phase. At 1100 K, over 113 moles of steam would be required to convert 99.5% of the CO. . . . 58
6.1 Sketch of catalyst pores with a palladium backing where P and P2 are H2 partial
List of Tables
1.1 Steam Methane Reforming Plant Data . . . . 14 1.2 Average Air Emissions [1]. C and D = construction and decommissioning; P and
T = production and transport; EG = electricity generation; PO = plant operation;
AO = avoided operations . . . . 16 1.3 Greenhouse Gases Emissions and Global Warming Potential [1] . . . . 16
1.4 Cost of hydrogen produced from the 115 kg/day hydrogen fueling appliances options [9]. . . . . 20
3.1 Steam requirements for theoretical conversion in the shift reaction (Sherwood, 1961). 30
Chapter 1
Introduction
1.1
Hydrogen Production Today
1.1.1
Consumption Around the World
Increasingly more research opportunities to improve the process of hydrogen production arise as nations around the world continue preparation for the transition to a fuel infrastructure in which the production, transport and consumption of hydrogen are a focal point. In 1996, three trillion cubic feet of hydrogen were consumed in the United States, where hydrogen is used in a number of different commercial applications. Today's largest consumers are ammonia production facilities (40.3%), oil refineries (37.3%), and producers of methanol (10.0%) [1]. International consumption of hydrogen follows a similar trend, with ammonia production accounting for 62.4% of the world's hydrogen, and oil refining and methanol production consuming 24.3% and 8.7% respectively [1]. Because such large amounts of hydrogen are required in these stationary applications, the hydrogen is typically produced by the hydrogen-consuming plant, and the most common means of production is currently the steam reforming of natural gas. As a result of the fast-growing fuel cell industry, hydrogen usage is expected to eventually become prevalent on the level of the individual consumer, in laptops, vehicles, cell phones and various home appliances. Even for the portable applications, it is expected that the steam reforming of natural gas will be among the primary methods of producing hydrogen
and hydrogen-rich "transition" fuels1. The process is an old and well-established technology but continues undergoing development as the challenges of new applications are met.
1.1.2 Assessment of a Steam-Methane Reforming Plant
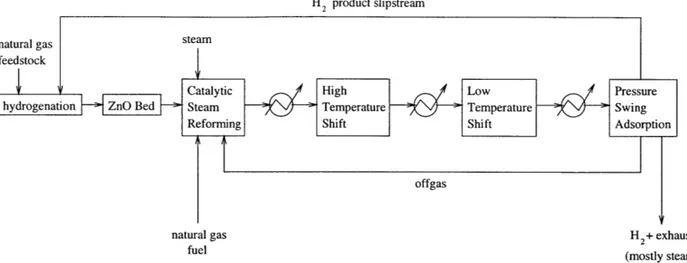
Spath and Mann conducted a life-cycle assessment of a steam methane reforming hydrogen plant whose block diagram is shown in Figure 1.1. Natural gas feedstock is hydrogenated before being desulfurized on a zinc-oxide bed so that the catalysts in subsequent reactors are not fouled. In the first reactor, the catalytic steam reformer, the natural gas is cracked by steam and decomposes into hydrogen and carbon monoxide. Two shift reactors follow the catalytic steam reformer to convert the carbon monoxide present in the stream to more hydrogen and carbon dioxide, which will ultimately be sequestered. As will be discussed in later chapters, two shift reactors are used in this traditional design so as to convert as much of the carbon monoxide as possible. The pressure swing adsorption system runs at near vacuum pressures and separates the hydrogen from the other gases in the stream.
The assessment by Spath and Mann highlighted several opportunities for improvement in this process of producing hydrogen, from the operations well upstream of the plant to the final pu-rification steps leading to the industrial-grade hydrogen at the exit stream. Data describing the hydrogen plant in the assessment are shown in Table 1.1 (Spath and Mann 2001).
It should be noted that the plant efficiency in this assessment is defined as follows [1]:
energy in product hydrogen
+
4.8 MPa steam energy (required) rplant =natural gas energy + electricity + 2.6 MPa steam energy (required)This definition assumes that all required steam for the operation of the plant is produced internally, and that all generated steam is used by another operation. If the 4.8 MPa steam were considered a waste product, the plant efficiency would drop from 89.1% to to 69.1%.
'The hope for the distant future is to generate energy using renewable resources, such as hydroelectric, solar and wind. Any non-renewable fuel, such as natural gas, might therefore be termed "transitional." To this end, hydrogen might also be considered a transitional fuel if it is produced via the reforming of a (non-renewable) hydrocarbon
H product slipstream
natural gas steam
feedstock
Catalytic High Low Pressure
hydrogenation ZnO Bed Steam Temperature Temperature Swing
Reforming Shift Shift Adsorption
offgas
natural gas fuel
H2+ exhaust
(mostly steam) Figure 1.1: Block diagram of the hydrogen plant (Spath and Mann, 2002).
Table 1.1: Steam Methane Reforming Plant Data
Design Parameter Data
Plant Size (hydrogen production capacity) 1.5 million Nm3/day
Hydrogen purity Industrial grade (>99.95 mol% H2)
Average operating capacity factor 90%
Natural gas consumed at 100% operating 392 Mg/day (feed)
capacity
Steam requirement (2.6 MPa or 280 psi) at 100% 1293 Mg/day
operating capacity
Steam production (4.8 MPa or 700 psi) at 100% 1858 Mg/day
operating capacity
Electricity requirement at 100% operating 153311 MJ/day
capacity
Hydrogen plant energy efficiency (higher heating 89%
Economy of Steam
Management of steam is a huge area of interest for researchers aiming to improve the performance of the plant. Spath and Mann reported the following notable characteristics regarding steam consumption.
Per kilogram of hydrogen produced, 19.8 liters of water are consumed. 95% of this total is consumed during operation of the hydrogen plant: 24% of the total is consumed during the steam cracking of methane and water-gas shift reactions (to be discussed in detail in subsequent chapters), and over 71% of the total is consumed during the production of the 4.8 MPa steam. The economy of steam within a hydrogen plant must be managed very carefully and the internal components which require excess steam are undergoing continual design improvements. As will be discussed at length, the current work suggests that the high temperature shift reactor, low temperature shift reactor and pressure swing adsorption system can be replaced by a single membrane reactor that can operate at high pressure and require significantly less excess steam.
Greenhouse Gas Emissions
Other opportunities to improve hydrogen production via steam methane reforming abound. Man-aging the emission of greenhouse gases is another area of research receiving focused attention. One of the great selling points for fuel cells today is that they are environmentally friendly because they run on hydrogen, a clean, carbon-free fuel. While this is true, the production of hydrogen via steam methane reforming can be as environmentally unfriendly as the combustion of a hydrocarbon. Ta-ble 1.2 is a summary of the average air emissions involved in this process, from the extraction of natural gas from the earth to the production of purified hydrogen [1]. Carbon dioxide is the most important greenhouse gas and is emitted from the system in greatest abundance, but methane and nitrous oxide also contribute to global warming. In fact, the potential of CH4 and N20 to
contribute to the warming of the atmosphere is 21 and 310 times higher than CO2 respectively over
a period of 100 years according to the Intergovernmental Panel on Climate Change (IPCC) [2]. Thus, Spath and Mann normalized the global warming potential of the greenhouse gases emitted
by the system and associated processes to a C0 2-equivalence (Table 1.3).
Table 1.2: Average Air Emissions [1]. C and = production and transport; EG = electricity operations
D = construction and decommissioning; P and T generation; PO = plant operation; AO = avoided
Greenhouse Amount Global g C02- Percent
gas emitted (g/kg warming equivalent/kg contribution to
H2) potential H2 system global
relative to warming C02 potential C02 10621 1 10621 89.3 CH4 60 21 1256 10.6 N20 0.04 310 11 0.1 11888
Table 1.3: Greenhouse Gases Emissions and Global Warming Potential [1]
Air Emission System % of % from C % from P % from % from % from
Total total and D and T EG PO AO
(g/kg H2) Benzene 1.4 0.0 0.0 110.9 0.0 0.0 -10.9 (C6
H
6) Carbon 10620.6 99.0 0.4 14.8 2.5 83.7 -1.5 Dioxide (C02) Carbon 5.7 0.1 2.0 106.3 0.7 1.4 -10.4 Monoxide (CO) Methane 59.8 0.6 0.0 110.8 0.0 0.0 -10.9 (CH4) Nitrogen 12.3 0.1 1.8 90.3 9.5 7.3 -8.9 oxides (NOX as NO 2) Nitrous oxide 0.04 0.0 7.3 37.6 58.7 0.0 -3.7 (N 20) Non-methane 16.8 0.2 1.7 89.8 14.5 0.0 -6.0 hydrocarbons Particulates 2.0 0.0 64.5 25.2 11.6 1.1 -2.5 Sulfur oxides 9.5 0.1 13.5 68.3 24.9 0.0 -6.7 (SO, as SO2)2972g C0 2-equivalent is emitted during the process of natural gas production and distribution, 273g C0 2-equivalent is emitted during electricity generation, 41g C02-equivalent is emitted during
construction and decommissioning2, 293g C0 2-equivalent are subtracted from the total emissions
as a result of the avoided operations3, and 8895g C0 2-equivalent are emitted during operation of
the hydrogen plant [1].
In their life-cycle assessment, Spath and Mann also note the consumption of natural resources involved, the most notable being the 3642 grams of natural gas consumed per kilogram of H2
produced. They also note the production of solid waste, which averages approximately 201 grams per kilogram of H2. Continued research and development efforts in the area of hydrogen production
via steam-methane reforming and fuel cells aim to lower these numbers.
1.2
Some Research Efforts in Hydrogen Production and Reformer
Technology
The list of research in the areas of fuel cells, hydrogen production and reformer technology is virtually limitless. The works mentioned here are a few of the very many.
1.2.1 Additional Hydrogen Sources
One research effort in the area of hydrogen production aims to broaden our search for hydrogen sources. Significantly more hydrogen will have to be produced in order for hydrogen to become a significant part of the present day fuel infrastructure in the United States and around the world. According to the U.S. DOE 1994 fuel use numbers, the rate of household and transportation fuel use is at a hydrogen equivalent of 0.25 billion kg/day, which is 5.5 times the current rate of hydrogen production in this country. In order to meet the nation's fuel usage demands, hydrogen will have to
be recovered from all possible gas streams, including those with low partial pressures of hydrogen. In a recent submission to the DOE, Heung describes how to recover hydrogen from such gas streams
by using composite materials comprised of metal hydride particles encapsulated in a porous silica 2
Construction and decommissioning includes plant construction and decommissioning as well as the construction of the natural gas pipeline.
3
matrix [31.
1.2.2
On-board Hydrogen Production
There is a body of literature available regarding the on-board production of hydrogen that meets the transient response demands of gasoline-fueled fuel cell vehicles. On-board hydrogen production systems typically consist of a reformer, a high-temperature shift, a low-temperature shift and preferential oxidation. Such systems are bulky and expensive, two main reasons why they are not yet marketable. Brooks, et al. have addressed the problem of size with a clever microchannel fuel processor design that is capable of reaching full power from start-up in fifteen minutes at 20'C [14]. The goal of the work is to have the system reach full power in less than one minute, and the research team from Pacific Northwest National Laboratory expects to meet this goal by redesigning the reactors using low pressure drop concepts. Betta and Thompson are also developing fast-starting fuel processors that will produce hydrogen suitable for PEM fuel cells, which might become more popular in a vehicular application [15, 16].
Also in the area of hydrogen production is the work by Muradov [8]. The goal of his work is to improve production efficiency, reduce overall production cost, and also obviate the concurrent production of carbon oxides and other undesirables such as greenhouse emissions. The approach involves thermocatalytic decomposition of hydrocarbon feedstocks (such as methane) over carbon-based catalysts in an air/water-free environment. This work points us in the direction of making the production of hydrogen as environmentally friendly as fuel cell operation.
1.2.3
Membrane Development
The development of membrane reactors is a focal point in the effort to improve hydrogen production; membrane reactor development is, in turn, heavily tied to the development of suitable membranes and catalysts. To this end, the development of membranes that successfully select a molecule as large as carbon-dioxide is currently in accelerated stages. Sandia National Laboratories has successfully synthesized defect-free thin film zeolite membrane with different selectivities for various gas molecules [4]. The pore sizes and shapes are defined crytallographically with less than 1
A
deviation to allow for size exclusion of very similarly sized molecules including CO2. Another such advancement in membrane technology is the work by Ho [5]. The objective of his work is to producea C0 2-selective membrane by incorporating amines in polyvinylalcohol networks. The amines will
facilitate the transport of the carbon-dioxide, and the polymer network will reject the hydrogen.
A C0 2-selective hydrotalcite (ceramic) membrane is being developed by a UCLA project team
in conjunction with Media and Process Technology, Inc. These works will offer notable options in the design of membrane reactors and promise to help greatly with the final purification stages of hydrogen production. C0 2-selective membrane options are of particular import to the current
work, which is based upon the ability to selectively remove both hydrogen and carbon-dioxide.
1.2.4 Cost as Motivation
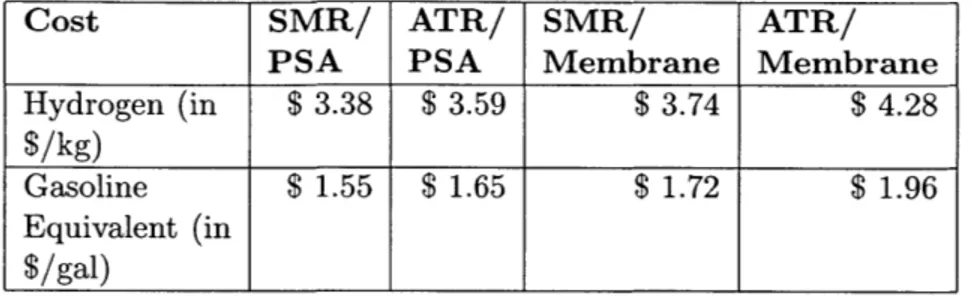
The issue of cost is a large motivating factor in the accelerated development of membrane reac-tor technology and research. Over several studies, Directed Technologies, Inc. has analyzed the costs of representative hydrogen fueling appliances to supply the early-introduction hydrogen pow-ered fuel cell vehicles and the cost of the hydrogen produced by these hydrogen fueling appliances
[9]. The goal of the work was to determine the most practical and economically feasible plan for
the supply of 10 Quads/year of renewable hydrogen for transportation applications in 2030-2050. Some of the key results of this work, summarized in Table 1.4, identified a steam methane reformer system with a pressure swing adsorption device as the most cost efficient means of producing hy-drogen. Purchasing hydrogen produced by this method would be equivalent to paying $1.55/gallon for gasoline, which is comparable to the current retail market price in the United States today. Alternatives considered in this work were autothermal reforming with a pressure swing adsorption device, steam methane reforming in a membrane reactor and autothermal reforming in a membrane reactor. The most costly means of producing hydrogen would be autothermal reforming with a membrane reactor. Buying hydrogen produced this way would be equivalent to paying $1.96 per gallon of gasoline.
Hydrogen production systems that include pressure swing adsorption are a mature technology whose potential for design improvement is limited. Also very importantly, pressure swing adsorption systems are part of a hydrogen purification process that requires multiple large heat exchangers and pumps. The amount of hardware required to purify the hydrogen stream could be substantially lessened by the use of membrane reactors and no pressure swing adsorption. Membrane reactors
to replace the traditional reactor designs. The benefits of membrane reactors will be discussed in detail in the next chapter.
Table 1.4: Cost of hydrogen produced from the 115 kg/day hydrogen fueling appliances options
[91.
Cost SMR/ ATR/ SMR/ ATR/
PSA PSA Membrane Membrane
Hydrogen (in $ 3.38 $ 3.59 $ 3.74 $ 4.28
$/kg)
Gasoline $ 1.55 $ 1.65 $1.72 $ 1.96
Equivalent (in $/gal)
Chapter 2
Membrane Reactors
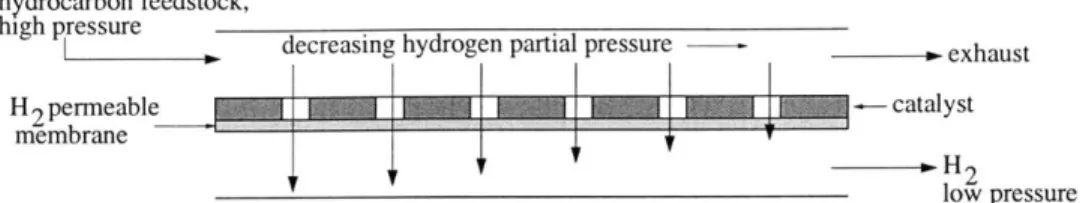
Membrane reactors are more efficient than traditional reactors because they combine in one unit a reactor that creates products and a permselective membrane, which is a membrane that selectively removes one or more of these products. The result is a more compact design capable of achieving significantly higher conversion of equilibrium-limited reactions. Extraction of one of the products drives the forward reaction toward completion because the equilibrium limit is not reached until the gas stream exits the reactor. See Figure 2.1, a schematic of a membrane reactor for hydrocarbon reforming that removes the product H2 from the main gas stream. As will be discussed below,
membrane reactors also allow for longer residence times of the reactants, thus decreasing the amount of catalyst required to achieve a given extent of reaction'. Buxbaum points out an even greater advantage of the membrane reactor: it allows a wider range of temperatures and pressures at which the forward reaction can proceed [11].
Membrane reactors are open systems in which the number of moles of gas in the reactor is not purely a function of the number of moles entering the reactor, as is the case in a traditional plug-flow reactor. Membrane reactors fundamentally change the pressure dependence of the conversion rate of the forward reaction. A reaction that is more efficient at low pressure in a traditional reactor preferentially takes place at high pressures in a membrane reactor. This final advantage greatly sim-plifies an otherwise enormously complex fluids/thermochemistry/kinetics problem, which typically requires a large reactor and substantial heat transfer area.
hydrocarbon feedstock,
high pressure decreasing hydrogen partial pressure
exhaust
H2permeable I t
membrane
SH2
low pressure
Figure 2.1: Schematic of a reforming membrane reactor. A porous catalyst is backed by a hydrogen-permeable membrane. As the reaction proceeds forward, hydrogen is selectively removed and exits in a separate stream at low pressure.
2.1
Advantages of Membrane Reactors
The stated advantages of membrane reactors, which are the same for all membrane reactor appli-cations, will be illustrated in the following example of the steam reforming of methane.
2.1.1 Steam-Methane Reforming
The overall reaction for the steam reforming of methane is as follows:
CH4 + 2H20 -4 4H2 +CO 2. (2.1)
This reaction can be modeled as occurring in two stages [12]. The first involves the endothermic, irreversible cracking of methane:
CH4 + H20 - 3H2 + CO AH*O = 164.6kJ/molCH4 (2.2)
followed by the water-gas shift:
CO + H20 <
CO2
+ H2 AH, = -41.2kJ/molCO (2.3)which is exothermic and equilibrium-limited. It is preferred that reaction (2.2) be performed at high temperature and pressure because reaction rates are higher and catalyst use is improved under these conditions [12]. This reaction is highly endothermic, which means that the entrance temperature must be high and heat must be provided along the length of this portion of the reactor. By contrast, reaction (2.3) is exothermic and the extent of the reaction is greatest when it
occurs at low temperature and low pressure. Therefore, heat must be removed either between this stage and the last or along this portion of the reactor. Because low pressures are needed to drive the shift reaction, both reactions are typically performed at low pressures (below 100 psi). The result is a much larger reactor than would be required if high pressure cracking were performed. The large size increases equipment costs and exacerbates the complicated heat transfer process. Moreover, the CO content in the stream after the water-gas shift is still too high: 1-2%. Polymer electrolyte membrane (PEM) fuel cells and other low temperature fuel cells are poisoned by these high concentrations of CO, making some post-shift "clean-up" necessary. PEM fuel cells require
CO levels between 10 and 20 parts per million, and would operate more efficiently with even lower CO content levels. Amphlett et al. have shown that the power density of this fuel cell would
be three times greater, that is, PEM cells would be one-third their size, if the hydrogen source were perfectly pure. Partial combustion after the shift can be used to reduce CO content levels sufficiently, but the catalyst required for the process consumes hydrogen. In addition to producing purer output hydrogen, membrane reactors can obviate the low pressure purification process by fundamentally improving the dependence of the extent of the reaction on pressure. This will be demonstrated in the following example.
In a thought experiment, we write an equilibrium constant for the overall reaction (2.1), ex-pressed first in terms of the partial pressures of the various species and then in terms of their mole fractions and the total pressure of the gas mixture:
Pk42Pco2 2 4_HC_
Kc K0 = 22 2 -LkOPH Tot YH2 2YC2 (2.4) LH20PCH4 YH2OYCH4
where KC is the concentration-based equilibrium constant, P is the partial pressure of species i, PTot is the total pressure, and y is the mole fraction of component i. yi = PI/POt. If reaction (2.1) were to go to completion in a traditional (non-membrane) reactor, then one mole of methane and two moles of water would yield four moles of hydrogen and one mole of carbon dioxide. For a reaction that is not driven to completion, we define the extent of the reaction 3 to be the number of moles of carbon dioxide produced. The number of moles of hydrogen is then 4,3, the moles remaining of methane and water are then 1 - / and 2 - 2/ respectively, and the total number of
we obtain
K
P(40)4 1p2
(l-/3)(2-2 3)
2 (3+23) 2 (2.5)Clearly lower pressures yield higher conversions in this case.
This relationship between extent of reaction 3 and total pressure in a traditional non-membrane reactor is illustrated in Figure 2.2.
Non-membrane Reactor -6 -4 -2 0 10-6 10 10-2 10 Total Pressure (N/rr?) 102 104 10 Figure 2.2: Illustration membrane reactor.
of the relationship between extent of reaction and total pressure in a
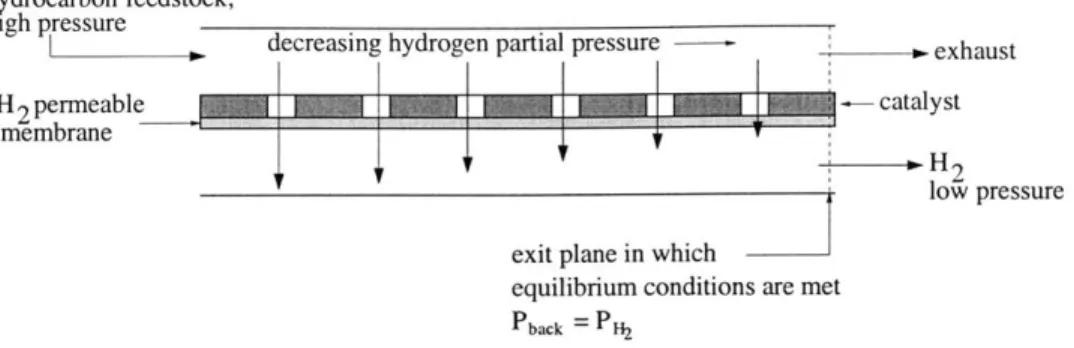
non-In a membrane reactor in which hydrogen is selectively removed, such as the one sketched in Figure 2.3, equilibrium conditions are met only in the plane at the exit of the reactor. Prior to the exit plane, the reaction is presumably still proceeding forward. "Pot" is then the total pressure of the gases in the core of the reactor in this exit plane only.
The partial pressure of hydrogen can be modeled as a function not only of the extent of reaction, but also of the back-pressure at the hydrogen outlet. (In an arbitrary mobile application, Pback
c Z U 0.9- 0.8- 0.7- 0.6- 0.5- 0.4- 0.3- 0.2-0.1 -0 1-10-s 1
hydrocarbon feedstock,
high pressure
decreasing hydrogen partial pressure - exhaust
rmeabble catalyst
membranef
IF H2
low pressure exit plane in which
equilibrium conditions are met
back = H2
Figure 2.3: Illustration of where equilibrium conditions are expected in a membrane reactor.
could be approximately 1 atm.) According to the work by Lund, transport resistance through the membrane is non-negligible, but it is minimal, and so for the purposes of this example, PH2 =
Pback = const [7]. The number of moles of H2, CO2, CH4, and H20 present in the exit plane are as follows: Pback nH2 Pback -
2)3)
Ptot - Pback nC02 =0
ncH4 =1 - 0 nH2o =2
- 20and the total number of moles in the core of the reactor in the exit plane is
ntotal = - (3 - 2)3).
Ptot - Pback
We now rewrite the right-most expression of equation (2.4) as
Kc= n2 back YCO22 (2.6)
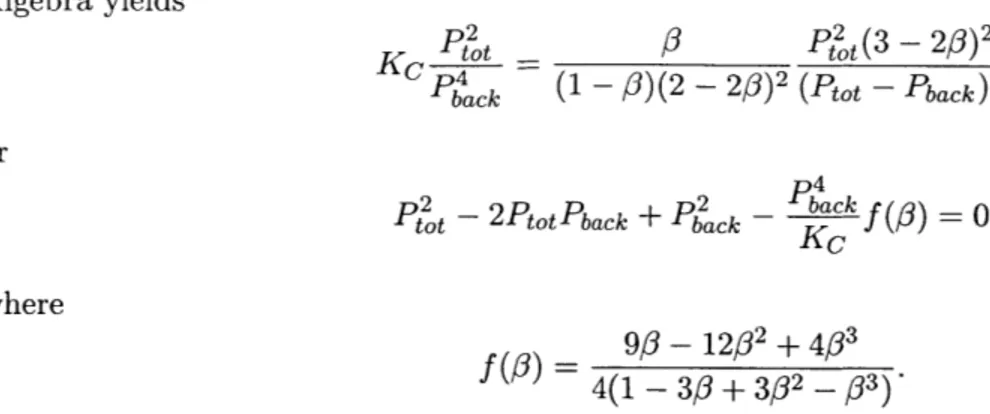
Algebra yields
or
K Pot 4
3
Pt2
ot(3 - 2#) 2
Pback (1 -0 /)(2- 20)2 (Ptot - Pback )2
t - 2PtotPback + Pback - back
f
= 0(#) K0where
f
9
3
- 12/32+ 4/3 4(1 - 33 + 302 _ 03)This quadratic in Pot is solved for variable Pback and a family of curves illustrating the relationship between the total pressure and extent of reaction are plotted in Figure 2.4. In this figure it can be seen that, very unlike the non-membrane reactor case, increasing the total pressure of the gas mixture increases the extent of reaction. Furthermore, the extent of reaction in a membrane reactor can be further increased by decreasing the back pressure at the hydrogen exit.
Membrane Reactor C: C: a) 0.9- 0.8- 0.7- 0.6- 0.5- 0.4- 0.3- 0.2-0.1 -10 1 102 103 10T 10 5 106 Total Pressure (N/rr2)
Figure 2.4: Dependence on pressure of the extent of reaction in a membrane reactor. The fact that higher pressures yield greater conversions allows significant design improvements
ecreasing Pback
0
'
I
. -. . .. . . , I . . . I - . . I . I1
dE
and is a fundamental advantage of membrane reactors. Additionally, since volumetric flow rate for gases decreases inversely with total pressure at a given molar flow rate, PV = rnRT, the higher pressures in a membrane reactor decrease the volumetric flow rate for a given mass flow rate of gas. More importantly, the higher pressures and subsequent smaller volume flow rates increase the residence time of the reactants for a given size of reactor. This means that less catalyst and thus a smaller reactor could be used for a given mass flow rate of gas. In order to benefit from these fundamental advantages of membrane reactors, a good catalyst for a given operating temperature range must be identified and a membrane strong enough to withstand the pressure differential Pit~ - Pback must be found.
Chapter 3
The Current Work
It was noted in the example of the previous chapter that, in regard to energy related issues, the water-gas shift is part of the process of reforming hydrocarbons to produce hydrogen suitable for fuel cells. Carbon monoxide poisons the low temperature fuel cells and must therefore be removed. The water-gas shift, a reaction in which CO is consumed and H2 is produced, is thus a focal point
in the development of improved fuel reforming processes. The reaction is also a focal point in the development of membrane reactors because improving reactors for the shift can result in an even greater improvement in the economy of steam and thus overall system efficiency in fuel reforming plants.
3.1
The Water-Gas Shift
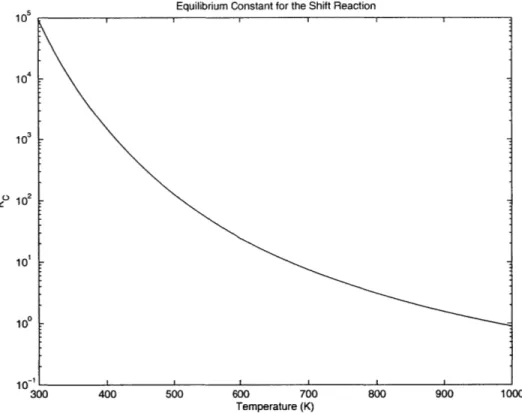
The reaction is limited by thermodynamic equilibrium at the higher temperatures while kinetics are unfavorable at the lower temperatures. Below is an expression for the equilibrium constant for this reversible and exothermic reaction; Figure 3.1 illustrates how strongly Kc varies with temperature.
CO
+
H20 -CO
2+
H2 AHO = -41.2kJ/mol CO (3.1)103943 (3.2)
exp 41147.4 (1
)
whr R i 298
Equilibrium Constant for the Shift Reaction
-
-300 400 500 600 700
Temperature (K)
800 900 1000
Figure 3.1: Dependence of the equilibrium constant for the water-gas shift reaction on temperature. 10 10 1021 10 1 100 10-I
Catalysis is extremely important in the case of such exothermic, equilibrium-limited reactions. Higher temperatures are required to make the reaction occur, but an appropriate catalyst for a given reaction can improve kinetics even at the lower temperatures. In the case of the water-gas shift, the effects of equilibrium limitations are greatest at the higher temperatures and excess steam is often used to improve CO conversions at these higher temperatures. Table 3.1 summarizes how much excess steam would be required for a theoretical 100% conversion of CO at various temperatures.
Operating Temperature, Steam Requirement in
K Single-Stage Reactor,
ft3/ft3 CO
623 6.98
728 22.3
828 50.3
Table 3.1: Steam requirements for theoretical conversion in the shift reaction (Sherwood, 1961).
3.2
Current Means of Catalyzing the Shift
In Figure 1.1, two separate adiabatic beds are used to catalyze the water-gas shift as part of the purification stages of H2 production via steam methane reforming. The two separate catalytic
reactors address the trade-off between fast kinetics and high equilibrium conversions of CO. The first bed is a high temperature bed in which kinetics are fast, but overall equilibrium conversions are lower than they need to be. The catalyst in this first bed is an industry standard made of Fe304 with a Cr2O3 promoter. The operating range of the ferro-chrome catalyst is between 600K
and 750K. At 750K, where kinetics are most favorable, over 22m3 of steam per m3 of CO would be theoretically required to overcome the equilibrium limitation. Instead of adding this much excess steam to the feed stream, a second, lower temperature bed is employed to achieve sufficiently high overall conversions. A copper based catalyst is used in this second bed. Any CO remaining in the stream after this second stage of the water-gas shift must be separated out, which is often done with a pressure swing adsorption system at low pressure. The fact that the pressure swing adsorption system requires low pressures is inherently problematic for a steam reforming plant like the one shown in Figure 1.1. As discussed in Chapter 2, the cracking of methane is most efficient
at high pressures. The traditional water-gas shift reactors are most efficient at lower pressures, and the pressure swing adsorption system requires near vacuum pressures. Maintaining these extreme pressure differentials would require extensive adjunct machinery; instead, the whole system is often run near isobarically, at low pressure, at a sacrifice to the plant efficiency. A great improvement would be to catalyze the shift at high temperatures and pressures, and to separate the H2 out of
the stream concurrently, obviating the pressure swing adsorption system.
3.3
Future Plans for Catalyzing the Shift
Membrane reactors are currently being tried for their potential benefits in a water-gas shift reactor application. They would eliminate the thermodynamics/kinetics trade-off by separating either the hydrogen or the carbon dioxide while the forward reaction is in progress. Today, the development of membrane reactors for the shift is deeply tied to the development of suitable catalysts. The thermodynamic and chemical environment in a membrane reactor is vastly different from the envi-ronment in a traditional reactor. The pressures are higher and the feed is closer to stoichiometric as significantly less excess steam is required. The amount of excess steam required is now a func-tion of the maximum adiabatic temperature that the catalyst can withstand; a higher temperature catalyst is thus preferred not only because the kinetics are faster at higher temperatures but also because it allows for the minimal use of excess steam. Traditional shift catalysts are not well stud-ied under the conditions of high temperature, high pressure and minimal excess steam. In 1969, Bohlbro presented an extensive study of the shift reaction over ferro-chrome (Bohlbro, 1969). Very briefly, he experimentally found a rate expression for the reaction under a multitude of controlled conditions. He illustrated how an excess of carbon dioxide inhibits the forward reaction. In order for ferro-chrome to be used as the catalyst in a membrane shift reactor, it seems that it would be preferable to remove the inhibitor, CO2. However, it was recently noted that selectively
remov-ing the C0 2, leaving the catalyst exposed to high concentrations of hydrogen, causes reduced and
thus inactive forms of iron to appear in the catalyst effluent [7]. The ferro-chrome catalyst is thus dysfunctional in an environment of excess hydrogen or excess carbon dioxide. For these reasons, it is suspected that catalysts other than the industry standard catalysts for the traditional shift reactors are more suitable for the membrane application, and the development of such catalysts
is both deep and widespread. A cobalt-molybdenum catalyst, though not yet well-studied, shows promise.
3.4
The Proposed Work
The current work does not participate in this race for the best new shift catalyst possible for a mem-brane reactor, but, rather, creatively takes advantage of what is already known about ferro-chrome and the specific reasons why it is being disregarded for the membrane application. In a standard, non-membrane reactor, the concentrations of hydrogen and carbon dioxide are approximately the same and increasing as the reaction proceeds forward. This information suggests that ferro-chrome could be well suited for a membrane reactor that maintains concentrations of H2 and CO2 within
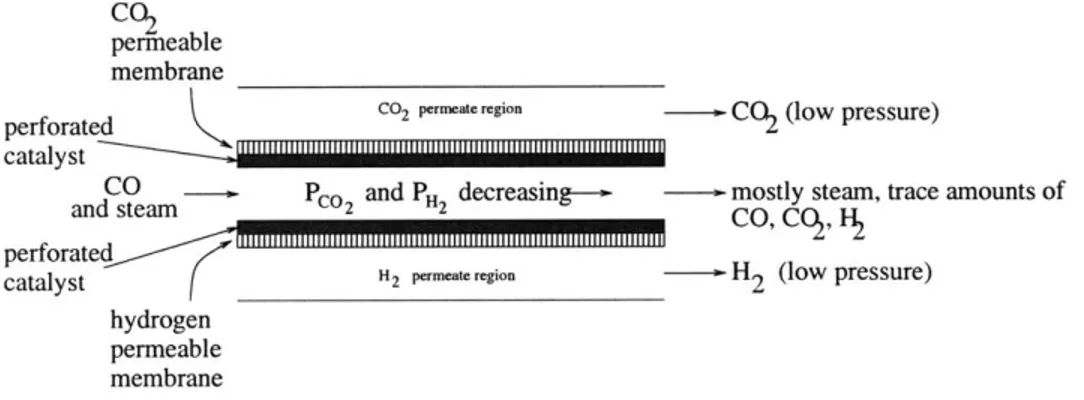
a tolerable range for the catalyst at every cross section in the reactor; that is, perhaps it is the ratio of the two concentrations that must be well modulated in order for ferro-chrome to be fully functional. Modulating this ratio in a membrane reactor application for the shift requires that both hydrogen and carbon dioxide be removed, concurrently, from the core of the reactor. This is, essentially, the objective of the current work. Figure 3.2 is a schematic of the proposed reactor.
There are currently no membrane shift reactors on the market like this one. C02
permeable membrane
perforated C02 permat region CO2 (low pressure)
catalyst
CO pco and PH decreasing-- mostly steam, trace amounts of
and steam 2 2 CO'C H2
perforate H2 permeteregion -- H
2 (low pressure)
hydrogen permeable membrane
Figure 3.2: Schematic of the proposed membrane reactor for the water-gas shift. Carbon monoxide and steam enter the reactor at high pressure, react on the surface of a porous catalyst that is backed on one side by a H2-selective membrane, and on the other side by a C0 2-selective membrane. These
two products of the reaction exit the reactor in two separate, low-pressure streams; the exhaust consists primarily of steam with trace amounts of unreacted CO and trace amounts of the products.
3.4.1 Membranes
The membranes are a backing to the porous catalyst structure and separate the core of the reactor from the H2 and CO2 permeate regions of the reactor. Pressures in the core of the reactor are high
whereas pressures in the permeate regions of the reactor are maintained low. While the reaction proceeds forward, these membranes selectively remove hydrogen on one side (the bottom side, as shown in the figure) and carbon dioxide on the other side. This design is, in a basic sense, two membrane reactors like the one shown in Figure 2.1 combined into one structure. The two product gases are driven out of the core of the reactor by the pressure differential across the membranes. The hydrogen-selective membrane will be a palladium derivative, an industry standard. The CO2
-selective membrane will be one of the following three available:
1. a thin film zeolite membrane that chemically selects CO2, developed at Sandia National
Laboratories [4].
2. a polyvinyl alcohol network with amines that actively transport CO2 across the membrane [5].
3. a ceramic membrane that has demonstrated notable resistance to fouling developed at UCLA
in conjunction with Media and Process Technology, Inc. [6].
Both membranes must be thin enough to minimize resistance to mass transport, but strong enough to withstand large pressure differentials. If lack of strength becomes an issue, the membranes will have to be appropriately reinforced (on the permeate side).
Another concern regarding the membranes is the effect of CO. CO is known to block the transport of H2 through palladium-based membranes, and CO could potentially migrate through
the C0 2-selective membranes. For these reasons, care must be taken to minimize the amount
of CO that reaches the membrane. This will be achieved by making the porous catalyst layer appropriately thick, and with moderate amounts of excess steam to encourage the consumption of CO. If the forward reaction is favorable enough, and if the residence time of CO is short, it is expected that the amount of CO to reach the membrane will be minimal. In a paper by Karnik et. al, H2 was successfully removed using a palladium-based membrane while the water gas shift
this work.
The current work is in the early stages of modeling the thermochemistry and kinetics of the proposed duo-selecting membrane reactor. The next chapter describes these models in detail.
Chapter 4
The Thermodynamic Model
4.1
First and Second Laws of Thermodynamics
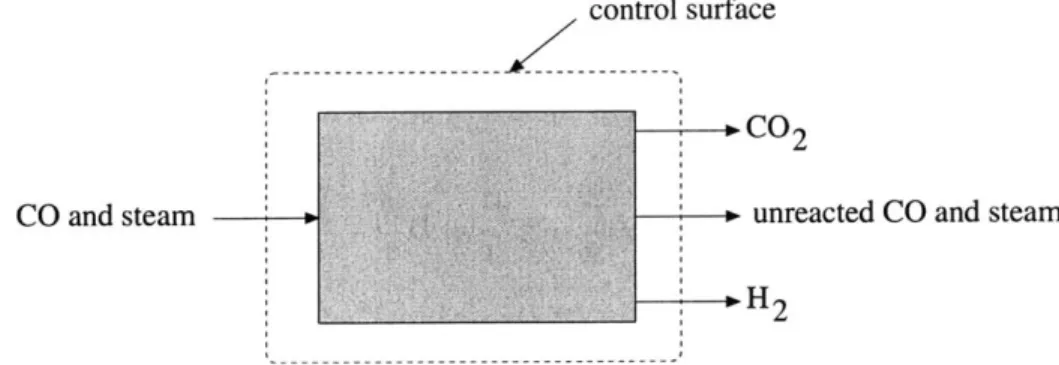
Below is a sketch of the reactor viewed, from a thermodynamic sense, as a "black box" into which carbon monoxide and steam go in, and three steams come out: unreacted CO and steam, hydrogen, and carbon dioxide.
control surface
O CO2
CO and steam P, unreacted CO and steam
H
Figure 4.1: Set-up for the thermodynamic model.
The first and second laws of thermodynamics for the steady-state control volume shown are as
follows:
Q -
W = Hout - Hin Sgen = Sout - Sin -Q
>0
Tgas
(4.1) (4.2)
W = 0, and the incomplete reaction with appropriate stoichiometric coefficients is
CO + 7H20 <-+ 13C02 + 13H 2 + (r- /3)H20 + (1- /3)CO (4.3)
77 is the steam to gas ratio; that is, 77 is the number of moles of steam that are added per mole of CO.
/
is the extent of reaction, defined as the number of moles of CO2 produced. The number ofmoles of H2 and CO2 are assumed to be equal in this model; that is, the extent of reaction is also
the number of moles of hydrogen produced.
The first and second laws are now rewritten as the following:
Q
= [3hH2 + hCO2 + (77 - /)hH20 + (1 - 13)hCo] exit - [7hH2o + hcoi, (4.4)Q
Sgen = [/3sH2 + ISCO2 + (77 - /3)sH20 + (1 - )SCO] exit - [77SH2o + SCOin
Q
> 0 (4.5)Tgas
The enthalpies and entropies for the various species are approximated using the coefficients for the Shomate Equation provided in the National Institute for Science and Technology's online Chemistry Webbookl. For t = T(K)/1000, the Shomate equations are as follows:
t2 tP t4 E
ho - hos= At+B-+C-+D-+- + F - H (4.6)
2 3 4 t
0 Ct2 t3 E
8 =Aln(t)+Bt+C-+D +G (4.7)
The coefficients for the Shomate equations are tabulated below.
The Shomate approximation for the entropy of a species gives the temperature dependent con-tribution to the entropy. The pressure dependent concon-tribution must be added as -R ln(Pi/Patm)
+
Slbar* The first of these two terms must be calculated from the mole fraction of the species, but the second term is a constant. The values of this constant for the four species of interest are tabulated in column "I" of the table.
A B C D E F G H I H2 33.07 -11.36 11.43 -2.77 -0.16 -9.98 172.71 0.00 130.68
C02 25.00 55.19 -33.69 7.95 -0.14 -403.61 228.24 -393.52 213.78 H20 30.09 6.83 6.79 -2.53 0.08 -250.88 223.40 -241.83 188.84
CO 25.57 6.10 4.05 -2.67 0.13 -118.01 227.37 -110.53 197.66
Table 4.1: Coefficients for the Shomate equations (NIST website).
In this thermodynamic model, the reactor is assumed to operate isobarically. The optimal operating pressure will have to be determined from a study of the kinetics of the reaction, but for now the pressure in the core of the reactor is assumed to be six atmospheres.
4.2
Isothermal Mode of Operation
These laws are used to predict the extent of reaction
#
in the two cases of isothermal and adiabatic operation. In the isothermal case, the upper bound of the extent of reaction is predicted from the equilibrium constant for a given temperature T(K) and steam:gas ratio, q:K
YH2YCO2 _ /32103943
(4.8)
YH- )(1 - ) exp
E
41 -4(
-where R is the universal gas constant, 8.314J/mol-K. Only temperatures between 660K and 750K are considered, since this is the operating range of the catalyst. Figure 4.2 shows the relationship between 71 and / for the isothermal case. This figure shows that, at P = 6 atm, a minimum amount
of steam is required to meet the equilibrium limitation of the reaction. For too little steam, the second law of thermodynamics is satisfied only for smaller values of the extent of reaction. Following the plot of 3 versus q for this isothermal case are plots illustrating the relationship between Sgen
and y, and AH and q. The Matlab scripts that generate the data for these plots are included in the appendix.
4.3
Adiabatic Mode of Operation
Performance Curve, Isothermal Reactor
0 2 4 6 8 10 12
steam to gas ratio 14 16 18 20
Figure 4.2: Illustration of the relationship between q and 3 for the equilibrium conversions are highest at the lower temperatures.
isothermal case. As expected, 1. 0. a 0 0. 0. 0. 0. 0. 1 - - - -- - - - --- - --- 9-T=600K 8 -- 7-T=750K 6- 5-41 1
50 40 -3 0 -U, 0 Figure 4.3: The se
Performance Curve, Isothermal Reactor
T=600K
T=750K
0 2 4 6 8 10 12 14 16 18 20
steam to gas ratio
cond law limit on the extent of reaction in the isothermal case when n is too low.
20-10
Performance Curve, Isothermal Reactor -20- -25-E C tS-30--.2 T=750K -40_ T=600K -45' 0 2 4 6 8 10 12 14 16 18 20 steam to gas ratio
Figure 4.4: The heat transfer out of the system necessary to maintain isothermal conditions.
1. AH = 0, and
2. Sgen > 0.
Another Matlab script, also included in Appendix A, was written to determine the extent of reaction iteratively in this adiabatic case. The highest possible value of /3 attainable for a given flame temperature is 3(T,,t), where Tet is the temperature of the mixture upon exiting the reactor. Therefore,
#adiabatic
; f3(Tout). The Matlab script, adiabatic.m, tries this maximum value first to check if the value satisfies the two conditions. If O(Tout) is too high, a slightly lower value is tried, and the process repeats until the#adiabatic
that satisfies the two conditions is obtained2.The relationship between rj and /adiabatic is added to the performance curves for the isothermal cases and shown in Figure 4.5. A fourth curve representing
#(Tout)
is also shown in this plot. The up and down nature of the adiabatic curve is, in large part, attributed to the fact that the constraint on the first law (AH = 0) is relaxed to allow for a reasonable computation time. The2
The results of the code were checked against the results of from Equil, a Chemkin program.
-15
script adiabatic.m requires |AH| < 1 J/mol. r_ 0 a) Q) 1.005 0.995 0.99 0.985 0.98 0.975 0.97 0.965 0.96
Performance Curve, Adiabatic Reactor
0(750K)
- adiabatic
6 8 10 12 14
steam to gas ratio
16 18 20
Figure 4.5: Comparison of the extents of reaction in the two isothermal cases (T = 600 K and T = 750 K), the adiabatic case, and the limiting adiabatic case when the extent of reaction is
determined from the equilibrium constant at the flame temperature.
Following Figure 4.5 is a plot comparing the amounts of entropy generated in the two isothermal cases and the adiabatic case. While T = 600 K yields the greatest extent of reaction for a given
value of q, this mode of operation also generates the most entropy. In this work, however, en-tropy generation does not weigh heavily in the recommendation for the choice of reactor operating conditions; the recommendation is based solely on hydrogen yield.
In Figures 4.5 and 4.6, steam to gas ratios less than 6 are not considered. This is because lower values of q result in a flame temperature above 750 K, which is the highest operating temperature of the catalyst. Figure 4.7 illustrates how the flame temperature varies with the steam to gas ratio.
10 12 14 16 18 20
steam to gas ratio
Figure 4.6: Comparison of entropy generation in the two isothermal cases (T = 600 K and T = 750
K) and the adiabatic case. 20 18 16 14 12 10 U) 6 4 2 0 6 8 - T600 K - adiabatic case T =750 K
8 1012 1 16 8 2
8 10 12 14 16 18 20
steam to gas ratio
Dependence of the flame temperature on q; for nj > 6min 6 760 740 720 CL E a~700 E CO -o 680 Ca 6601 0 6 Figure 4.7: I
Chapter 5
The Kinetic Model
5.1
Fundamentals of Equilibrium
The final equilibrium conversions, estimated in the thermodynamic modeling of the last section for adiabatic and isothermal operating conditions, does not lend insight into how much time is required in order for these conversions to be realized. The equilibrium constant, though used casually in previous examples, will be discussed in greater detail here. The equilibrium constant links thermodynamics to kinetics. The discussion begins with definitions of equilibrium.
The combined statement of the first and second laws of thermodynamics for a control mass undergoing an arbitrary quasi-static process is
TdSgen = TdS - dU - pdV > 0. (5.1)
The entropy generation must be positive, as stated originally in the second law, but at equilibrium, the entropy generation reaches a maximum. That is, when dSgen = 0, it could only be because Sgen is a maximal value, which occurs only at equilibrium. Should the system be constrained by internal energy and volume, dU = dV = 0, this statement reduces to dS > 0. That is, entropy can
only be maximized at constant (U, V) and is maximal at the equilibrium state. The definition of enthalpy can be used to change coordinates from (U, V) to (H, P): H = U + PV and
This statement repeats that the entropy generation is maximized at equilibrium, regardless of what external constraints might be placed on the system. If the system is constrained by enthalpy and pressure, then dS > 0 and the entropy is also maximized at equilibrium.
The definition of the Gibbs free energy, G = H - TS, yields a second change of coordinates.
TdSgen = -dG - VdP - SdT > 0. (5.3)
If the system is constrained to constant temperature and pressure, then dG < 0, which states that
the Gibbs free energy is minimized at the equilibrium state.
Equation 5.4 is Gibbs' Fundamental Equation of thermodynamics applied to a control mass.
TdS = dU + PdV (5.4)
Gibbs' Equation is the combined statement of the first and second laws of thermodynamics for a reversible process in which 6Q = TdS and Sgen = 0. In this equation, S is a function of the two
independent variables, U and V. S S(U, V). Differentiating this expression using the chain rule,
dS (S)= dU +
(s)dV.
(5.5)(OU y OV U
This expression, combined with Equation 5.4 yields the following: 1 =
S)
(5.6) T (OU andOS\
P=T y)
(5.7) (OVwhich are the fundamental definitions of temperature and pressure, respectively.
For a mixture of different chemical species, Gibbs' Fundamental relation is extended to reflect the contribution of the various species to the total entropy:
TdS = dU + PdV - E pidni. (5.8)
ni is the the number of moles of species i and pi is the chemical potential of species i. The entropy is now a function of the number of moles of each species in addition to the internal energy and volume: S = S(U, V, ni). Differentiating this expression using the chain rule, we obtain:
(OS
N
I
S N
_dS = ao)vdU + dV + dn-. (5.9)
(aU
VavU
N (a)Vniojan
The chemical potential can now be defined as
(
)-T
. (5.10)( s)U,V,gi
Gibbs' Fundamental Equation can be rewritten in energy terms as
dU = TdS - PdV + E pidni (5.11)
N
so that U = U(S, V, ni). Following a similar procedure as before, we obtain another definition of chemical potential:
Pi (- )(5.12)
Substituting the definitions of the enthalpy and Gibbs free energy into Gibbs' Equation yield two more definitions of chemical potential:
P, and (5.13)
(5ni )S,Pnjoi
P -
(
.(5.14) (Oni T,P,nj,4iA more practical definition of chemical potential can be obtained by noting that, in a mixture
of chemical species, a system property is the sum of each species' contribution. For example, S = EN ng. If we write dni = ride to linearize the change in a system property, then
dS = d dnisi =
![Table 1.3: Greenhouse Gases Emissions and Global Warming Potential [1]](https://thumb-eu.123doks.com/thumbv2/123doknet/13955148.452542/16.918.185.775.747.939/table-greenhouse-gases-emissions-global-warming-potential.webp)