HAL Id: tel-01630993
https://tel.archives-ouvertes.fr/tel-01630993
Submitted on 8 Nov 2017HAL is a multi-disciplinary open access
archive for the deposit and dissemination of sci-entific research documents, whether they are pub-lished or not. The documents may come from teaching and research institutions in France or abroad, or from public or private research centers.
L’archive ouverte pluridisciplinaire HAL, est destinée au dépôt et à la diffusion de documents scientifiques de niveau recherche, publiés ou non, émanant des établissements d’enseignement et de recherche français ou étrangers, des laboratoires publics ou privés.
Yanfeng Gao
To cite this version:
Yanfeng Gao. Inertial migration of particles in microchannel flows. Mechanics of the fluids [physics.class-ph]. INSA de Toulouse, 2017. English. �NNT : 2017ISAT0010�. �tel-01630993�
THÈSE
En vue de l'obtention du
DOCTORAT DE L’UNIVERSITÉ DE TOULOUSE
Délivré par
Institut National des Sciences Appliquées de Toulouse (INSA de Toulouse)
Discipline ou spécialité :
Dynamique des fluides
Présentée et soutenue par
GAO Yanfeng
Le mardi 9 mai 2017 Titre :
Inertial Migration of Particles in Microchannel Flows
JURY :
Jean-Philippe MATAS, Professeur, Université Claude Bernard Lyon 1, Rapporteur Farzam ZOUESHTIAGH, Professeur, Université de Lille 1, Rapporteur
Jean-Luc ACHARD, Directeur de recherche, Laboratoire des Ecoulements Géophysique et Industriels, Examinateur
Stéphane COLIN, Professeur, INSA de Toulouse, Examinateur
Lucien BALDAS, Maître de Conférences, INSA de Toulouse, Directeur de Thèse Pascale MAGAUD, Maître de Conférences, Université de Limoges, Directrice de Thèse
Ecole doctorale : Mécanique, Energétique, Génie civil et Procédés (MEGeP) Unité de recherche : Institut Clément Ader (ICA, CNRS UMR 5312)
Directeur(s) de Thèse :
Lucien BALDAS, Maître de Conférences, INSA de Toulouse, Directeur de Thèse Pascale MAGAUD, Maître de Conférences, Université de Limoges, Directrice de Thèse
I
Remerciements
Je tiens avant tout à exprimer mes remerciements à mes deux directeurs de thèse, Pascale Magaud et Lucien Baldas, pour la confiance, le temps et la patience qu’ils m’ont prodigués tout au long de ces quatre années. Je remercie en particulier Pascale Magaud pour son accueil, sa bienveillance et son encadrement scientifique (ses conseils pendant les expérimentations et son aide pour développer le programme), et Lucien Baldas pour ses encouragements dans tous les moments difficiles, ses conseils pendant la rédaction du manuscrit et son aide pour réussir ma 1ère publication.
J’exprime ensuite mes remerciements à M. Stéphane Colin, Professeur à l’INSA de Toulouse qui a accepté de présider mon jury de thèse. Je le remercie par ailleurs pour son enseignement enrichissant sur la microfluidique, son accueil et son encadrement au sein de l’équipe microfluidique et les discussions scientifiques que nous avons eues.
J’adresse ma reconnaissance à M. Jean-Philippe Matas, Professeur à l’Université Claude Bernard Lyon 1 et M. Farzam Zoueshtiagh, Professeur à Université de Lille 1 qui ont accepté d’être les rapporteurs et de lire minutieusement ma thèse. Je les remercie d’avoir mis leur expertise à ma disposition et d’avoir ainsi enrichi mon travail au travers des corrections, suggestions et échanges que nous avons eus.
Je remercie chaleureusement M. Jean-Luc Achard, Directeur de recherche à LEGI pour avoir accepté d’examiner ma thèse. Son éclairage complémentaire sur le sujet a été très instructif. Je le remercie également pour ses recommandations en vue d’un post-doc aux USA avec Dino Di Carlo et Elodie Sollier.
J’adresse également quelques lignes ici à Mme Christine Lafforgue pour son accueil chaleureux et son aide lors des expériences réalisées au LISBP et pour l’éclairage biologique qu’elle a apporté à ce travail. Je remercie sincèrement Mme Micheline Abbas pour les comparaisons numérique/expérimentale que nous avons pu faire grâce à ses simulations numériques et pour
II
son apport théorique sur le sujet.
Je remercie également toutes les personnes de l’ICA qui m’ont aidé au quotidien, à un moment ou à un autre – en particulier Christine Barrot, Marcos Rojas-Cardenas, Nicolas Laurien, Stéphane Orieux, Jie Chen, Jian Fu, Shiqi Wang, Tao Li, Yiwei Wang, Donghai Qiu, Tohme Tohme, Hacene Si-Hadj-Mohand, Guillermo López-Quesada, Dominique Fratantonio, Daniel Mariuta, Varun-Kumar Yeachana – ainsi que toutes les personnes que je n’ai pas citées et qui m’ont encouragé.
Enfin, je remercie mes parents qui m’ont toujours soutenu et ont toujours cru en moi et bien sur ma femme Yanping pour sa compréhension et son aide tout au long de la réalisation de ces travaux. Elle m’a donné le plus beau des cadeaux, notre fils Nolan.
III
Abstract
This thesis aims to better understand the physical mechanism controlling the trajectories of particles in confined flows in order to improve predictive models. In the first step we have developed experimental tools based on microscopy and image analysis in order to identify the particles positions in confined flows in square section microchannels. These tools have then permitted to obtain original results on the lateral migration of spherical particles in flows at low inertia. In particular, we have shown that neutrally buoyant particles in square channels are focused at channel center at low Reynolds number and at four channel faces at high Reynolds, and that there is a co-existence of the two regimes for intermediate Reynolds. In addition to their lateral migration, under certain conditions, particles can also align in the flow direction to form trains of evenly spaced particles. This work has thus been devoted to the statistical study on the quantification and localization of the train formation and configuration. It has been shown that the formation of trains is controlled by the flow configuration in the wake of the particles, and that the train characteristics, i.e., the fraction of particles in trains and the interparticle distance, are functions of the particle Reynolds number. Finally, preliminary results on flows of bidisperse suspensions have been obtained. To conclude, the perspectives and future developments of this work are presented.
Keywords:
V
French Summary
Migration Inertielle de Particules en Écoulement dans des Microcanaux Introduction
Dans de nombreux domaines tels le diagnostic clinique, la recherche biologique, le traitement de l’eau, de l’air, l’industrie pharmaceutique ou encore l’analyse chimique, il est très important de détecter, compter, concentrer ou séparer les particules d’un mélange. Les systèmes micro-fluidiques permettant de manipuler des particules dans un micro-écoulement peuvent répondre à ce besoin. De nombreux dispositifs de micro-séparation ont été développés, certains basés sur la présence d’un ou deux écoulements secondaires (méthode dite « par flux pincé »), d’autres sur l’utilisation de champs externes. Récemment, une méthode passive sans flux pincé appelée méthode de focalisation inertielle a attiré beaucoup d'attention car elle ne repose que sur l’action de forces hydrodynamiques sans utiliser ni écoulements supplémentaires ni champ externe. La focalisation inertielle s’appuie sur les mécanismes naturels de migration inertielle des particules au sein d’un fluide. En effet, des forces de portance inertielles apparaissent au sein d’un micro-canal dans certaines conditions d’écoulement ; ces forces poussent les particules à la fois à se déplacer latéralement vers des positions d'équilibre spécifiques et à s’organiser longitudinalement pour former des trains. Les caractéristiques de ces deux phénomènes (positions d'équilibre, longueur de focalisation, distance inter-particule…) dépendent des conditions d'écoulement, de la géométrie du canal et des propriétés des particules. L’existence conjointe de ces deux manifestations (déplacement latéral et organisation longitudinale) est très porteuse car elle laisse envisager la possibilité de développer des dispositifs où la position des particules est contrôlée dans les trois dimensions de l’écoulement.
Cette thèse présente une étude expérimentale de la migration inertielle de particules sphériques dans des canaux droits de section carrée principalement. Les résultats obtenus permettent d’une part d’accroître la compréhension des mécanismes de migration et d’autre part d’avancer sur le développement de nouveaux dispositifs de séparation.
VI
Etude bibliographique
Le phénomène de migration inertiel a été mis en évidence en premier par Poiseuille (1836) ; il a observé des distributions non homogènes des cellules dans des vaisseaux capillaires. En 1961 Segré et Silberberg ont expérimentalement analysé ce phénomène et trouvé que des sphères en écoulement dans un canal de section circulaire s’accumulaient à une distance du centre du tube proche de 0,6 fois le rayon du canal. Ce phénomène de migration appelé « Tubular pinch effect » est dépendant de la géométrie du canal. Dans un canal de section carrée, il est maintenant connu que les particules se concentrent sur quatre positions d'équilibre localisées à proximité du centre des parois du canal et dans un canal de section rectangulaire sur deux positions d'équilibre proches du centre des grandes parois.
D’après l’analyse des travaux de la littérature, de nombreuses forces peuvent agir sur des particules en écoulement. Nous nous sommes intéressés dans cette thèse à l’étude de particules sphériques rigides iso-denses en écoulement dans des canaux carrés droits. Les particules subissent dans ce cas à la fois une force de traînée parallèle à l’écoulement qui ne participe pas à la migration latérale, et des forces de portance perpendiculaires à l’écoulement : la force de répulsion des parois qui pousse les particules vers le centre du canal, la force due au gradient de cisaillement qui les dirige vers les parois du canal et la force de Magnus due à la rotation des particules qui les mène vers la zone où le cisaillement est faible. L’équilibre entre ces 3 forces conduit les particules à se concentrer sur des positions d’équilibre spécifiques. Dans des configurations plus complexes, d’autres forces peuvent intervenir : une force de Saffman apparait par exemple lorsque la particule n’a pas la même vitesse que le fluide ; des forces liées aux propriétés rhéologiques du fluide ou encore à la présence d’écoulements secondaires induits par la courbure du canal peuvent aussi s’ajouter. La migration inertielle est aussi influencée par de nombreux paramètres liés aux propriétés des particules, comme leur taille, leur concentration, leur déformabilité, leur forme ou leur densité.
VII Méthodologie et dispositif expérimental
Deux méthodes ont été choisies et développées pour étudier la migration de particules dans nos conditions d'écoulement : la méthode de visualisation in situ et la méthode de projection axiale. Le premier dispositif et le plus utilisé est basé sur la visualisation in situ. L’écoulement est généré au sein de microcanaux en borosilicate carrés de 80 µm de côté et de longueur allant de 10 à 60 cm par un pousse-seringue et est observé à l’aide d’un microscope optique traditionnel. Une camera CCD permet la capture des images. La suspension de particules de polystyrène est rendue isodense par un mélange de glycérol et d’eau ultrapure. A chaque position, 2000 images sont prises pour permettre une analyse statistique satisfaisante.
Dans ces conditions expérimentales, la profondeur de mesure est estimée à 10 µm. Nous avons donc partitionné le canal en 8 couches de mesure. L’observation des distributions des particules dans les différentes couches d’une même configuration permet de déduire la distribution probable des particules dans la section transversale.
Pour déterminer les distributions de particules à partir des images capturées, un programme de post-traitement sur Matlab a été développé. En premier lieu, les parois du canal sont identifiées sur l’image initiale, afin de réaliser la rotation et le recadrage sur l’intérieur du canal. Puis nous procédons à la soustraction du bruit de fond. L’image en niveaux de gris est ensuite convertie en image binaire par seuillage. Enfin, les particules sont filtrées selon leur forme et la présence d’un point brillant. Le résultat final, correspondant à l’accumulation des particules identifiées sur les 2000 images est présenté sur une même figure pour visualiser la distribution spatiale statistique.
La deuxième méthode optique est basée sur la projection axiale. Dans ce dispositif, le micro-écoulement est projeté sur une membrane placée perpendiculairement au canal. Les particules fluorescentes sont capturées sur la membrane et observées sous microscope à fluorescence. L’image obtenue permet de déterminer la distribution des particules en sortie du canal. Cette méthode sert dans cette thèse de méthode complémentaire permettant de visualiser la
VIII
distribution des particules dans la section transversale.
Migration latérale dans des suspensions mono-disperses
Nous avons distingué dans notre étude le cas des écoulements à Reynolds modérés (compris entre 10 et 200 pour les configurations étudiées), celui des écoulements faiblement inertiels (Re <1), ainsi qu’une zone intermédiaire (1 < Re < 10) dite « de transition ».
Dans le cas des écoulements à Reynolds modérés, plusieurs résultats intéressants ont été mis en évidence.
o A un Reynolds donné, au fur et à mesure de l’éloignement de l’entrée du canal, la distribution en particules varie d’un anneau carré lâche à un anneau carré plus étroit puis à 4 tâches situées à proximité du centre de chaque face. Ces distributions montrent que la focalisation se développe le long du canal en deux étapes : dans un premier temps, les particules migrent latéralement, c’est-à-dire perpendiculairement aux iso-vitesse, pour former un anneau. Dans un deuxième temps, elles migrent cross-latéralement, c’est-à-dire parrallèlement aux parois, au sein de l’anneau vers les 4 positions d’équilibre. Ce phénomène de migration en deux étapes a été confirmé numériquement par Micheline Abbas. Les trajectoires simulées des particules ont de plus mis en évidence que la première étape où les particules traversent les contours d'iso-vitesse et atteignent un anneau d'équilibre est rapide alors que la deuxième étape où elles se déplacent le long de l'anneau d'équilibre vers les centres des faces nécessite une importante longueur de canal.
o A distance fixée de l’entrée du canal, plus le nombre de Reynolds est élevé plus la focalisation est développée. Nous pouvons donc conclure que le Re favorise la focalisation dans la gamme de Reynolds modérés considérée.
o A distance de l’entrée du canal et Reynolds fixés, la migration cross-latérale est plus avancée pour les grosses particules que pour les petites. Nous pouvons alors conclure que l’augmentation de la taille des particules favorise la focalisation.
IX
o La localisation exacte de la position d’équilibre est un élément clé pour la conception de micro-dispositifs de concentration et de séparation. Nous avons mis en évidence qu’elle se rapproche des parois lorsque Re augmente et qu’elle est plus proche des parois pour les petites particules que pour les plus grosses.
o Pour tenter de quantifier le niveau de développement de la focalisation, nous avons introduit un paramètre adimensionnel appelé degré de focalisation, défini comme le rapport entre le nombre de particules présentes dans quatre zones déterminées centrées sur les positions d’équilibre sur le nombre total de particules. A Reynolds donné, le degré de focalisation augmente au fur et à mesure de l’avancée dans le canal. A distance de l’entrée fixée, le degré de focalisation augmente avec le Reynolds, atteint un maximum aux environs de Re = 150 puis diminue. De fait, l’observation fine des distributions à Re = 280, semble montrer une plus grande dispersion, les particules formant à nouveau un anneau proche du périmètre du canal. Ce phénomène est cohérent avec le dernier article de Nakagawa datant de 2015 qui montre numériquement que des positions d’équilibre supplémentaires apparaissent au-delà d’un Re critique proche de 260.
Dans le cas des écoulements faiblement inertiels (Re < 1), un nouveau régime de migration a été observé où les particules migrent vers le centre du canal. La migration vers le centre est un phénomène lent et des canaux de grande longueur sont nécessaires pour amener la focalisation à son terme.
Pour les Reynolds intermédiaires (1 < Re < 10 dans notre configuration expérimentale), les deux régimes de migration cohabitent ; nous retrouvons donc simultanément des particules focalisées au centre du canal et d’autres proches des parois. Une augmentation de la concentration en particules décale la zone de transition vers des Reynolds plus élevés et favorise la migration vers le centre. Une augmentation de la taille des particules quant à elle, favorise la focalisation quel que soit le régime de migration : vers le centre ou vers les parois.
X
Formation des trains
La migration inertielle des particules engendre simultanément le déplacement des particules vers des positions d’équilibre spécifiques et leur organisation longitudinale pour former des trains. Matas en 2004 suggère que la formation des trains est liée à la présence de lignes de courant inversées autour des particules. Lee en 2010 propose un mécanisme de formation des paires de particules. Il suggère que forces de traînées liées aux lignes de courant inversées et forces inertielles contribuent à générer des interactions hydrodynamiques entre particule suiveuse et particule de tête aboutissant à la formation d’une paire.
Notre dispositif expérimental, en combinaison avec le programme de post-traitement Matlab élargi, a permis de localiser les trains et d’évaluer statistiquement deux paramètres fondamentaux : la fraction de particules en trains et la distance entre particules d’un même train. La localisation des trains a permis de montrer que la formation des trains se mettait en place uniquement une fois les particules sur leurs positions d’équilibre et uniquement sur les positions d’équilibre proches des parois. La migration faiblement inertielle observée à faible nombre de Reynolds (Re < 1) vers le centre du canal, ne semble pas être accompagnée par l’organisation longitudinale des particules. La fraction de particules en trains augmente en fonction du Reynolds dans la gamme de Reynolds modérés étudiée, passe par un maximum pouvant atteindre 80 % puis diminue. Nous avons montré que ce pourcentage était directement corrélé à la fraction de particules ayant déjà atteint leurs positions d’équilibre autrement dit au degré de focalisation. La distance entre particules d’un même train quant à elle, diminue avec le nombre de Reynolds indépendamment de la concentration, sauf lorsque la limite d'encombrement est atteinte. Dans ce dernier cas (i.e., lorsque le nombre de particules présentes dans la suspension dépasse le nombre maximum de particules alignables sur les lignes d’équilibre), la distance inter-particulaire diminue pour que toutes les particules puissent prendre place sur les positions d'équilibre.
XI Migration dans des suspensions bidisperses
Nous avons commencé de manière exploratoire à étudier la migration latérale (à la fois le déplacement latéral et l’organisation longitudinale) d’un mélange de particules sphériques de deux tailles différentes déjà étudiées en suspensions mono-disperses. Les distributions de particules obtenues en suspension mono- et bidisperse pour chacune des tailles de particules sont similaires, tendant à prouver que, la bidispersité ne modifie pas la migration latérale dans nos conditions expérimentales. Elle semble par contre influencer la formation des trains. Nous avons observé à la fois des trains mixtes et des trains monodisperses, 80 % d’entre eux commençant par une grosse particule et 60 % se terminant par une petite. La fraction de particules en trains augmente, passe par un maximum puis diminue de manière similaire pour les deux tailles de particules mélangées mais les maximums atteints sont supérieurs en suspension bidisperse à ceux atteints en suspension monodisperse. Il semblerait donc que la bidispersité favorise la formation de trains.
Conclusion et perspectives
Ce travail de thèse apporte une avancée significative sur la compréhension du phénomène de migration inertielle. Il permet ainsi à la communauté scientifique de mieux appréhender et prédire le transport de particules en micro-écoulement liquide. Il ouvre aussi de très nombreuses perspectives. A court terme, il s’agirait d’approfondir la modification du phénomène de migration latérale à Re > 200, d’étudier la robustesse des trains formés et de creuser l’influence de la bidispersité sur la migration inertielle. A plus long terme, les connaissances acquises devrait permettre le développement de nouveaux dispositifs de détection, concentration ou séparation de particules à micro-échelle et donc intégrables sur un laboratoire sur puce.
XIII
Table of Contents
Remerciements ... I Abstract ... III French Summary ... V Table of Contents ... XIII List of Figures ... XVII List of Tables ... XXV Nomenclature ... XXVII
Introduction ... 1
Chapter 1. Bibliographic Study ... 5
1.1 Focusing techniques ... 5
1.1.1 Sheath flow focusing techniques ... 5
1.1.2 Sheathless flow focusing techniques ... 7
1.2 Phenomenon of inertial migration ... 11
1.3 Mechanisms of inertial migration for neutrally buoyant particles ... 14
1.3.1 Wall-induced lift force ... 15
1.3.2 Shear-induced lift force ... 15
1.3.3 Rotation-induced lift force ... 16
1.3.4 Secondary-flow drag force ... 17
1.4 Influence of channel, particle and fluid characteristics on inertial focusing ... 18
1.4.1 Channel properties ... 18
1.4.2 Particle properties ... 22
1.4.3 Fluid and flow properties ... 27
XIV 1.5.1 Particle separation ... 30 1.5.2 Volume reduction ... 32 1.5.3 Particle alignment ... 32 1.5.4 Solution exchange ... 33 1.6 Summary ... 34
Chapter 2. Methodology Development and Experimental Design ... 37
2.1 Introduction to currently existing techniques... 37
2.1.1 Tomographic techniques ... 37
2.1.2 Ultrasonic technique ... 39
2.1.3 Optical techniques ... 39
2.2 In situ visualization method ... 42
2.2.1 Materials ... 43
2.2.2 Experimental setup ... 47
2.2.3 Implementation ... 48
2.3 Particle projection method ... 58
2.3.1 Materials ... 59
2.3.2 Experimental setup and implementation ... 60
2.3.3 Data processing ... 61
2.4 Summary ... 62
Chapter 3. Lateral Migration in Monodisperse Suspensions ... 63
3.1 Particle migration at moderate inertia ... 64
3.1.1 Influence of the distance from channel inlet z/H ... 64
3.1.2 Influence of Reynolds number Re ... 67
3.1.3 Influence of particle to channel size ratio ... 69
3.1.4 Equilibrium positions localization ... 70
3.1.5 Outermost edge of particle distributions ... 72
XV
3.2 Particle migration at low inertia ... 77
3.2.1 Influence of Reynolds number Re ... 77
3.2.2 Influence of channel length z/H ... 79
3.2.3 Influence of particle volume fraction ... 81
3.2.4 Influence of particle to channel size ratio ... 86
3.3 Preliminary study on biological particles... 89
3.4 Summary ... 92
Chapter 4. Particle Alignment ... 95
4.1 Bibliographic study ... 95
4.2 Characterization of particle trains ... 98
4.2.1 Identification of trains ... 98
4.2.2 Effect of Rep and dp ... 100
4.2.3 Low inertia ... 105
4.2.4 Effect of solid volume fraction ... 106
4.2.5 Particle trains in rectangular channels: preliminary results ... 108
4.3 Dynamics of particle self-ordering ... 110
4.4 Summary ... 114
Chapter 5. Migration in Bidisperse Suspension: Preliminary Results ... 115
5.1 Suspension ... 116
5.2 Lateral migration ... 116
5.2.1 Particle distribution ... 117
5.2.2 Equilibrium position localization ... 120
5.2.3 Outermost edge of particle distribution ... 121
5.2.4 Focusing degree ... 122
5.3 Longitudinal ordering of bidisperse particles ... 123
5.3.1 Fraction of particles in trains ... 124
XVI
5.3.3 Interparticle spacing ... 128
5.4 Summary ... 130
Conclusions & Perspectives ... 133
Conclusions ... 133
Perspectives ... 135
Bibliography ... 137
XVII
List of Figures
Fig. 1-1 Schematic drawing of symmetric sheath flow focusing (top view of microchannel): the sample flow supplied from the inlet channel at left is constrained laterally within the center of the microchannel by two neighboring sheath flows from the top and down side channels.
(Reprinted from Lee et al. (2006).)... 6
Fig. 1-2 Schematic of a typical active sheathless flow focuser. (Reprinted from Pamme (2007).) .. 8
Fig. 1-3 Cross-sectional schematic of the device for hydrophoretic separation. (Reprinted from Choi et al. (2012).) ... 9
Fig. 1-4 Scheme of the Deterministic Lateral Displacement method. (Reprinted from Loutherback et al. (2010).) ... 10
Fig. 1-5 Scheme of a gravity-driven separation device. (Reprinted from Huh et al. (2007).) ... 10
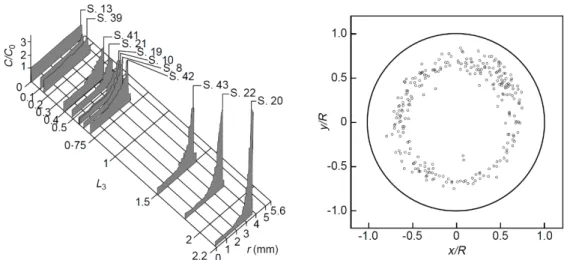
Fig. 1-6 Tubular pinch effect. The left image shows the experimental results of Segre and Silberberg (1962b), showing how radial migration develops in a cylindrical tube along channel. (Reprinted from Segre and Silberberg (1962b).) The right image shows the experimental distribution of particles in the cross section of a cylindrical tube at Re = 350. (Reprinted from Matas et al. (2004c).) ... 12
Fig. 1-7 Inertial focusing of particles in a cylindrical channel, a square channels and a rectangular channel, from left to right in the image, respectively. (Reprinted from Di Carlo (2009) and Amini et al. (2014).) ... 13
Fig. 1-8 Schematic drawing of inertial focusing in a rectangular microchannel. (Reprinted from Zhou and Papautsky (2013).) ... 14
Fig. 1-9 Wall-induced lift force. ... 15
Fig. 1-10 Shear-induced lift force. ... 16
Fig. 1-11 Rotation-induced lift force. ... 17
Fig. 1-12 Secondary-flow drag force, i.e., Stokes’ drag. ... 18 Fig. 1-13 Simulated velocity profiles, normalized Dean flow vectors and idealized particle
XVIII
dp/Dh = 0.149 green, dp/Dh = 0.225 red) in a straight channel (δ = 0) and increasing in curvature left to right. (Reprinted from Martel and Toner (2013).) ... 20 Fig. 1-14 Inertial focusing in non-rectangular channels, from left to right, half-circular channel,
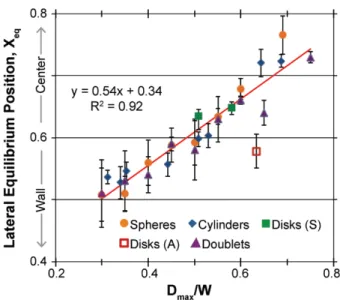
narrow triangular channel and wide triangular channel, respectively. (Reprinted from Kim et al. (2016).) ... 21 Fig. 1-15 Schematic of spiral channel with trapezoid cross-section indicating the inertial focusing of 10 μm (white) and 6 μm (red) beads. (Reprinted from Wu et al. (2012).) ... 21 Fig. 1-16 Schematic diagram descriging Hur’s device composed of expansion-contraction reservoirs for particle separation. (Reprinted from Hur et al. (2011c).) ... 22 Fig. 1-17 Saffman’s force. V is the relative velocity of the sphere. V > 0, the sphere moves faster than the fluid; V < 0, the sphere goes slower than the fluid. ... 23 Fig. 1-18 Distance between the equilibrium position and the closest wall in function of normalized particle maximum diameter for various shapes. (Reprinted from Hur et al. (2011b).) ... 24 Fig. 1-19 Schematic and overlaid micrographs illustrating the inertial focusing of randomly
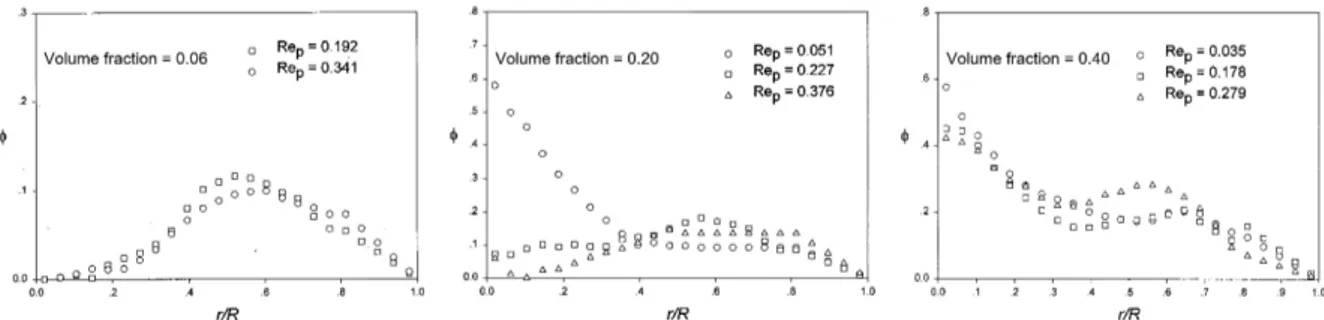
distributed ellipsoid particles. (Reprinted from Masaeli et al. (2012).) ... 25 Fig. 1-20 Distance between equilibrium position and the closest wall in rectangular microchannels for viscous droplet and elastic particles of different particle diameter to channel width ratios and various viscosity ratio. (Reprinted from Hur et al. (2011b).) ... 26 Fig. 1-21 Equilibrium positions within the rectangular channel cross section as a function of Re. (Reprinted from Ciftlik et al. (2013).) ... 27 Fig. 1-22 Migration regimes in a tube as a function of particle volume fraction Φ and Reynolds
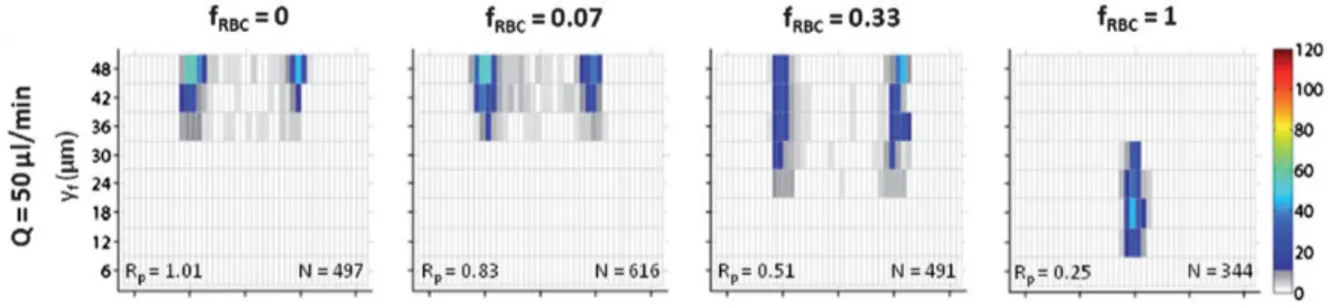
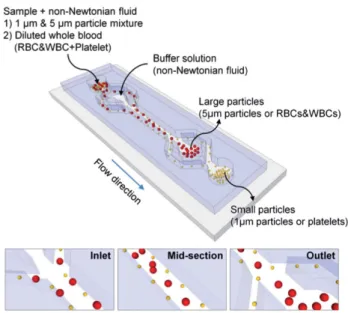
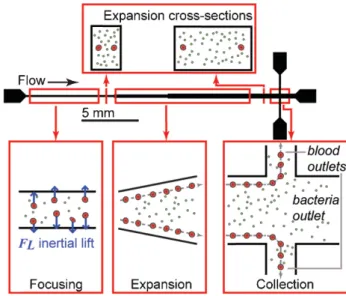
number Re. (Reprinted from Han et al. (1999).) ... 28 Fig. 1-23 Cancer cell distribution in a half of rectangular channel cross section at different flow and concentration conditions. (Reprinted from Lim et al. (2012).) ... 29 Fig. 1-24 Schematic diagram of size-dependent particle separation using elasto-inertial characteristics of non-Newtonian fluid flow. (Reprinted from Nam et al. (2012).) ... 30 Fig. 1-25 Schematic of equilibrium separation in a straight channel with an expansion zone.
XIX Fig. 1-26 Schematic of kinetic separation in a rectangular channel with modulation of aspect ratio. (Repringted from Zhou et al. (2014).) ... 31 Fig. 1-27 Sequential images along a fluidic path in a double spiral channel showing the enrichment of particles. (Reprinted from Seo et al. (2007).) ... 32 Fig. 1-28 Schematic of Hur’s design for particle alignment. (Reprinted from Hur et al. (2011c).) .. 33 Fig. 1-29 Schematic of Egg’s design to control single-cell encapsulation. (Reprinted from Edd et al. (2008).) ... 33 Fig. 1-30 Schematic of Gossett’s device for rapid inertial solution exchange. (Reprinted from Gossett et al. (2012).) ... 34 Fig. 2-1 Scanning Electron Microscope (SEM) image of the microchannel cross section (80 µm × 80 µm). ... 45 Fig. 2-2 Experimental setup of in situ visualization method. ... 48 Fig. 2-3 Image of 8.7-µm particles flowing in an 80 µm × 80 µm square channel with the focus at the channel midplane. ... 48 Fig. 2-4 Observation of a bright spot with the focal plane at the top of the particle. ... 49 Fig. 2-5 Displacement of the objective focal plane. (Barrot Lattes et al. 2008) ... 50 Fig. 2-6 Calibration of the displacement of the focal plane. ... 51 Fig. 2-7 Illustration of the localization process of the midplane of the channel. ... 52 Fig. 2-8 Depth of the focus field calibrated by static particles with a step size of 1 µm. ... 53 Fig. 2-9 Depth of measurement calibrated by static particles in suspension with a step of 1 µm... 54 Fig. 2-10 Illustration of measurement layer in a microchannel. ... 55 Fig. 2-11 Complete image post-processing. (a) Detection of channel edges and inclination; (b)
Rotation of the microchannel; (c) Choice of the region of interest; (d) Image after subtraction of background noise; (e) Conversion to a binary image; (f) Identification of real particles; (g) Selection of in-focus particles; (h) Overall in-focus particle positions summed from 2,000 images. ... 56 Fig. 2-12 PDF calculation method. (a) Measurement planes. (b) Example of a PDF histogram. (c)
XX
Fig. 2-13 Experimental setup of particle projection method. ①: microchannel; ②: membrane; ③: stainless steel syringe; ④: syringe pump; ⑤: membrane holder; ⑥: manometer; ⑦: pump; ⑧: liquid outlet; ⑨: filtered water; ⑩: micrometric screw. (Lafforgue-Baldas et al. 2013) ... 61 Fig. 2-14 Fluorescent image illustrating the distribution of particles in the cross section. ... 61 Fig. 3-1 Spatial distributions (PDFs) of 8.7-µm test particles over normalized lateral positions at
fixed Re = 11.2 for various measurement positions z/H. ... 64 Fig. 3-2 Spatial distributions (PDFs) of 8.7-µm test particles over normalized lateral positions at
fixed Re = 28 for various measurement positions z/H. Schematics of the particle distributions in the cross section are also sketched at the bottom of the figures. ... 66 Fig. 3-3 Spatial distributions (PDFs) of 8.7-µm test particles over normalized lateral positions at
fixed Re = 56 for various measurement positions z/H. Schematics of the particle distributions in the cross section are also sketched at the bottom of the figures. ... 66 Fig. 3-4 Simulated trajectories of individual particles for a quarter of the channel cross section. The thick black lines are the particle trajectories for Re = 120; the red, blue and green dashed lines are the trajectories from the same initial position for Re = 12, 60 and 120, respectively. (Abbas et al. 2014) ... 67 Fig. 3-5 Spatial distributions (PDFs) of 8.7-µm test particles over normalized lateral positions at
finite inertia for various Re at a fixed entry length z/H = 1,000. ... 68 Fig. 3-6 Spatial distributions (PDFs) of 5.3-µm test particles over normalized lateral positions for various Re at a fixed entry length z/H = 1,000. ... 69 Fig. 3-7 Cross-sectional distributions of 8.7-µm (red) and 4.8-µm (green) test particles on a
membrane at Re = 8.3 and 16.6, respectively. ... 70 Fig. 3-8 Particle equilibrium position Xeq as a function of Re. ... 72 Fig. 3-9 Particle outermost edge Xout as a function of Re for different dp/H. ... 73 Fig. 3-10 Focusing degree as a function of channel length z/H for 8.7-µm particles at Re = 11.2. .. 74 Fig. 3-11 Degree of migration at fixed channel length z/H = 1,000 with respect to Re. ... 75 Fig. 3-12 Overall particle distributions (left) and in-focus particle distributions (right) at channel
XXI midplane at Re = 112, 210 and 280. ... 76 Fig. 3-13 Particle distributions obtained experimentally at Re = 144 (left side), Re = 260 (middle) and
Re = 514 (right side). (Reprinted from Nakagawa et al. (2015).) ... 76
Fig. 3-14 Spatial distributions (PDFs) of 8.7-µm test particles over normalized lateral positions at low and finite inertia at a fixed entry length z/H = 7,125 for various Re. Schematics of the particle distributions in the cross section are also sketched at the bottom of the figures. . 78 Fig. 3-15 Spatial distributions (PDFs) of 8.7-µm test particles over normalized lateral positions at
fixed Re = 1.4 for various measurement position z/H. ... 80 Fig. 3-16 Spatial distributions (PDFs) of 8.7-µm test particles over normalized lateral positions at
fixed Re = 5.6 for various measurement position z/H. ... 81 Fig. 3-17 Spatial distributions (PDFs) of 8.7-µm test particles over normalized lateral positions at a fixed entry length z/H = 7,125 for various Re at a concentration Φ = 0.2 %. ... 82 Fig. 3-18 Spatial distributions (PDFs) of 8.7-µm test particles over normalized lateral positions at a fixed entry length z/H = 7,125 for various Re at a high concentration Φ = 0.4 %. ... 83 Fig. 3-19 Particle cluster formation at high concentration. ... 84 Fig. 3-20 Spatial distributions (PDFs) of 8.7-µm test particles over normalized lateral positions at
fixed Re = 1.4 and 5.6 for various entry length z/H at a high concentration Φ = 0.4 %. ... 85 Fig. 3-21 Spatial distributions (PDFs) of 5.3-µm test particles over normalized lateral positions at a fixed entry length z/H = 7,125 for various Re. ... 87 Fig. 3-22 Spatial distributions (PDFs) of 5.3-µm test particles over normalized lateral positions at a fixed entry length z/H = 7,125 for various Re. (Aggregations are taken into account) ... 88 Fig. 3-23 Cross-sectional distributions of 8.7-µm test particles on a membrane at Re = 1.0, 2.1 and of 4.8-µm test particles at Re = 2.1, from left to right respectively. ... 89 Fig. 3-24 Microscopic observation of the yeasts and the bacteria. (× 1,000 magnification) ... 90 Fig. 3-25 Cross-sectional distributions of the yeasts on a membrane at Re = 8.3, 12.5 and 16.6,
respectively. ... 91 Fig. 3-26 Cross-sectional distributions of the bacteria on a membrane at Re = 12.5 and 16.6,
XXII
Fig. 3-27 Microscopic image of the yeast cells in a micro channel at Re = 56 and z/H = 1,000. ... 91 Fig. 4-1 Simulated streamlines around an isolated sphere for Re = 48. (Reprinted from (Lee et al. 2010).) ... 96 Fig. 4-2 Shematic drawing of the interaction between two aligned particles. (Reprinted from (Lee et al. 2010).) ... 97 Fig. 4-3 (a) Schematic drawing of the experimental setup. Examples of image recorded of particle trains at mid height (y/H = 0.5), z/H = 1,000, Φ = 0.1 % and (b) Re = 210 (Rep = 2.48), (c)
Re = 112 (Rep = 1.32). ... 98 Fig. 4-4 (a) Original gray-scaled image horizontally rotated. (b) Post-processed image where
particles in trains are highlighted by rectangles. (c) PDFs of the normalized interparticle spacing for Rep = 0.33 and 3.31, Φ = 0.1 % and z/H = 1,000. ... 100 Fig. 4-5 (a) Fraction of particles in trains ψ as a function of particle Reynolds numbers Rep and channel Reynolds numbers Re (inset) for dp/H = 0.11 and dp/H = 0.066. (b) Normalized interparticle distance l/dp as a function of particle Reynolds numbers Rep for for dp/H = 0.11 and dp/H = 0.066. ... 103 Fig. 4-6 Normalized separation distance (l-dp)/H as a function of particle Reynolds numbers Rep for
dp/H = 0.11 and dp/H = 0.066. ... 104 Fig. 4-7 Images of the suspension at y/H = 0.5, z/H = 1,000, Φ = 0.4 % and (a) Rep = 8 × 10⁻⁴ (Re = 0.07) (b) Rep = 8 × 10⁻³ (Re = 0.7). ... 105 Fig. 4-8 (a) Fraction of particles in trains ψ and (b) normalized interparticle distance l/dp as a
function of particle Reynolds number Rep for dp/H = 0.11, z/H = 1,000 and Φ = 0.02 %, 0.05 %, 0.1 %, 0.2 %, 0.3 %, 0.8 % and 1 %. ... 106 Fig. 4-9 Staggered particle trains in rectangular channels. ... 108 Fig. 4-10 Streamlines around an isolated particle computed using lattice Boltzmann simulations. The solid and dotted circles suggest positions of adjacent particles. (reprinted from (Humphry et al. 2010).) ... 109 Fig. 4-11 Fraction of particles in trains ψ as a function of Reynolds number for z/H = 1,000 and Φ = 0.01 %. ...110
XXIII Fig. 4-12 (a) Fraction of particles in trains ψ and (b) normalized interparticle distance l/dp as a
function of normalized distance from channel inlet for dp/H = 0.11, Φ = 0.1 % and different particle Reynolds numbers Rep. ... 111 Fig. 4-13 PDFs of particles at y/H = 0.5 (midplane), Φ = 0.1 %, for different Rep and z/H. Bold red lines correspond to particles in the focal plane and dotted blue ones to particles present in the whole section. Schematics of the particle distributions are proposed at the bottom of the figures. ...112 Fig. 4-14 Numbers of particles in trains at different vertical heights (y/H = 0.15, 0.3 and 0.5) at Rep = 0.13 and Rep = 1.32 for dp/H = 0.11, Φ = 0.1 %. ...113 Fig. 5-1 Microscopic observation (50 ×) of a mixture of 5.3-µm and 8.7-µm particles. ...116 Fig. 5-2 Particle identification in the bidisperse suspension (Re = 5.6). 8.7-µm and 5.3-µm particles are surrounded by blue and red circles, respectively, and the in-focus and out-of-focus particles by bold and thin circles, respectively. ...117 Fig. 5-3 Overall particle distributions at different vertical positions at Re = 5.6 and 112. ...118 Fig. 5-4 Particle distributions (PDFs) of bidisperse 8.7-µm (blue) and 5.3-µm (red) particles as a
function of Re, at different y/H positions and at z/H = 1,000. ...119 Fig. 5-5 Xeq (normalized distance between the equilibrium position and the channel wall) as a
function of Re, for bidisperse and monodisperse 8.7-µm and 5.3-µm particles. ... 120 Fig. 5-6 Xout (normalized distance between the outmost edge and the channel centerline) as a
function of Re, for bidisperse and monodisperse 8.7-µm and 5.3-µm particles. ... 122 Fig. 5-7 Focusing degree as a function of Re, for bidisperse 8.7-µm and 5.3-µm particles and
monodisperse 8.7-µm particles. ... 122 Fig. 5-8 Particle trains are identified at the centers of the channel front wall and of the channel
bottom wall (Re = 112, z/H = 1,000, y/H = 0.5). The 8.7-µm and 5.3-µm particles are encircled by blue and red squares, respectively. ... 123 Fig. 5-9 Fraction of particles in trains as a function of Re, for bidisperse and monodisperse 8.7-µm and 5.3-µm particles. ... 124 Fig. 5-10 Fraction of particles in trains as a function of Rep, for bidisperse and monodisperse particles
XXIV
and monodisperse 8.7-µm and 5.3-µm particles. ... 126 Fig. 5-11 Examples of bidisperse particle trains, often beginning with a large particle and ending with a small one. (Re = 112) ... 127 Fig. 5-12 Fraction of trains beginning with large particles and the fraction of trains ending with small particles as a function of Re. ... 127 Fig. 5-13 Mean interparticle spacing for bidisperse particles as a function of Re, compared to the
interparticle spacings for 8.7-µm and 5.3-µm monodisperse particles... 129 Fig. 5-14 Distance between two 8.7-µm particles (blue square), that between two 5.3-µm particles
(red triangle), and that between the two particles of different sizes (black spot) in a mixed bidisperse particle train. (Re = 210) Dotted lines correspond to the interparticle distances observed in a monodisperse suspension of 5.3-µm particles (red line) and 8.7-µm particles (blue line). The black solid line gives the average interparticle distance in the bidisperse suspension. ... 130
XXV
List of Tables
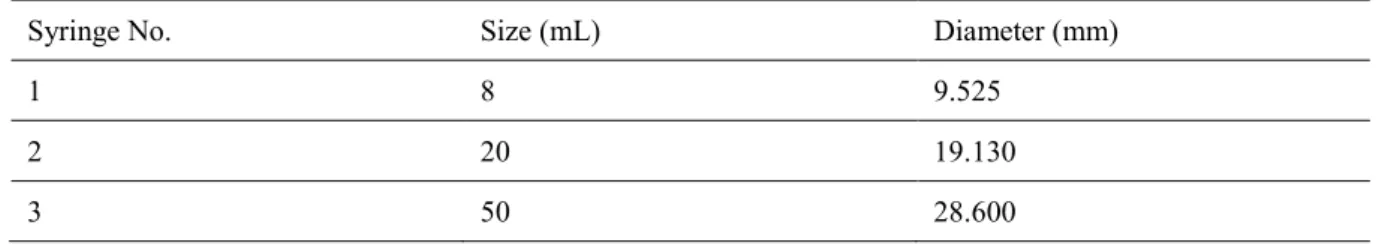
Table 2-1 Summary of monodisperse particles... 43 Table 2-2 List of microchannels used in our experimental studies. ... 45 Table 2-3 Summary of stainless steel syringe used in the experiment. ... 46
XXVII
Nomenclature
Roman Symbols H Channel height W Channel width Dh Hydraulic diameter dp Particle diameterl Interparticle distance (particle center-to-center distance)
l-dp Separation distance (particle surface-to-surface distance)
Re Reynolds number
Rep Particle Reynolds number
x Horizontal distance in the channel perpendicular to the flow
y Vertical distance in the channel perpendicular to the flow
z Distance in the channel parallel to the flow
Q Flow rate
U Mean flow velocity
Um Maximum flow velocity
Xeq Equilibrium position
Xout Outermost edge of particle cluster
M Magnification of lens
λ Wavelength
XXVIII
nf Refractive index of the studied object
Greek Symbols
λ Particle axial number density
Φ Particle volume fraction
ψ Fraction of particles in trains
ρ Density
μ Viscosity
δobj Displacement of objective
δ Displacement of focal plane
δw Errors in determing channel walls
δp Errors in determing particle centers
1
Introduction
Particle detection, identification and separation in fluids are essential for society. For example, the search for contaminants in food fluids, the detection of pathogens in bodily fluids and the water filtration are some major environment and public health issues. The need of particle manipulation on the micro-scale is rapidly expanding due to the more stringent industrial standards and the more heightened public health awareness. Particularly, many specific fields like pharmaceutics, clinical diagnostics, chemical analysis, medical diagnostics, and tissue engineering require high-purity processing since even slight traces of contaminants may cause a dramatic adverse impact.
To satisfy these demands, a variety of particle separation technologies have been developed in the last decades. The commonly used conventional methods (centrifugation and mechanical filtration) often requiring large volumes are less than optimal and are expensive for separating a wide range of particle sizes (Bhagat et al. 2008c). Various miniaturized techniques have thus been proposed based on microfluidics. Sheath flows or external force fields such as magnetic, acoustic, electrical and optical forces are applied to drive the particle migration and separation. However, the requirement of sheath flows or external forces complicates the device fabrication, increases the cost and makes the miniaturization difficult.
More recently, inertial focusing techniques have gained significant attention since they only rely on the hydrodynamic forces and do not require any sheath flows, outer forces or complex channel geometries. These techniques are thus very appealing as they could allow continuous high-throughput and low-cost processing, non-invasive and label-free manipulation, and simple operation (Xiang et al. 2013), and thus could be suitable for a broad range of applications from filtration & enrichment to cytometry of cells (Lim et al. 2012; Zhou et al. 2013a). These techniques also permit the automatization, parallelization and miniaturization in the field of particle manipulation (Lee et al. 2010; Kim and Yoo 2008).
2
the fluid. It has been reported that flowing particles can naturally move and focus on some distinct equilibrium positions in the channel cross section, depending on the flow conditions and the channel geometry (Di Carlo 2009). Aside from the lateral focusing, particles are found to order longitudinally along the main flow direction (Lee et al. 2010; Edd et al. 2008). This self-ordering phenomenon suggests the possibility of manipulating particle positions not only in the transverse but also in the flow direction. Understanding the inertial lateral migration and the longitudinal ordering phenomena is actually essential to predict the trajectories of particles flowing in microchannels.
The present thesis aims at experimentally investigating the inertial focusing of spherical particles flowing in square straight microchannels. Straight channels and spherical particles are chosen because of their high simplicity allowing the study of the basic mechanisms. Square channels are used due to their easy manufacturing process and the sharp location of the particle equilibrium positions at moderate Reynolds numbers. This dissertation consists of the following five chapters:
Chapter 1 Firstly, we introduce the different existing focusing techniques. Then we focus on
the inertial migration phenomenon, by reviewing the main works published on the subject, involving its fundamental mechanisms, the essential parameters that influence the inertial migration and the applications.
Chapter 2 We firstly reviewed the current experimental techniques to study the particle
positions in two-phase flows. Then the in situ visualization method developed in this work is described, along with the experimental setup design, the implementation, and the post-processing algorithms to estimate the three dimensional particle distributions. The particle projection method is also presented, for direct visualization of particle distribution in the channel cross section, to give a complementarity to the in situ visualization method results.
Chapter 3 This chapter is devoted to the investigation of the lateral migration phenomenon of
monodisperse particles in square channels. The migration process and the final equilibrium positions are studied through the observation of the particle distribution at different distances
3
from the channel inlet for various Reynolds numbers, particle volume fractions and particle to channel size ratios.
Chapter 4 We delve into the particle longitudinal ordering phenomenon. The fraction of
particles in trains and the interparticle spacing are evaluated for various Reynolds numbers, particle volume fractions, particle to channel size ratios and distances from channel inlet. A discussion on the possible mechanism for this longitudinal ordering is also proposed.
Chapter 5 We present a preliminary study on the migration of particles of two different sizes
mixed into a suspension. Both lateral focusing behaviors and longitudinal ordering are studied and compared with the results obtained for monodisperse suspensions of the same particles, in order to show the effect of bidispersity.
5
Chapter 1. Bibliographic Study
Recent advances in microfluidic technology have led to the emergence of micro total analysis systems (μ-TAS) or lab-on-a-chip (LOC) devices. Such devices have shown a considerable potential for a wide variety of applications in biochemistry, biophysics and medical fields, including biological and chemical assays, drug delivery, drug screening and so on (Lee et al. 2006). The ability to precisely focus particles on specific positions is essential in some of these devices, particularly when the objective is to separate cells, functionalized beads, or other particles from a solution which may contain other undesirable elements (Loutherback et al. 2010).
In this chapter, we first thoroughly describe the existent methods for particle focusing, including sheath flow focusing and sheathless flow focusing among which we highlight the inertial focusing as the most potential solution. Secondly we present the current state of the art in the understanding of the fundamental mechanisms controlling the phenomenon of inertial focusing, including the wall-induced lift force, the shear-induced lift force, the rotation-induced lift force and the secondary-flow drag force. Then the important parameters, involving the channel properties, particle properties and fluid properties, that influence the inertial migration are discussed. Finally, different applications of inertial focusing are presented.
1.1 Focusing techniques
The particle focusing methods can be divided into two types: sheath flow and sheathless flow techniques. Sheath flow focusers use one or more particle-free fluids to pinch the particle-rich fluid in order to focus particles. Sheathless flow focusers use inertial fluid dynamics or externally applied fields (electrical, magnetic or acoustic).
1.1.1 Sheath flow focusing techniques
Sheath flow focusing is probably the most commonly used approach in microfluidic devices (Zhao et al. 2007) and has been demonstrated in a wide variety of applications, including flow
6
cytometers for cell counting and sorting, cell patterning, diffusion-based mixers, microfluidic injection systems and micro flow switches (Yang et al. 2005).
Two types of sheath flows are usually used: hydrodynamically driven (Lee et al. 2006) sheath flows delivered by external pumps (e.g., syringe pumps) and electrokinetically driven (Yang et al. 2005) sheath flows generated by electrokinetic forces. An example to illustrate the principle of a common hydrodynamic sheath flow focusing device is given in Fig. 1-1. One or more sheath flows are fed via the side channels into a main channel to direct the main sample flow into a specific position within the channel as shown in Fig. 1-1. By adjusting the density, viscosity, and flow rate of the sheath flows with respect to the sample flow, this one can be focalized into the desired region with a controlled width (Lee et al. 2006). Here the width of the focused stream is in the same order of magnitude as the suspended cells or particles. Hence, the cells or particles are ordered and pass through the detection region one by one, which is suitable for cells/particles counting and sorting. Various designs of sheath flow focusing microsystem have been reported and recently reviewed (Huh et al. 2007; Xuan and Li 2005; Howell et al. 2008).
Fig. 1-1 Schematic drawing of symmetric sheath flow focusing (top view of microchannel): the sample flow supplied from the inlet channel at left is constrained laterally within the center of the microchannel by two neighboring sheath flows from the top and down side channels. (Reprinted from Lee et al. (2006).)
7
different widths and in various positions (Scott et al. 2008). Moreover, the focusing result is independent of the particles size, thus a same device can be used for a wide range of particles. Until now, this method is commonly used in most of the commercial flow cytometers where the width of the focused stream is of the same order of magnitude as the cell size.
However, some disadvantages can be emphasized. The need of accurately maintained sheath flows complicates the device fabrication, increases the cost and makes the miniaturization difficult. Furthermore, the addition of sheath flow leads to the dilution of the sample flow and sometimes to a modification of its properties. Finally, the high flow rates needed to pinch the particles could damage them in case of living bio-cells.
1.1.2 Sheathless flow focusing techniques
The sheathless flow focusing techniques manipulate the sample flow only relying on external or internal forces, without introduction of accompanying sheath flows in the channel. Thus the major advantage of sheathless flow focusing is avoiding the dilution of sample flow and the change of solution properties. The sheathless flow focusing can be classified into two types according to the nature of the force involved: active when the force is externally applied and passive when the force is internally induced.
1.1.2.1 Active sheathless flow focusing techniques
In active sheathless techniques, the sample suspension is subjected to a force that is often perpendicular to the direction of the flow, as shown in Fig. 1-2, to focus the particles in a well-defined location. Forces of different nature can be used, as for example electrical forces (Zhu et al. 2010; Voldman 2006; Gascoyne and Vykoukal 2002), acoustic radiation forces (Petersson et al. 2007), magnetic forces (Miltenyi et al. 1990; Liu et al. 2009) or even optical forces (Zhao et al. 2007). A recent review can be found in (Pamme 2007).
8
Fig. 1-2 Schematic of a typical active sheathless flow focuser. (Reprinted from Pamme (2007).)
Immunomagnetic separation (IMS) for example is an active sheathless flow technique commonly used for the separation of pathogenic organisms. The magnetic particles (MP), linked to specific antibodies, can be coupled to the target cells through antibody-antigen interactions forming MP-coated cells, and then removed from the suspension using a magnet (Hinds et al. 2003; Miltenyi et al. 1990; Liu et al. 2009). The main advantage of the magnetic actuation is that the magnetic field has no effect on biological samples that are usually diamagnetic, leading to excellent separation sensitivity.
Although these active microfluidic techniques are approved to be a successful biological application, the requirement of an outer force field increases the cost of fabrication, complicates the manipulation and decreases the throughput, thus giving an impediment to their widespread use.
1.1.2.2 Passive sheathless flow focusing techniques
Passive sheathless flow focusing techniques manipulate the particles without applying external forces, taking only advantage of the geometry of the microchannels and the hydrodynamic forces. These techniques involve mainly hydrophoresis (Choi and Park 2008), deterministic lateral displacement (Huang et al. 2004), gravitational methods (Huh et al. 2007) and inertial focusing (Di Carlo 2009).
9
illustrated in Fig. 1-3. The anisotropic fluidic resistance of the slanted obstacles generates a lateral pressure gradient which sets up a transverse flow. This secondary flow focuses particles depending on the size difference between the gap of the obstacle and the particle on specific positions (Choi and Park 2008; Choi et al. 2007).
Fig. 1-3 Cross-sectional schematic of the device for hydrophoretic separation. (Reprinted from Choi et al. (2012).)
Deterministic lateral displacement uses an array composed of aligned triangular or circular posts to guide particles. Columns of posts are slightly offset in the direction perpendicular to the flow direction, making the array axis tilted an angle with respect to the fluid flow, as shown in Fig. 1-4. The tilt angle determines a critical diameter above which the particles will pass along angled array axis (red dashed trajectory) and below which particles will go straight following their initial streamline (green dashed trajectory) (Devendra and Drazer 2012; Loutherback et al. 2010).
10
Fig. 1-4 Scheme of the Deterministic Lateral Displacement method. (Reprinted from Loutherback et al. (2010).)
Gravity-driven separation is based on the density difference between the particles and the carrier fluid. Although gravitational separation applies an external force field, it is considered passive because no other external active field is applied or modulated (Huh et al. 2007). Fig. 1-5 shows the gravity-driven device developed by Huh et al. (2007).
Fig. 1-5 Scheme of a gravity-driven separation device. (Reprinted from Huh et al. (2007).)
The particles are initially focused in the vertical direction and then are guided into a horizontal separation channel with gradually widening cross section where the flow velocity decreases and sedimentation starts to take effect. The sedimentation velocity of large particles is greater than that of small particles, resulting in a difference of vertical positions which makes it possible to separate the two particles.
11
the particles and the anisotropic geometry, can focus rapidly and in parallel a large number of different-sized particles. They present, however, a high risk of clogging because of the presence of obstacles and narrow gaps between them lead to high pressure drop across the device. Gravity can also be coupled to hydrodynamic flow (Huh et al. 2007), deterministic lateral displacement (Devendra and Drazer 2012) or acoustic field for particle separation (Petersson et al. 2007). But it is a mass-dependent sorting method, which cannot contribute to the manipulation of neutrally buoyant particles.
More recently, several sheathless passive focusing techniques based on differential inertial migration have been developed. Inertial microfluidic approach takes advantage of the regime of inertial fluid dynamics to focus suspended particles to predictable equilibrium positions within a microchannel. The inertial focusing rapidly expands due to the robust, simple, rapid, low-cost, and power-efficient operations involved (Di Carlo 2009). The last part of this chapter reviews the main works published in the literature in this field.
1.2 Phenomenon of inertial migration
Poiseuille (1836) was the first one to note the inhomogeneous radial distribution of blood corpuscles in capillary vessel. The corpuscles seemed to concentrate in an annulus close to the walls of the tube, indicating a lateral migration phenomenon.
These observations were quantitatively confirmed by the experiments of Segre and Silberberg (1962b) in the 1960s, whose work is considered as a milestone and triggered the interest of the scientific community in the inertial microfluidic field. They conducted experiments in a straight cylindrical tube (inner radius ~ 5.6 mm) with rigid particles (diameter ~ 1 mm) and observed that initially randomly dispersed particles were focused at a given distance from the channel inlet, on an annulus with a radius of about 0.6 times the tube radius, as shown in Fig. 1-6a. This phenomenon is known as the Segré–Silberberg effect or tubular pinch effect because of the tube-like shape of the annular region to which particles migrate (Segre and Silberberg 1962a). With the advancement in microfluidics, the observations of the same phenomenon have been
12
confirmed experimentally in microchannels in the recent years (Matas et al. 2004b).
Fig. 1-6 Tubular pinch effect. The left image shows the experimental results of Segre and Silberberg (1962b), showing how radial migration develops in a cylindrical tube along channel. (Reprinted from Segre and Silberberg (1962b).) The right image shows the experimental distribution of particles in the cross section of a cylindrical tube at Re = 350. (Reprinted from Matas et al. (2004c).)
Following the observations of Segre and Silberberg (1962b), many investigators tackled the problem of inertia-induced particle migration theoretically (Rubinow and Keller 1961; Saffman 1965; Schonberg and Hinch 1989; Asmolov 1999), numerically (Chun and Ladd 2006; Di Carlo et al. 2009; Abbas et al. 2014; Nakagawa et al. 2015) and experimentally (Bhagat et al. 2008a; Bhagat et al. 2008c; Choi et al. 2011; Kim and Yoo 2008; Di Carlo et al. 2007).
Particle migrations in straight cylindrical channel and square channel were reported by Di Carlo (Di Carlo 2009). The initially randomly distributed particles focused on an annulus (known as the Segré-Silberberg annulus) in a cylindrical channel (Fig. 1-7a) and on four equilibrium lines located near the center of each channel face in a square channel for moderate values of Reynolds number (Fig. 1-7b), built on the average flow velocity U and the channel hydraulic diameter
Dh:
/
h
Re=ρUD µ (1-1) where ρ is the fluid density, μ is the dynamic viscosity of fluid and Dh is defined as:
13 2 ( ) h HW D H W = + (1-2)
with H and W the channel height and width, respectively.
Fig. 1-7 Inertial focusing of particles in a cylindrical channel, a square channels and a rectangular channel, from left to right in the image, respectively. (Reprinted from Di Carlo (2009) and Amini et al. (2014).)
This result is however controversial: Bhagat et al. (2008c) experimentally and Chun and Ladd (2006) numerically proved that eight equilibrium positions coexist in square channels located at the four corners and near the four centers of each channel face.
It has been highlighted that the migration process takes place in two stages: the particles migrate first in the lateral direction forming a ring parallel to velocity iso-contours (pseudo Segré-Silberberg annulus) and then move cross-laterally toward the four equilibrium positions near the center of each channel face (Choi et al. 2011; Zhou and Papautsky 2013; Abbas et al. 2014). The second stage of migration, i.e., the cross-lateral migration, occurs only after that the first one is fully developed and is not significant at low Re (Abbas et al. 2014; Choi et al. 2011). Depending on the aspect ratio of the cross-section and on the flow Reynolds number Re, particles in rectangular microchannels focus to two equilibrium positions centered on the large face of the channel as shown in Fig. 1-8 (Zhou and Papautsky 2013). In a similar two-stage way, particles first migrate towards the walls then towards the centerlines of the walls.
14
Fig. 1-8 Schematic drawing of inertial focusing in a rectangular microchannel. (Reprinted from Zhou and Papautsky (2013).)
1.3 Mechanisms of inertial migration for neutrally buoyant
particles
Particles flowing in a microchannel are subjected to two types of forces: drag forces parallel to the flow and lift forces perpendicular to the flow. The drag forces act to accelerate the particles until they reach the fluid velocity and the lift forces related to viscosity and flow inertia carry the particles across the streamlines (Di Carlo 2009; Zhou and Papautsky 2013).
In straight channel flows, three primary lift forces contribute to the particle inertial lateral migration: a wall-induced lift force, a shear-induced lift force and a rotation-induced lift force (Zeng et al. 2009; Zhou and Papautsky 2013). In the case of a curved channel, a second-flow drag force must be taken into account (Martel and Toner 2013; Martel and Toner 2014). The balance of all the lift forces mentioned above will determine the migration process for a given channel flow.
The aim of this section is to present the different lift forces involved in the inertial migration process of neutrally buoyant particles.
15
1.3.1 Wall-induced lift force
A particle flowing through a microchannel interacts with the walls of the channel, unless the particle is extremely small or the wall is incredibly far away from the particle (Feng et al. 1994b; Matas et al. 2004c; Martel and Toner 2014). These interaction tends to repulse the particle away from the wall. A sample streamline schematic is shown in Fig. 1-9. With the introduction of a particle close to the wall, the streamlines are diverted towards the side of the particle away from the wall and, which results in accelerated streamlines there. This asymmetric streamlines cause an imbalance of pressure on two sides of the particle, which generates a repulsive force, as shown in Fig. 1-9 (Feng et al. 1994b; Martel and Toner 2014). This force increases inversely with the normalized particle-to-wall distance (Zeng et al. 2009).
Fig. 1-9 Wall-induced lift force.
Di Carlo et al. (2009) gave an empirical equation based on numerical simulations (COMSOL Multi-physics) for estimating the wall-induced lift force FW:
2 6 / 4 W W m p h
F =C U d Dρ (1-3)
where CW is a non-dimensional wall-induced lift coefficient, function of Reynolds number and
position, ρ is the fluid density, Um is the maximum flow velocity, dp is the particle diameter and Dh is the channel hydraulic diameter.
1.3.2 Shear-induced lift force
In the case of quadratic velocity (Poiseuille) flow, the particle experiences a force produced by the curvature of the velocity profile (Ho and Leal 1974; Feng et al. 1994b). In a flow with a
16
typical parabolic velocity profile, it is generally assumed that the mean velocity of the neutrally buoyant particle relative to the fluid is null. But the relative velocity in the reference frame of the particle is higher on the wall side than on the centerline side as shown in Fig. 1-10. This dissymmetry causes a lower pressure on the wall side of the particle, directing the particle towards the wall (in fact, towards the area with increasing shear gradient) (Feng et al. 1994b; Ho and Leal 1974; Matas et al. 2004c).
Fig. 1-10 Shear-induced lift force.
Di Carlo et al. (2009) also gave an empirical equation for the shear-induced lift force FS:
2 3 / S S m p h
F =C U d Dρ (1-4)
where CS represents a coefficient of shear-induced lift, depending strongly on the Reynolds
number and the particle position.
The balance of the shear-induced lift force and the wall-induced lift force successfully explains the first stage of inertial focusing in square and rectangular channel where the particles migrate towards the channel perimeter.
1.3.3 Rotation-induced lift force
The fact that in a square and rectangular channel, particles undergo a second stage of migration where they travel parallel to the walls towards to the centers of the four faces implies that an additional lift force takes place. According to Zhou and Papautsky (2013), a third lift force is
17
attributed to the rotation of the particles, known as Magnus effect. Indeed, the rotation of a sphere in a flow creates a reduced pressure at the side where the rotation tends to increase the velocity of the fluid, in consistence with the perfect fluid mechanism suggested by Bernoulli’s theorem (Feng et al. 1994b; Matas et al. 2004c). This imbalance in pressure causes a force as shown in Fig. 1-11.
Fig. 1-11 Rotation-induced lift force.
Rubinow and Keller (1961) gave an equation to estimate the rotation-induced force FΩ:
3
1 8 p
FΩ = π ρd Ω V × (1-5)
where Ω is its angular velocity vector and V is its relative velocity vector in the rest frame of the fluid. It acts against the flow velocity gradient in the direction of the center of the channel and its magnitude scales with the particle diameter cubed.
This rotation-induced lift force is negligible in comparison with the shear-induced lift force when the particles are far from the channel walls, i.e., during their first stage of migration (Loth and Dorgan 2009; Feng et al. 1994b) but becomes predominant in the wall region where the shear-induced and the wall-induced forces cancel each other, i.e., during their second stage of migration (Zhou and Papautsky 2013).
1.3.4 Secondary-flow drag force
18
secondary flows (known as Dean recirculation flows) perpendicular to the main flow direction can occur. These secondary flows impart a drag force FD (i.e., Strokes’ drag) on the particle due
to the difference between the particle velocity and the fluid velocity. This drag force is directed in the direction of the secondary flows (Martel and Toner 2013), as illustrated in Fig. 1-12.
Fig. 1-12 Secondary-flow drag force, i.e., Stokes’ drag.
In a Dean flow (a non-zero-Reynolds cured flow allows for a secondary flow), Zhang et al. (2016) utilized the Stokes’ drag equation to calculate the secondary-flow drag force FD:
3
D p SF
F = πµd U (1-6)
where USF is the secondary flow velocity.
1.4 Influence of channel, particle and fluid characteristics on
inertial focusing
The inertial focusing of particles in microfluidic devices strongly depends on the characteristics of the channel, the particles and the fluid (Di Carlo 2009). In this section a brief review of the literature dealing with the influence of these different parameters on the migration is presented.
1.4.1 Channel properties
Several physical parameters of straight channel that affect inertial focusing are mentioned in the literature and are reviewed here.
1.4.1.1 Channel length required for focusing to equilibrium positions