Publisher’s version / Version de l'éditeur:
Building and Environment, 79, pp. 168-180, 2014
READ THESE TERMS AND CONDITIONS CAREFULLY BEFORE USING THIS WEBSITE.
https://nrc-publications.canada.ca/eng/copyright
Vous avez des questions? Nous pouvons vous aider. Pour communiquer directement avec un auteur, consultez la
première page de la revue dans laquelle son article a été publié afin de trouver ses coordonnées. Si vous n’arrivez pas à les repérer, communiquez avec nous à PublicationsArchive-ArchivesPublications@nrc-cnrc.gc.ca.
Questions? Contact the NRC Publications Archive team at
PublicationsArchive-ArchivesPublications@nrc-cnrc.gc.ca. If you wish to email the authors directly, please see the first page of the publication for their contact information.
NRC Publications Archive
Archives des publications du CNRC
This publication could be one of several versions: author’s original, accepted manuscript or the publisher’s version. / La version de cette publication peut être l’une des suivantes : la version prépublication de l’auteur, la version acceptée du manuscrit ou la version de l’éditeur.
For the publisher’s version, please access the DOI link below./ Pour consulter la version de l’éditeur, utilisez le lien DOI ci-dessous.
https://doi.org/10.1016/j.buildenv.2014.05.009
Access and use of this website and the material on it are subject to the Terms and Conditions set forth at A preliminary ventilation rate determination methods study for residential buildings and offices based on VOC emission database
Ye, W.; Won, D.; Zhang, X.
https://publications-cnrc.canada.ca/fra/droits
L’accès à ce site Web et l’utilisation de son contenu sont assujettis aux conditions présentées dans le site LISEZ CES CONDITIONS ATTENTIVEMENT AVANT D’UTILISER CE SITE WEB.
NRC Publications Record / Notice d'Archives des publications de CNRC:
https://nrc-publications.canada.ca/eng/view/object/?id=6bfedaf5-5560-4c06-86ad-4c1f48402b07 https://publications-cnrc.canada.ca/fra/voir/objet/?id=6bfedaf5-5560-4c06-86ad-4c1f48402b07
A Preliminary Ventilation Rate Determination Methods Study for Residential Buildings and Offices Based on VOC Emission Database
Wei YE1,*, Doyun WON2and Xu ZHANG1
1School of Mechanical Engineering, Tongji University, Shanghai, P. R. China 2NRC Construction, National Research Council Canada, Ottawa, Ontario, Canada
*Corresponding email: weiye_hvac@outlook.com
Keywords: standard room, building material, characteristic emission, ACH, LCI HIGHLIGHTS
Two methods were proposed to determine ventilation rates for residences and offices The characteristic ventilation rate method could be over-estimating, but easy to apply The two-stage ventilation rate method produced more achievable ventilation rate
ABSTRACT
Ventilation is commonly used as a basic means to supply outdoor air to indoor environment to achieve better indoor air quality. To reduce harmful effect due to indoor pollutants such as formaldehyde and VOCs emitted from building materials, proper ventilation should be maintained to meet a minimum ventilation rate at least. Two new methods, i.e., characteristic and two-stage ventilation rate method, were proposed to predict ventilation rate based on building material emissions. Scenarios involving four standard rooms and different material loadings were analyzed to study adequate ventilation rates for residential buildings and offices. The study followed the IAQ procedure recommended by ASHRAE. The emission source data were from the National Research Council Canada (NRC) database. The building material emissions and consequent VOC concentrations were predicted by using two approaches called the characteristic emission rate method and the two-stage emission rate method. The ventilation rates were calculated for ten scenarios to meet the thresholds given by seven indoor air quality references. The results showed that the ventilation rate depended on the selection of reference standard, material and emission area. The dominating chemical substance in determining ventilation rate in various cases was not unique. The time to take for the emission to complete was 2.5–5 years for all cases. Due to the inherent nature of the characteristic emission rate method for over-estimating long-term emissions, replacing the characteristic ventilation rate with steady-state ventilation rate could lead to the ventilation rate requirement reduced by approximately half.
Nomenclature Symbols
a summation index (dimensionless)
Ai exposed surface area of the i-th building material (m2) Az the net occupiable floor area of the ventilation zone (m2) C0 initial material-phase emittable concentration (μg∙m-3)
C0,i,j initial material-phase emittable concentration for the j-th VOC in the i-th building material (μg∙m-3)
Cj individual concentration limit for j-th VOC (μg∙m-3) D material-phase diffusion coefficient (m2∙s-1)
Di,j material-phase diffusion coefficient of the j-th VOC emitted from i-th building
material (m2∙s-1)
,
ˆ
i j
E characteristic emission rate of the j-th VOC emitted from i-th building material (μg∙h-1)
j
E average emission rate of the j-th VOC during the unsteady-state stage (μg∙h-1)
, i j
E average emission rate of the j-th VOC emitted from i-th building material during the steady-state stage (μg∙h-1)
, ˆ
i j
F characteristic emission factor of the j-th VOC emitted from i-th building material (μg∙m-2∙h-1)
, i j
F average emission factor of the j-th VOC emitted from i-th building material during the steady-state stage (μg∙m-2∙h-1)
Fom mass transfer Fourier number, Fom= D∙t/L2(dimensionless)
Gi,j A lumped variable first used in Eq. (8) (μg∙s∙m-3)
Ij Lowest Concentration of Interest (LCI) value for the j-th VOC (μg∙m-3) K partition coefficient between the material and air for VOC (dimensionless) Ki,j partition coefficient between the material and air for the j-th VOC emitted from
i-th building material (dimensionless) L thickness of the building material (m) Li thickness of the i-th building material (m)
LRe envelope loading ratio, i.e., the ratio of the emission area of ceiling, floor and
LRf furniture loading ratio, i.e., the ratio of the emission area of furniture to the room
volume (m2·m-3)
m total number of the VOCs (dimensionless)
Mi,j total initial material-phase emittable mass of the j-th VOC in the i-th building
material (μg)
, [ m( )] i j
M Fo t total amount of the j-th VOC mass emitted from the i-th building material up to time t (μg)
n total number of the building materials that can emit one specific VOC (dimensionless)
N ventilation rate of the room (h-1)
Nj required ventilation rate for the j-th VOC (h-1) Pz number of people in the ventilation zone (person)
Q airflow rate in the experimental chamber for the building material emission test (m3·s-1)
Ra ventilation rate required per unit area (L·s-1·m-2)
Rj the ratio of gas-phase concentration to Lowest Concentration of Interest value
for the j-th VOC (dimensionless)
Rp ventilation rate required per person (L·s-1·person-1)
t emission time (s)
, i j
t unsteady-state stage emission time for the j-th VOC emitted from i-th building material (s)
, ˆi j
t characteristic emission time for the j-th VOC emitted from i-th building material (s)
j
t duration time of the unsteady-state stage emissions of the j-th VOC (s) V volume of the room (m3)
Vbz breathing zone ventilation rate (L·s-1)
yexp,i,j gas-phase concentration of the j-th VOC emitted from the i-th building material during the emission test (μg∙m-3)
, ˆi j
y characteristic gas-phase concentration of the j-th VOC emitted from the i-th building material (μg∙m-3)
ˆj
y overall characteristic gas-phase concentration of j-th VOC contributed from all the emission sources (μg∙m-3)
j
y overall gas-phase concentration of j-th VOC contributed from one dominating source during unsteady-state stage emissions (μg∙m-3)
j
y overall gas-phase concentration of j-th VOC contributed from all the emission sources during steady-state stage emissions (μg∙m-3)
Abbreviations
ACH air change rate per hour
AgBB German Committee for Health-Related Evaluation of Building Products ASHRAE American Society of Heating, Refrigerating and Air Conditioning Engineers ATSDR Agency for Toxic Substances and Disease Registry
BIFMA The Business and Institutional Furniture Manufacturer's Association Cal/EPA California Environmental Protection Agency
CAS No. Chemical Abstracts Service Registry Number CEN the European Committee for Standardization CREL chronic reference exposure level
CS California Specification
EU European Union
GB/T Chinese national recommendatory guideline GBZ Chinese national occupational hygiene standard HVAC heating, ventilation and air conditioning
IAQ indoor air quality
LCI Lowest Concentration of Interest MAC maximum allowable concentration MRL minimal risk level
NRC National Research Council Canada
OEHHA Office of Environmental Health Hazard Assessment PC-STEL permissible concentration-short term exposure limit PC-TWA permissible concentration-time weighted average RVR required ventilation rate
T&G Tongue and groove
1. INTRODUCTION
Building materials are a major source of formaldehyde and VOCs emissions, which are believed to have negative effects on occupants’ well-beings such as comfort, health, and productivity [1-5]. In addition to source control and air purification, ventilation is commonly applied to remove pollutants emitted from indoor sources, thereby reducing concentrations in spaces as well as exposure to the pollution [6, 7]. Ventilation is usually provided to buildings through natural, mechanical or hybrid (a combination of natural and mechanical) means. No matter what types of ventilation buildings incorporate, ventilation rates vary considerably within and among either residential or commercial buildings. HVAC design, installation, operation, maintenance, balancing, occupant density, air infiltration in building envelopes and economics are some of the factors that cause variability in ventilation rates [8-13]. To reduce harmful effects due to indoor pollution, proper ventilation should be maintained to meet a minimum ventilation rate at least [4].
Ventilation rate, which is also known as ACH or outdoor airflow requirement, is one of the most important indexes used in regulations on building ventilation. Yaglou proposed a method in 1930s to determine ventilation rate based on CO2 concentration, because human was considered to be the only source for indoor pollution at that time [14, 15]. This theory had a major influence in many ventilation regulations around the world to this point including China [16-18]. CEN member countries are still using this concept in their ventilation standard [19]. In the late 1980s, two units, the olf and the decipol, were introduced by Fanger to quantify air pollution sources and air pollution perceived by humans, and thus the ventilation requirements can be calculated [20, 21]. The problem associated with these two olfactory-based units is that it is too subjective to quantify pollution intensity and also it is impossible to quantify airborne pollution toxicity solely based on sense of smell.
Meanwhile, people started to notice the building materials as pollutant sources during energy crisis in 1970s. Efforts have been made to determine ventilation rate for buildings based on human pollution as well as building material emissions since then. In 1980s, the United States (ASHRAE 62) started to address building material related pollution when determining ventilation rates. At present, ASHRAE 62 specifies three procedures (the Ventilation Rate Procedure, the IAQ Procedure, and the Natural Ventilation Procedure) to determine the requirement of outdoor airflow into buildings [22]. The Ventilation Rate Procedure is commonly used because of its easiness in application. According to this procedure, the
breathing zone ventilation rate (Vbz) can be calculated by combining requirements for both
human and building material pollution (Vbz = Rp·Pz + Ra·Az). And the ventilation
requirements, Rp and Ra, are given by ASHRAE 62 for up to 78 occupancy categories of
spaces and, therefore, the Ventilation Rate Procedure is convenient for implementing in the US.
However, applying the concept of ASHRAE 62 directly to developing countries, such as China, can be challenging at least in two ways. First, not all of the occupancy categories that the standard identified can be applicable to other countries, considering most of the values of Rp and Ra are empirical [23]. Second, there might be significant differences in the type and
degree of pollutions produced by humans and materials between the US and other countries, e.g., China [24].
To avoid tackling Rp and Ra while taking both the human pollution and building material
emissions into account, one of the possible solutions is to divide all the building spaces into two categories, i.e., high-occupant-density spaces (theater, classroom, etc.) and low-occupant-density spaces (office, residential building, etc.). Yaglou’s theory can be applied to determine ventilation rate in high-occupant-density spaces since humans should be the dominating source of pollutions. For low-occupant-density spaces, we can determine ventilation rate based on building material emissions. China is currently taking this detour and has already set regulations for high-occupant-density spaces [25]. However, knowledge is still needed to determine ventilation rate for low-occupant-density spaces.
The objective of this paper is to propose methods to determine ventilation rate based on building material emissions alone. The application of this approach is illustrated by analyzing various scenarios using the concept of standard room and adopting indoor air quality references established from different perspectives. The proposed methods should be applicable to determine ventilation rate for the indoor environment where building materials are the dominant sources, e.g., low-occupant-density spaces such as residential buildings and offices. The determined ventilation rate should be evaluated for its applicability if it is applied to high-occupant-density spaces where building materials are not the dominant emission sources.
2. METHODOLOGIES
Typically there are three steps to estimate ventilation rate based on building material emissions: 1) identifying contaminant sources, 2) estimating emissions and concentrations and 3) determining the perceived indoor air quality. The key step of this process is estimating emissions to apply the mass balance concept. ASHRAE 62 summarizes this process as the IAQ Procedure [22]. Relatively it is not difficult to quantify ventilation rate for an experimental chamber if contaminant sources can be pre-determined and emissions can be measured. However, it is impossible to set the ventilation rate for every room this way due to numerous combinations of building materials. Therefore in this paper, imaginary scenarios were developed to design the required ventilation rate (RVR) for a broad range of residential buildings and offices.
2.1 Standard rooms and scenarios
A standard room is typically an office space, bedroom or living room with dimensions and furniture descriptions. If the loading ratio was defined, the emission area for the standard room would be known. Therefore, it is possible to determine ventilation requirement once the emission sources are defined. Based on this criterion, a bedroom and a living room in Beijing and a typical private office and an open office in the US were adopted as the standard rooms [26, 27]. Figure 1 shows the sketches of the four standard rooms. The difference between private office and open office is that private office has its own envelope (ceiling, floor and walls, as shown in Figure 1(c)), while open office has to share envelope with other open offices.
(c) private office * (d) open office Figure 1. Sketches of the four standard rooms [26, 27].
* An imaginary envelope was added to the provide office identified in Ref. [27]
The floor plan for all four rooms was assumed to be square and the configurations of four spaces are shown in Table 1. All four standard rooms have furniture, ceiling, floor and walls that can be emission sources. For convenience, the loading ratio is grouped to furniture (LRf)
and envelope loading ratio (LRe). All ceiling, floor and walls are lumped into envelope
loading ratio. However, all the surface areas of ceiling, floor and walls are not necessary to be emission sources. The LRf for each room in Table 1 was considered as the baseline value
and furtherer variations were made to the LRffor case study described below. While an actual
open office shares its envelope with other open offices, envelope loading ratio was included to simulate a small office (i.e., open office in Table 1), in comparison to a large office (i.e., private office in Table 1).
Table 1. Standard room configurations.
Item Bedroom Living room Private office Open office
Volume (m3) 42.9 57.2 65.2 16.3
Furniture loading ratio, LRf(m2∙m-3) 0.42 0.23 0.38 1.33
Envelope loading ratio, LRe(m2∙m-3) 1.75 1.62 1.54 2.38
Ceiling/flooring surface area (m2) 16.5 22.0 23.8 5.96
Wall surface area (m2) 42.2 48.8 53.1 26.8
Furniture surface area (m2) 18.0 13.2 24.8 21.7
Ten cases were designed to study on ventilation rate with varied emission sources in four standard rooms as shown in Table 2. The building materials were selected from the NRC database [28] and the NRC material IDs and descriptions are summarized in Table 3. Single and assembly materials, natural and synthetic materials were all included in the NRC database. Among ~50 building materials in the NRC database, 13 materials were selected
based on two criteria: 1) the selected material should be able to be considered solid, single-layer and roughly uniform; 2) only one typical material was selected from the same category, except for different usages (i.e., residential or commercial, and floor or furniture material). With two exceptions of natural materials (pine and oak), the majority of the materials in the database were synthetic, i.e., engineered products with adhesives, including acoustic ceiling tile, carpet, gypsum board, linoleum tile, medium-density fiberboard, plywood, oriented strand board, underpad and vinyl tile. Mixture indicates the combination of the two. Since only pine and oak are natural materials (Table 3), they were assumed to be applicable to ceiling and wall materials when it was necessary to simulate the exclusive usage of natural or synthetic materials.
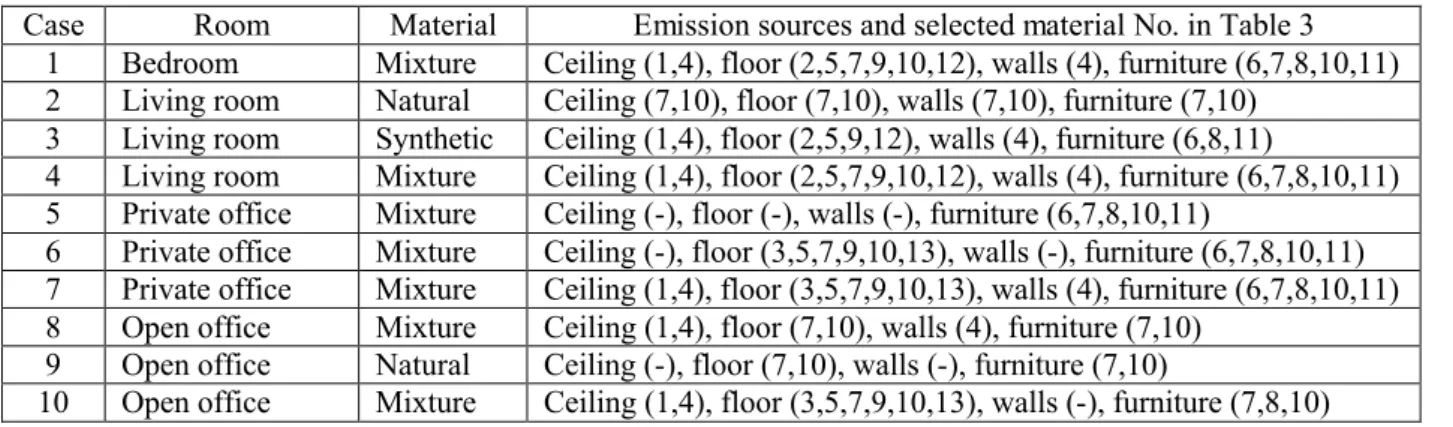
Table 2. Case scenarios for ventilation rate study.
Case Room Material Emission sources and selected material No. in Table 3 1 Bedroom Mixture Ceiling (1,4), floor (2,5,7,9,10,12), walls (4), furniture (6,7,8,10,11) 2 Living room Natural Ceiling (7,10), floor (7,10), walls (7,10), furniture (7,10)
3 Living room Synthetic Ceiling (1,4), floor (2,5,9,12), walls (4), furniture (6,8,11)
4 Living room Mixture Ceiling (1,4), floor (2,5,7,9,10,12), walls (4), furniture (6,7,8,10,11) 5 Private office Mixture Ceiling (-), floor (-), walls (-), furniture (6,7,8,10,11)
6 Private office Mixture Ceiling (-), floor (3,5,7,9,10,13), walls (-), furniture (6,7,8,10,11) 7 Private office Mixture Ceiling (1,4), floor (3,5,7,9,10,13), walls (4), furniture (6,7,8,10,11) 8 Open office Mixture Ceiling (1,4), floor (7,10), walls (4), furniture (7,10)
9 Open office Natural Ceiling (-), floor (7,10), walls (-), furniture (7,10)
10 Open office Mixture Ceiling (1,4), floor (3,5,7,9,10,13), walls (-), furniture (7,8,10) Table 3. Building material description and ID in NRC database
No. ID Description
1 ACT2 Acoustical ceiling tile (vinyl-coated fiberglass) 2 CRP1 Carpet (nylon, residential, latex backing) 3 CRP6 Carpet (nylon, commercial)
4 GB1 Gypsum wallboard (plain) 5 LIN1 Linoleum tile
6 MDF2 Medium-density fiberboard (shelving) 7 OAK1 Solid red oak (unfinished)
8 OSB1 Oriented strand board (wafferboard, aspen/poplar, resin: phenolic powder) 9 OSB4 Oriented strand board (T&G sub-floor)
10 PIN1 Solid pine
11 PLY2 Plywood (sheathing)
12 UP1 Underpad (foam chip, residential) 13 VIN2 Vinyl tile (commercial)
Because the four standard rooms represent residential and office buildings, the building material selections have to be general enough to obtain the representative ventilation rate for these two spaces. For this purpose, multiple materials were applied to the same location (i.e.,
ceiling, floor, walls or furniture). At each location, all the selected materials were equally divided up the total surface area to have the same weight in terms of emission area.
2.2 Determine contaminant emissions and concentrations
The emission sources need to be expressed with mathematical equations to be included in the calculation process. More than 40 analytical or semi-analytical mass-transfer emissions models have been developed during the past two decades [29]. VOC emissions from solid materials are typically controlled by internal diffusion. Therefore, the most widely used model is the concept of diffusion-controlled VOC emissions, whose three key parameters are
D, K and C0. Estimating key parameters from experimental data is an “inverse problem”.
Consequently, most of the methods to obtain key parameters mathematically or experimentally are not applicable if the test was not designed specifically for each method. One example of the non-pre-designed tests is the test conducted for the NRC database.
Recently a rapid method was proposed to estimate D and C0 with such data sets and,
ultimately, screening-level indoor exposure to VOCs emitted from building materials [30]. By taking two steps of this rapid method, the NRC database was used to estimate indoor exposure to VOCs. The first step was estimating D and C0for various VOCs emitted from 13 building materials. Since K does not affect long-term emissions [31], it was ignored. The second step was estimating gas-phase VOC concentrations from D and C0 by using a characteristic emission rate method. While the details of first step are beyond the scope of this paper, a brief description of the second step is given below.
2.2.1 Characteristic emission rate method
For simplification, the dimensionless mass transfer Fourier number Fomwas introduced as Eq. (1) [32]. , m 2 i j i D t Fo L (1)
Fomcan be used to characterize the mass transfer process and Fom= 2.0 can be considered as the criterion when the emission is approximately completed [32]. It is common to have multiple emission sources. Therefore, for the j-th VOC emitted from i-th building material, we can assume the characteristic emission time as
2 2 m , , , 2.0 ˆ i i i j i j i j Fo L L t D D (2)
Then, the corresponding characteristic emission rate and characteristic emission factor are given by , 0, , 0 , , , , 2 , , 3600 3600 ˆ = 1800 ˆ 2 i j i j i i i j i j i i j i j i i j i M C L A C D A E t L D L (3a) , 0 , , , , ˆ ˆ =i j i j 1800 i j i j i i E C D F A L (3b)
If both Di,j and C0,i,j are known and Li is measured, the characteristic emission factor (Fˆi j, )
and characteristic emission time (tˆi j, ) can be obtained directly.
Then assuming the indoor VOC concentration is well-mixed in a room, the characteristic gas-phase VOC concentration attributed to the j-th VOC emitted from the i-th building material in the indoor environment can be determined by Eq. (4).
, 0, , , , ˆ 1800 ˆ i j i i j i j i i j i F A C D A y V N V N L (4)
Considering the negligible effect of K on the long-term emission behavior [31], it is reasonable to simplify the characteristic emission factor as Eq. (3) with the assumption that Ki,jcan be ignored, i.e., Ki,j is equal to 1. So the overall gas-phase concentration of j-th VOC
that contributed from all the possible emission sources can be added up as Eq. (5).
0, , , , 1 1 1800 ˆ ˆ , 1, 2,..., n n i j i j i j i j i i i C D A y y j m V N L
(5)2.2.2 Two-stage emission rate method
The indoor VOC concentrations and the exposures estimated by the characteristic emission rate method could be over-estimated in terms of long-term VOC exposure prediction. The opposite could be true for short-term emissions. This is because the characteristic emission rate represents the lifetime average emission to some extent. In addition to the fact that Fom= 2.0 can be considered as the time when emissions are approximately completed [32], Fom = 0.2 can be recognized as the point that VOC emissions change from unsteady-state stage to
steady-state stage [33]. Figure 2 shows an example of two-stage emissions from a typical building material.
Figure 2. Diagram of the two-stage emissions from a typical building material.
As a result, building materials would emit VOCs at steady-state in 90% of the time (0.2 < Fom ≤ 2.0) and the long-term emission rate would be lower than the characteristic emission rate. Therefore, a two-stage emission rate method was proposed as follows.
As Deng et al. explained [34], by analyzing the analytical solution for VOC emissions from multiple sources/sinks coexisting in buildings, the effect of K on emissions cannot be ignored in multi-source emission scenarios at unsteady-state stage. Although Deng et al. didn’t point out directly, all the evidences suggest that one material would likely dominate the emission process of a specific VOC among all the coexisting materials if the material was the dominant source of the VOC during the unsteady-state stage emissions. In other words, the multi-source emission characteristics during unsteady-state stage could be roughly estimated by substituting the overall gas-phase VOC concentration profile contributed from all the emission sources with the VOC concentration profile attributed to the one specific material that has the maximum average emission rate among all the emission sources when emitting alone. And the duration of the unsteady-state stage could also be determined by the duration of that specific material.
Thus the average emission rate of the j-th VOC during unsteady-state stage could be determined as m ( 0.2) exp, 0 , 3600 max t Fo ( )d( ) , 1, 2,..., j i j i j Q E y t t i n t
, (6)where ti j, is given by 2 2 2 m , , , , 0.2 , 1, 2,..., ; 1, 2,..., m 5 i i i i j i j i j i j Fo L L L t i n j D D D (7) Let ( m 0.2) , 0 exp, ( )d( ) t Fo i j i j
G
y , t t , then the overall gas-phase concentration of j-th VOC during unsteady-state stage can be determined by, , 2 18000 max , 1, 2,..., , 1, 2, ..., j i j i j j i E Q D G y i n j m V N V N L (8)
It needs to be pointed out that the interpolation method could be taken in the integration of Eq. (6) to determine gas-phase VOC concentration when Fom= 0.2 [30].
At steady-state stage, the VOC emission can be predicted by a long-term emission model [31]. The model can be described as
2 , m 2 m 2 0 , [ ( )] 2 1 exp 0.5 ( ) 0.5 i j a i j M Fo t n Fo t M a
(9)The average emission rate and emission factor at steady-state stage can be given by
, , , , , 3600 (2.0) (0.2) ˆ i j i j i j i j i j M M E t t (10a) , , i j i j i E F A (10b)
Since Ki,j can be ignored at steady-state stage, the overall gas-phase concentration of the j-th
VOC contributed from all the possible emission sources can be added up as Eq. (11).
, , , , 2 1 1 (2.0) (0.2) 2000 , 1, 2,..., n n i j i j i j i j i j i i i M M D F A y j m V N V N L
(11)The duration of the steady-state stage could be determined by the duration of the emitted VOC that lasts the longest.
2.3 Indoor air quality thresholds
Seven indoor air quality references (see Table 4) established from different perspectives were selected to determine the acceptability of indoor air quality. GB/T 18883 [35], CRELs [36], CS 01350 [37] and ATSDR [38, 39] offer limit values for individual gas-phase VOC concentration. Because regulations on ventilation rate are focusing on long-term VOC emissions to some extent, chronic exposure limits were taken as the maximum allowable VOC concentrations if both short-term and long-term limits exist within one IAQ reference. Among those individual-style references, GB/T 18883 [35] is the current indoor air quality standard in China and has the smallest number of VOC concentration limits, with regulation on five VOCs and TVOC only. Two more publicly-available health references, CRELs [36] and ATSDR [38], were chosen for the relatively stringent limits on formaldehyde concentration in air. Furthermore, CRELs and ATSDR have 24 and 16 compounds that are common to the NRC database. Thus more diverse individual VOC concentration limits can be evaluated for adequate ventilation rate in various scenarios. CS 01350 [37] was also chosen because it represents one of the current building material emission standards in US and the VOC limits are one-half the corresponding CRELs except for formaldehyde.
On the other hand, to make an evaluation based on multiple substances, AgBB provides a different method via summing individual substances divided by a reference level [40]. For the evaluation of each VOC, the ratio Rjis established as defined in Eq. (12)
, 1, 2,..., j j j y R j m I (12)
The reference level is termed as LCI value, which is typically obtained by dividing occupational exposure limits by a safety factor (100 or 1000). The sum of all Rj shall not
exceed the value of 1 as Eq. (13)
1 1 m j j R
(13)This LCI concept has been widely developed and practiced in European countries since 1997. EU started to establish a harmonized list of LCI values in 2007. A list of interim EU-LCI values for 82 compounds has been published in 2013, and another 95 compounds are still to be derived [41]. Although EU-LCI represents the current development of LCIs, AgBB still covers more VOCs than EU-LCI does. Thus, both AgBB and EU-LCI were adopted as
indoor concentration references to provide comparison with individual-style references in terms of determining ventilation rates.
Also, to compare with AgBB and EU-LCI, the Chinese occupational exposure limits standard GBZ 2.1 [42] was processed in the same way as AgBB in this paper, although originally GBZ 2.1 was not designed for implementing the LCI concept. The PC-STEL values of GBZ 2.1 were divided by 100 to generate LCIs.
Table 4. Selection and description of indoor air quality references.
No. Standard Style Published year Description common to NRC databaseNumber of compounds
1 GB/T 18883
Individual
2002 Chinese indoor air quality standard, including permissible mean concentration of 1 h for 5
VOCs and of 8 h for TVOC 4
2 CS 01350 2010 MACs for 35 target VOCs and the values are one-half the corresponding CRELs except for
formaldehyde 24
3 CRELs 2013 Acute (1 h), 8 h and chronic reference exposure levels for 100 air pollutions and
published by Cal/EPA OEHHA, USA 24
4 ATSDR 2013 About 400 hazardous agents’ MRLs and published by ATSDR, USA 16
5 GBZ 2.1
Composite (LCI)
2007
Chinese occupational exposure limits for 346 hazardous agents in workplace, including 3 types of limits, TWA (8 h a day), PC-STEL (15 min) and MAC
34 6 AgBB 2012 Lowest Concentration of Interest values for 176 compounds, Germany 59
7 EU-LCI 2013 Lowest Concentration of Interest values for 82 compounds, EU 32
2.4 Ventilation rate calculation methods 2.4.1 Characteristic ventilation rate method
For an imaginary scenario with multiple building materials, the required ventilation rate to meet an individual-style guideline value for the j-th VOC could be calculated by Eq. (14).
, 0, , , 1 1 ˆ 1800 , 1, 2,..., n i j i n i j i j i i j i j j i F A C D A N j m C V C V L
(14)Therefore, the ultimate ventilation rate could be given as Eq. (15), assuming that outdoor air has the identical capacity to dilute different VOCs.
max{ },j 1, 2,...,
For composite-style limits that provide combined effects of all VOCs emitted, the required ventilation rate can be calculated as Eq. (16) after plugging Eq. (5) into Eq. (13).
, 1 1 1 m 1 n ˆ i j i j j i N F A V I
(16)Therefore, the minimum ventilation rate based on composite-style VOC concentration limits is given by Eq. (17). , 1 1 1 m 1 n ˆ i j i j j i N F A V I
(17)2.4.2 Two-stage ventilation rate method
The derivation process of the required ventilation rate for two-stage ventilation rate method is similar to characteristic ventilation rate method. For simplicity, Table 5 summarizes the required ventilation rate calculation methods for both individual and composite-style methods.
Table 5. Required ventilation rate calculation methods.
Based on individual-style VOC limits Based on composite-style VOC limits Characteristic ventilation rate 0, , , 1 1800 max n i j i j i , 1, 2,..., i j i C D A N j m C V L
Eq. (18) 0, , , 1 1 1800 m 1 n i j i j i j j i i C D A N V I L
Eq. (19) Unsteady-state stage ventilation rate , , 2 18000 max max , 1, 2,..., , 1, 2,..., i j i j j i D G Q N i n C V L j m Eq. (20) , , 2 1 18000 1 max , 1, 2,..., m i j i j j j i D G Q N i n V I L
Eq. (21) Steady-state stage ventilation rate , , , 2 1 (2.0) (0.2) 2000 max , 1, 2,..., n i j i j i j i j i D M M N C V L j m
Eq. (22) , , , 2 1 1 (2.0) (0.2) 2000 m 1 n i j i j i j j j i i D M M N V I L
Eq. (23)3. RESULTS AND DISCUSSION
3.1 Case study by using characteristic ventilation rate method 3.1.1 Effects of selected references
By applying the characteristic ventilation rate method (Eq. (5)) and assuming the ventilation rate was 1.0 h-1, the concentrations of 90 VOCs emitted from all the materials selected in Case
1 were calculated and 11 selected VOCs including TVOC are listed in Table 6 along with the corresponding limits from seven references. The concentration of VOCs ranged from 10-2to 103 μg∙m-3 and the limit values also varied among seven IAQ references. Among individual VOCs, α-pinene had the highest concentration, for which only AgBB and EU-LCI provide a limit value. And only GB/T 18883, AgBB and EU-LCI cover TVOC, with a caveat that TVOC is not included in the composite LCI calculation, but it is considered as an individual limit in AgBB and EU-LCI. All the individual limit references have a threshold for benzene, toluene and formaldehyde. The limits are relatively close to each other for toluene. For benzene and formaldehyde, the limit from GB/T 18883 is ten times higher than that in ATSDR. The variations observed in limit values in different references indicate that the RVR would be different for different references. It should also be pointed out that none of the references have limit values for a total of 28 VOCs detected in Case 1. Camphene is shown in Table 6 as an example. Except for formaldehyde, the concentrations of all compounds are below limit values. This indicates that formaldehyde can be the determinant for RVR, which should be bigger than 1.0 h-1used for simulation.
Table 6. Characteristic VOC concentrations and the corresponding limits from IAQ references in Case 1 (μg∙m-3).
CAS No. VOC Concentration Individual-style references Composite-style references GB/T 18883 CS 01350 CRELs ATSDR GBZ 2.1 AgBB EU-LCI 79-20-9 Methyl acetate 0.006 2000 79-01-6 Trichloroethylene 0.1 300 600 2.2 300 71-43-2 Benzene 0.3 110 30 60 9.5 60 108-88-3 Toluene 1.5 200 150 300 301 500 1900 2900 108-95-2 Phenol 4.0 100 200 100 10 75-07-0 Acetaldehyde 6.2 70 140 1200 50-00-0 Formaldehyde 16.5 100 16 9 10 79-92-5 Camphene 53.6 64-19-7 Acetic acid 62.2 100 500 80-56-8 α-pinene 241.6 1500 2500 - TVOC 539.7 600 1000 1000
3.1.2 Effects of material selection and loading ratio
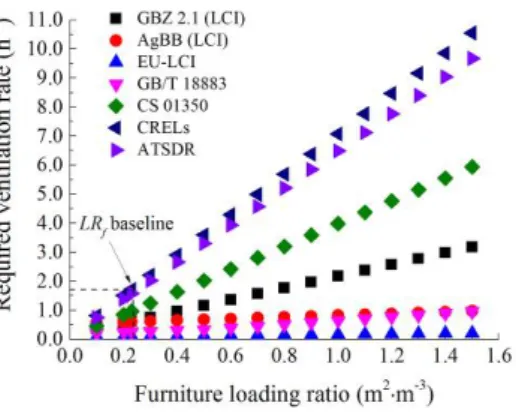
The effect of material categories on ventilation rates were investigated by performing calculation for Case 2, 3 and 4 and the results are shown in Figure 3. The RVRs were determined by the characteristic ventilation rate method (Eqs. (15) and (17)).
At a particular LRf level, the highest RVR should be of interest in terms of health concerns.
respectively. The highest RVR at baseline of Case 2 was higher than those in Case 3 and 4. This is because Case 2 is an extreme scenario, involving exclusive usage of natural materials in residential buildings. That is, pine and oak were applied to all the possible indoor emission area, leading to high levels of biogenic VOCs such as α-pinene, β-pinene and limonene, and, consequently, high levels of TVOC. Among seven IAQ references, only AgBB and EU-LCI cover both TVOC and some of critical biogenic VOCs and, thus, led to a relatively high RVR. However, the highest RVR in Case 2 was determined by TVOC concentration limit imposed by GB/T 18883. The highest RVR at baseline in Case 2 was tripled or even quadrupled compared to the corresponding RVR in Case 3 and 4, in which synthetic materials were present. Therefore, caution should be taken when determining RVR for a “wooden house” similar to Case 2.
(a) Case 2: natural materials (b) Case 3: synthetic materials
(c) Case 4: mixture materials
Figure 3. The effect of material categories on ventilation rates.
When LRf was increased to 1.5 from 0.23 m2∙m-3, the highest RVR increased to ~10.6 h-1 for
Case 3. The reason is that some synthetic materials, such as medium-density fiberboard, could release formaldehyde at high emission rates and those references, e.g., CRELs, ASTDR and CS 01350, that specified indoor formaldehyde concentrations at low levels could result in
high RVRs. Due to the fact that both natural and synthetic materials were added into the scenarios, the RVRs in Case 4 were slightly lower than those in Case 3 for CRELs, ASTDR and CS 01350.
Overall, for given material selection, both the furniture loading ratio (LRf) and selection of
IAQ references had significant impacts on the ventilation rate determination. Since GB/T 18883 has less stringent VOC limit values than other individual-style references, it has a relatively flat trend with increasing LRf in Figure 3. Because the results are averaged over
various VOCs in AgBB and EU-LCI, the composite-style references could be less influenced by an extreme value and, therefore, could be less likely to be sensitive to changes in LRf. This
is reflected in the trends of AgBB and EU-LCI that are relatively flat in Case 2, 3 and 4. This indicates that the composite-style references are likely to be more tolerant to variations in simulation variables including LRf, but also may not be ideal for providing protection against
one of the most health-relevant VOCs. For example, formaldehyde is not included in both AgBB and the newly published EU-LCI, although it is recognized as the determinant for the ventilation requirement based on the individual-style references. It is strongly recommended that substances such as formaldehyde with well-known toxicity and a strict exposure limit need to be included in future composite-style references.
Additionally, LCI concept is currently popular only in Europe. Similar work could also be done in developing countries, such as China. It was demonstrated that GBZ 2.1 could be considered as a potential source for LCIs and used to determine ventilation rate in China.
3.1.3 Effects of emission area
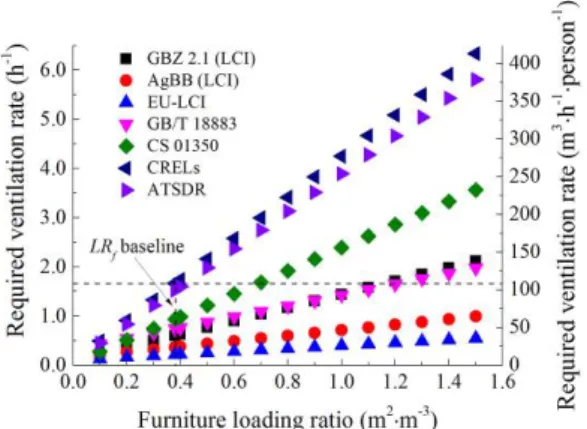
Three cases (Case 5, 6 and 7) with mixture of materials were designed with a main purpose of investigating the effect of emission area on ventilation rates (Figure 4). The RVRs in Figure 4 were again determined by characteristic ventilation rate method. Since it is conventional to express ventilation rate in offices based on the number of occupants, a secondary unit (m3 h-1 person-1) is added to Figure 4.
(a) Case 5: emission area: furniture (b) Case 6: emission area: furniture and floor
(c) Case 7: emission area: furniture and entire envelope
Figure 4. The effect of emission areas on ventilation rates.
Case 5 represents the scenario that the furniture was the only emission source. By assuming that the private office had one occupant, the highest RVR was about 1.6 h-1 or 103 m3·h -1·person-1 when LR
f was at baseline for Case 5. Throughout the history, the RVR for office
spaces ranged from 7.2 m3·h-1·person-1to 51 m3·h-1·person-1and the current RVR for office in China and US is about 30 m3·h-1·person-1[22, 25, 43]. Despite the fact that the loading ratio of materials in the private office was small, low formaldehyde concentration limits specified by CRELs and ATSDR were the main reason for high RVR. If we take GB/T 18883 as the reference guideline, the RVR would be about 30 m3·h-1·person-1.
Compared to Case 5, Case 6 had one more emission area (i.e., floor), sources of which emitted formaldehyde. However, the highest RVR for the baseline case of Case 6 was about 1.7 h-1, which is similar to that of Case 5. The small differences between the highest RVR of Case 5 and 6 suggest that the highest RVR determination was dominated by furniture rather than floor. Similar observation can be made if we take Case 7 into account. Case 7 has the largest emission area among Case 5, 6 and 7. However, because the material applied in
ceiling and walls didn’t emit formaldehyde, the highest RVR was determined by floor and furniture. Thus the result of Case 7 was the same as that of Case 6. Based on the results of Cases 5–7, it can be concluded that increased surface areas won’t necessarily lead to increased ventilation requirements. This is because material selection and type of VOCs emitted can be the influencing factor.
Figure 5. The variation of material selection on ventilation rates.
To illustrate the point, further variation was made to the material selection of Case 5. Each one of original materials selected for Case 5 was assumed to be the sole material applied in the same scenario when LRf was at baseline (Figure 5). Apparently, natural materials were
not always better than synthetic materials. With oak, oriented strand board or plywood as the only material for furniture, the highest RVR were below 0.5 h-1. With pine or medium-density fiberboard, the RVR would be 1.7 h-1 and 7.9 h-1 determined by TVOC and formaldehyde, respectively.
3.1.4 Type of VOCs determining ventilation rate
Table 7 summarizes the leading substance that played a dominant role in determining ventilation rate requirement for individual-style IAQ references in Case 8, 9 and 10. The maximum Rjfor composite-style IAQ references are also included in Table 7.
Table 7. The leading substance to determine ventilation rate.
Standard Case 8 Case 9 Case 10
GBZ 2.1 (LCI) acetic acid acetic acid acetic acid
AgBB (LCI) phenol α-pinene α-pinene
EU-LCI α-pinene α-pinene α-pinene
CS 01350 formaldehyde benzene acetaldehyde
CRELs formaldehyde benzene formaldehyde
ATSDR formaldehyde benzene trichloroethylene
Interestingly, eight different VOCs including TVOC were recognized as the leading substance. Because CRELs and ATSDR have strict regulation on formaldehyde, it is reasonable to see formaldehyde was identified as the dominating factor in Case 8 and Case 10, where synthetic materials were present. However, when natural materials were the dominating emission sources, the leading substance varied among different VOC limit references and cases. This example shows that it may not be advisable to set one VOC as the indicator to determine ventilation rate. More diverse VOCs can play a role in determining ventilation rate, leading to complications in practice. First, the number of candidate VOCs could be huge considering the numerous materials containing VOCs. Second, there are many VOCs that could be emitted at high concentration levels without a reference limit recognized in any references. Besides, there is no consensus on how to determine VOC concentration reference levels.
3.2 Case study by using two-stage ventilation rate method
As mentioned previously, the two-stage ventilation rate method was introduced to mitigate the potential over-estimation by the characteristic ventilation rate method. Since the results obtained from comparing the effects of material selections, emission areas and IAQ references on ventilation requirements were similar to those by the characteristic ventilation rate method, the results that can highlight the unique features of the two-stage ventilation rate method are presented. One of the key points of the two-stage ventilation rate method is dividing the emission time into unsteady- and steady-state. Figure 6 shows the time divisions, including unsteady- and steady-state, and overall emission time for Case 1–10 when LRf was
Figure 6. The emission time for 10 cases predicted by the two-stage ventilation rate method. The overall emission time ranged from ~2.5 to 5 years for all ten cases, while the unsteady-state emission time was from 3 to 5 months. It should be pointed out that, according to Eq. (2) and Eq. (7), the material thickness has significant impacts on emission time, emission rate, and, ultimately, ventilation rate requirement. In this paper, thicknesses of all the selected materials were the same to those reported in the NRC database. If different thicknesses are employed, the magnitude of the results would be different, but not the overall trends.
0 500 1000 1500 2000 0.0 1.0 2.0 3.0 4.0 5.0 6.0 R eq ui re d ve nt ila ti on r at e (h -1 ) Emission days Characteristic ventilation rate Two-stage ventilation rate
0 500 1000 1500 2000 0.0 0.5 1.0 1.5 2.0 2.5 3.0 3.5 4.0 R eq ui re d ve nt il at io n ra te ( h -1 ) Emission days Characteristic ventilation rate Two-stage ventilation rate
(a) Case 1: bedroom (b) Case 4: living room
0 500 1000 1500 2000 0.0 1.0 2.0 3.0 4.0 5.0 6.0 R eq ui re d ve nt il at io n ra te ( h -1 ) Emission days Characteristic ventilation rate Two-stage ventilation rate
0 50 100 150 200 250 300 350 R eq ui re d ve nt il at io n ra te ( m 3 h -1 p er so n -1 ) 0 500 1000 1500 2000 0.0 2.0 4.0 6.0 8.0 10.0 12.0 14.0 16.0 18.0 20.0 R eq ui re d ve nt il at io n ra te ( h -1 ) Emission days Characteristic ventilation rate Two-stage ventilation rate
0 50 100 150 200 250 300 R eq ui re d ve nt ila tio n ra te ( m 3 h -1 p er so n -1 )
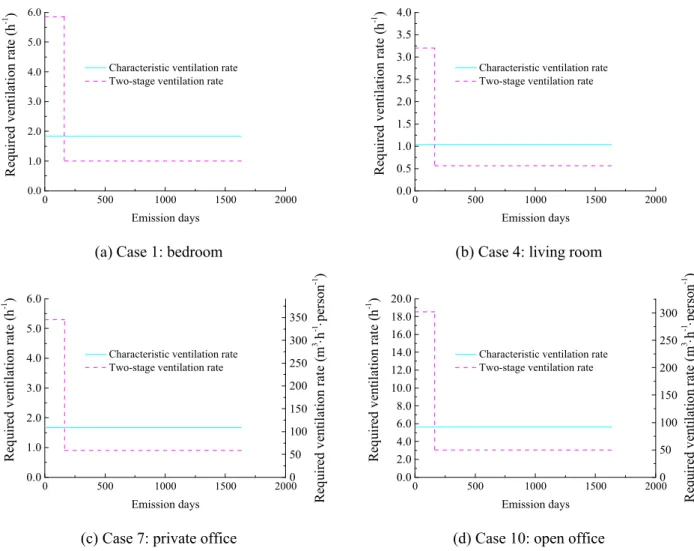
(c) Case 7: private office (d) Case 10: open office Figure 7. The comparison of RVR determination by two methods.
Figure 7 compares the highest RVRs determined by characteristic ventilation rate method and two-stage ventilation rate method for typical scenarios of four standard rooms (i.e., Case 1, 4, 7 and 10) when LRf was at baseline for each case. All these ventilation rates were calculated
As predicted, the characteristic ventilation rate lies between the unstate and steady-state ventilation rate for all four standard rooms. The characteristic ventilation rates were 1.8 h-1, 1.0 h-1, 1.7 h-1 (108 m3·h-1·person-1) and 5.6 h-1 (92 m3·h-1·person-1) for bedroom, living room, private office and open office (revised to small-space private office with full envelope), respectively. The ventilation rates could be reduced by approximately half to 1.0 h-1, 0.6 h-1, 0.9 h-1 (59 m3·h-1·person-1) and 3.1 h-1 (51 m3·h-1·person-1) for each room for 90% of the emission time by using the steady-state ventilation rate. Comparing the ventilations by two methods presents an example of the uncertainty that can be involved in determining the ventilation rate averaged over the lifetime of materials. The decreased ventilation rate for the steady-state period, determined by the two-stage method, may imply that dividing the emission time further (e.g., dividing the steady-state period into two stages) would lead to further decrease in the ventilation rate. However, the decrease is not expected to be significant since the concentration decreases within the steady-state stage are much smaller than those between the unsteady-state and steady-state period [32, 44].
The reason that the ventilation rate of bedroom (Case 1) was higher than the one of the living room (Case 4) is mainly because LRfof the bedroom is greater. In terms of Case 7 and 10, the
two office spaces represent large-space office and small-space office, respectively. And the ventilation rates could be generally considered 50 m3·h-1·person-1for both cases.
Although the RVRs for unsteady-state emissions would be much higher than the ones for steady-state emissions, people may not be subject to such high ventilation requirements since it typically takes several months before a newly-built house or office is occupied. As shown in Figure 7, the energy penalty due to high ventilation requirement can be avoided by occupying the space after a certain period of time. For immediate occupancy after renovation or introduction of furniture, other control measures such as use of air cleaning devices is likely to be less costly than mechanical ventilation.
Both ventilation rate determination methods have advantages and disadvantages and Figure 7 illustrates the strength of each method. That is, while the “once for all” characteristic ventilation rate method is easier to apply, the two-stage ventilation rate method needs more calculation steps for both unsteady- and steady-state ventilation rates along with the time division. The steady-state ventilation rate could be only half of the characteristic ventilation rate and, thus, has the potential for preventing over-ventilation and promoting energy saving.
However, it should be pointed out that the over-ventilation issue associated with the characteristic ventilation rate method should not be considered negatively in terms of long-term health concerns for occupants. First, over-ventilation means lowering the gas-phase VOC concentration further and providing a safety margin for occupants’ heath. Second, building materials are not the only emission sources in indoor environments. Ventilation is needed to dilute all the pollutants that are emitted from occupants and consumer products, in addition to building materials. Thus, the ventilation rate determined by the characteristic ventilation method may not be over-estimation in the first place and the ventilation rate predicted by the steady-state emission rate method could be under-estimation under certain circumstances.
3.3 Uncertainty analysis
This research presents the proof-of-concept for using material emissions data to determine ventilation rates. While the feasibility of the approach has been proven, it should also be acknowledged that there are at least four sources of uncertainties that can be associated with the determined ventilation rate: 1) the uncertainty in the NRC database; 2) the uncertainty in the rapid method to analyze the NRC database; 3) the uncertainty in the ventilation rate determination methods; and 4) the uncertainty from ignoring chemical reactions in indoor air. First, the uncertainty in the NRC database is most likely to be associated with the fact that the materials in the database cannot cover the entire spectrum of the materials on the current market. The under-representation of the database is worsened by the observation that the uncertainty in the emission data can also be caused by specimen variability even within one type of materials. For example, Magee et al. (2003) showed that the uncertainty in the VOC emissions from OSB specimens due to specimen variability (e.g., mill-to-mill differences, differences between production dates, and differences even within a single panel) can be much larger than that due to the experimental uncertainty involved in the testing and chemical analysis [45]. Therefore, measures to obtain more representative emission data that can cover a wide spectrum of building materials need to be addressed.
Second, the uncertainty can be associated with the rapid method employed in this paper to obtain C0 and D values from building material emission data. While the method has been validated by Ye et al. (2013) [30], the accuracy of the estimated C0and D needs to be further validated with independent experimental methods.
Third, the uncertainty is also associated with the ventilation determination methods that are based on averaging the emission rates over the entire emission period. The “over-ventilation” issue of the characteristic emission rate method has been discussed previously. And the unsteady-state emission rate and time that are screen-level estimations based on the multi-source/sink emission model [34] can also lead to the uncertainty to the two-stage emission rate method. The question on whether a material acts as a source or a sink can also complicate the analysis, in particular, for the short-term emissions. In the environment where a single source is dominant, less-dominant materials can act as sinks rather than sources, influencing the VOC concentration and, then, ventilation requirement. However, the sink effect is less likely to influence the VOC concentration from a long-term perspective since K rather than D influences whether a material is a source or a sink [34] and K has a negligible effect on long-term emissions [31]. In other words, the emittable VOC mass would eventually be emitted to indoor air in a long-term period even if it is temporarily retained by sinks. On the other hand, if the calculation method is mainly used to cover short-term emissions, the coexistence of multiple source/sink materials needs to be addressed in calculating the ventilation rate.
Fourth, VOCs in indoor air were assumed to be unreactive after they are emitted to indoor air. However, the chemical reactions between indoor air pollutants (e.g., reactions between ozone and terpenes) have widely been reported [46, 47]. If the chemical reaction aspect is taken into account, the required ventilation can be reduced since most of the leading VOCs (Table 7) are chemical reactants rather than products. On the other hand, ventilation may need to be increased to remove the chemical reaction products.
In summary, there are various uncertainties associated with the methods presented in this paper, for some of which no quick answers are readily available at this point. However, this research should be considered as a feasibility study on how to use screen-level methods for determining ventilation rate based on building material emissions in spite of these uncertainties.
4. CONCLUSIONS
By taking advantage of the NRC VOC emission database, a preliminary study on required ventilation rate (RVR) determination methods for residential buildings and offices was
conducted. The study followed three steps of the IAQ procedure recommended by ASHRAE [22]. Seven IAQ references were selected and can be grouped into two categories: 1) the individual-style references, which included GB/T 18883, CRELs, CS 01350 and ATSDR that were used to get thresholds for various individual substances; 2) the composite-style (LCI-style) references, including AgBB, EU-LCI and GBZ 2.1 that were used to apply the LCI concept to take into account most of the detected VOCs simultaneously. Ultimately, the RVRs were determined by the characteristic ventilation rate method and the two-stage ventilation rate method.
Based on four standard rooms (a bedroom and living room in Beijing, a private office and a standard open office in the US), ten cases were designed to calculate the RVR to meet the VOC threshold. The results showed that the RVR depended heavily on the selected reference due to the variations in limit values. Seven selected IAQ references cover different aspects of the exposure scenarios. Generally speaking, composite-style references tend to be less sensitive to variations in the simulation variables including loading ratio. For individual-style references, theoretically only one VOC would be the leading substance to determine ventilation rate. However, the leading substance in various cases is not unique and constant, suggesting that it is not recommended to consider only one VOC to determine ventilation rate. More efforts should be directed to developing VOC guideline values that are more diverse and can be universally acceptable.
The RVR also depended on material selections and emission areas. The RVR could be high for either natural or synthetic materials. For example, application of AgBB led to high RVR due to the high concentrations of biogenic VOCs emitted from natural materials. On the other hand, the strict concentration limits for formaldehyde in CS 01350, CRELs and ATSDR resulted in high RVR for synthetic building materials that typically contained phenol- or urea-formaldehyde resins. For a given material selection, increasing the loading ratio generally increased RVR. However, it was not always the case if the increased loading ratio was not related to the materials that emitted the most influencing VOC.
For now, although it is not rigorous to conclude, composite-style references have the advantage in the sense that they cover more VOCs and are more tolerant to variations such as furniture loading ratio and emission area. Therefore, they are more likely to recommended to determine ventilation rate for residential and office buildings than individual-style references.
However, the disadvantage of the current composite-style references is that those references tend to be less sensitive to compounds with extremely strict guideline values. While the role as the most influencing compound can be weakened due to the averaging effect of the LCI concept, it is strongly recommended that substances such as formaldehyde with well-known toxicity and a strict exposure limit need to be included in composite-style references.
Because the characteristic ventilation rate method could result in over-estimation in approximately 90% of the emission time, the two-stage ventilation rate method could be more appropriate to estimate steady-state ventilation rate. By replacing the characteristic ventilation rate with steady-state ventilation rate, the ventilation rates could be reduced by approximately half. The method also showed that the time to take for the emission to complete (i.e., emission time) ranged from ~2.5 to 5 years for all ten cases and unsteady-state emission time ranged from 3 to 5 months. This result indicates that the steady-state ventilation rate would be applicable after approximately half a year. Therefore, although the “once for all” characteristic ventilation rate method is easier to apply, the two-stage ventilation rate method is recommended in order to prevent over-ventilation. While these preliminary results require more rigorous validation for the actual application, this study proves the concept of using building material emissions in determining required ventilation rate in residential and office spaces.
ACKNOWLEDGMENT
The material emissions database by National Research Council Canada (NRC) is the outcome of two consortium projects, i.e., CMEIAQ I and II. The authors would like to thank the members of the consortiums and the technical advisory committees. The authors also thank China Scholarship Council (CSC) for financially supporting Wei Ye during his visit to Virginia Tech (No. 201206260034). Finally, the kind help from Dr. Baoqing Deng at University of Shanghai for Science and Technology is gratefully acknowledged.
REFERENCES
[1] Wolkoff P, Nielsen GD. Organic compounds in indoor air—their relevance for perceived indoor air quality? Atmospheric Environment. 2001;35:4407-17.
[2] Salthammer T, Mentese S, Marutzky R. Formaldehyde in the indoor environment. Chemical Reviews. 2010;110:2536-72.
[3] Nielsen G, Larsen S, Olsen O, Løvik M, Poulsen LK, Glue C, et al. Do indoor chemicals promote development of airway allergy? Indoor Air. 2007;17:236-55.
[4] Wargocki P. The Effects of Ventilation in Homes on Health. International Journal of Ventilation. 2013;12:101-18.
[5] Tsai D-H, Lin J-S, Chan C-C. Office workers’ sick building syndrome and indoor carbon dioxide concentrations. Journal of occupational and environmental hygiene. 2012;9:345-51. [6] Sundell J, Levin H, Nazaroff WW, Cain WS, Fisk WJ, Grimsrud DT, et al. Ventilation rates and health: multidisciplinary review of the scientific literature. Indoor Air. 2011;21:191-204.
[7] Awbi HB. Ventilation of buildings: Routledge; 2013.
[8] Seppänen O, Fisk WJ, Lei Q. Ventilation and performance in office work. Indoor air. 2006;16:28-36.
[9] Bluyssen PM, De Oliveira Fernandes E, Groes L, Clausen G, Fanger PO, Valbjørn O, et al. European indoor air quality audit project in 56 office buildings. Indoor Air. 1996;6:221-38. [10] Bekö G, Lund T, Nors F, Toftum J, Clausen G. Ventilation rates in the bedrooms of 500 Danish children. Building and Environment. 2010;45:2289-95.
[11] Brelih N, Seppänen O. Ventilation rates and IAQ in European standards and national regulations. The proceedings of the 32nd AIVC conference and 1st TightVent conference in Brussels2011. p. 12-3.
[12] McNeil S, Quaglia L, Bassett M, Overton G, Plagmann M, Cunningham M, et al. A survey of airtightness and ventilation rates in post 1994 NZ homes. AIVC 33rd Conference: Optimising Ventilative Cooling and Airtightness for [Nearly] Zero-Energy Buildings, IAQ and Comfort; 2012.
[13] Fisk WJ, Black D, Brunner G. Changing ventilation rates in US offices: Implications for health, work performance, energy, and associated economics. Building and environment. 2012;47:368-72.
[14] Yaglou CP, Riley EC, Coggins DI. Ventilation requirements. Trans ASHVE. 1936;42:133-62.
[15] Yaglou CP, Witheridge WN. Ventilation requirements (part 2). Trans ASHVE. 1937;43:423-36.
[16] Jankovic JT, Ihle R, Vick DO. Occupant generated carbon dioxide as a measure of dilution ventilation efficiency. American Industrial Hygiene Association Journal. 1996;57:756-9.
[17] Jokl MV. Evaluation of indoor air quality using the decibel concept based on carbon dioxide and TVOC. Building and Environment. 2000;35:677-97.
[18] Persily A, Dols WS. The relation of CO2 concentration to office building ventilation. Air Change Rate and Airtightness in Buildings, ASTM STP. 1990;1067:77-92.
[19] BSI. BS EN 13779:2007 Ventilation for non-residential buildings. Performance requirements for ventilation and room-conditioning systems. UK, BSI; 2007.
[20] Fanger PO. Introduction of the olf and the decipol units to quantify air pollution perceived by humans indoors and outdoors. Energy and buildings. 1988;12:1-6. [21] Fanger P. The new comfort equation for indoor air quality. ASHRAE journal. 1989;31:33-8.
[22] ASHRAE. ANSI/ASHRAE Standard 62.1-2013 Ventilation for Acceptable Indoor Air Quality. Atlanta, GA, USA, ASHRAE; 2013.
[23] Taylor ST. Determining ventilation rates-Revisions to standard 62-1989. ASHRAE Journal. 1996;February:52-8.
[24] Weschler CJ. Changes in indoor pollutants since the 1950s. Atmospheric Environment. 2009;43:153-69.
[25] MOHURD. GB 50736-2012 Code for design of heating ventilation and air conditioning. Beijing, China, China Architecture & Building Press; 2012.