Montreal University
Reconnaissance de L'émotion Thermique
Thermal Emotion Recognition
by Yang Fu
Department of Computer Science and Operations Research
Thesis Submitted for Master’s Degree in Computer Science
20 March 2017
Résumé
Pour améliorer les interactions homme-ordinateur dans les domaines de la santé, de l'e-learning et des jeux vidéos, de nombreux chercheurs ont étudié la reconnaissance des émotions à partir des signaux de texte, de parole, d'expression faciale, de détection d'émotion ou
d'électroencéphalographie (EEG). Parmi eux, la reconnaissance d'émotion à l'aide d'EEG a permis une précision satisfaisante. Cependant, le fait d'utiliser des dispositifs
d'électroencéphalographie limite la gamme des mouvements de l'utilisateur. Une méthode non envahissante est donc nécessaire pour faciliter la détection des émotions et ses applications. C'est pourquoi nous avons proposé d'utiliser une caméra thermique pour capturer les
changements de température de la peau, puis appliquer des algorithmes d'apprentissage machine pour classer les changements d'émotion en conséquence. Cette thèse contient deux études sur la détection d'émotion thermique avec la comparaison de la détection d'émotion basée sur EEG. L'un était de découvrir les profils de détection émotionnelle thermique en comparaison avec la technologie de détection d'émotion basée sur EEG; L'autre était de construire une application avec des algorithmes d'apprentissage en machine profonds pour visualiser la précision et la performance de la détection d'émotion thermique et basée sur EEG. Dans la première recherche, nous avons appliqué HMM dans la reconnaissance de l'émotion thermique, et après avoir comparé à la détection de l'émotion basée sur EEG, nous avons identifié les caractéristiques liées à l'émotion de la température de la peau en termes d'intensité et de rapidité. Dans la deuxième recherche, nous avons mis en place une application de
détection d'émotion qui supporte à la fois la détection d'émotion thermique et la détection d'émotion basée sur EEG en appliquant les méthodes d'apprentissage par machine profondes - Réseau Neuronal Convolutif (CNN) et Mémoire à long court-terme (LSTM). La précision de la détection d'émotion basée sur l'image thermique a atteint 52,59% et la précision de la détection basée sur l'EEG a atteint 67,05%. Dans une autre étude, nous allons faire plus de recherches sur l'ajustement des algorithmes d'apprentissage machine pour améliorer la précision de détection d'émotion thermique.
Abstract
To improve computer-human interactions in the areas of healthcare, e-learning and video games, many researchers have studied on recognizing emotions from text, speech, facial expressions, emotion detection, or electroencephalography (EEG) signals. Among them, emotion recognition using EEG has achieved satisfying accuracy. However, wearing electroencephalography devices limits the range of user movement, thus a noninvasive method is required to facilitate the emotion detection and its applications. That’s why we proposed using thermal camera to capture the skin temperature changes and then applying machine learning algorithms to classify emotion changes accordingly. This thesis contains two studies on thermal emotion detection with the comparison of EEG-base emotion detection. One was to find out the thermal emotional detection profiles comparing with EEG-based emotion detection technology; the other was to implement an application with deep machine learning algorithms to visually display both thermal and EEG based emotion detection accuracy and performance. In the first research, we applied HMM in thermal emotion recognition, and after comparing with EEG-base emotion detection, we identified skin temperature emotion-related features in terms of intensity and rapidity. In the second research, we implemented an emotion detection application supporting both thermal emotion detection and EEG-based emotion detection with applying the deep machine learning methods – Convolutional Neutral Network (CNN) and LSTM (Long-Short Term Memory). The accuracy of thermal image based emotion detection achieved 52.59% and the accuracy of EEG based detection achieved 67.05%. In further study, we will do more research on adjusting machine learning algorithms to improve the thermal emotion detection precision.
Keywords: Thermal emotion detection, EEG-based emotion detection, CNN, HMM, LSTM, affective stimuli pictures
Table of Content
Abstract ... 1 Table of Content ... 2 List of Tables ... 4 List of Figures ... 5 List of Abbreviations ... 6 Acknowledgement ... 7 Chapter 1. Introduction ... 81.1 Background and Objective ... 8
1.2 Outline of The Thesis ... 8
1.3 Related Researches ... 9
1.3.1 Detect Emotion from Text and Speech ... 9
1.3.2 Detect Emotion from Facial Expression ... 10
1.3.3 Detect Emotion from EEG ... 11
1.3.4 Summary ... 12
Chapter 2. Experiment Set up and Thermal Emotional Profile Detection ... 13
2.1 Introduction ... 16
2.1.1 Assessing Emotions ... 16
2.1.2 Assessing Emotions ... 17
2.2 Thermal Camera ... 17
2.2.1 Thermal Camera in Medicine ... 18
2.2.2 Using Infrared Camera for Emotion Detection ... 19
2.3 Using EEG to Measure Emotions ... 22
2.3.1 Emotiv Classification of Emotions ... 23
2.3.2 Correlation between Two Measure Methods ... 24
2.4 Experiment ... 25
2.4.1 Experiment Overview ... 25
2.4.2 Experiment Steps ... 27
2.5 Results and Discussion ... 31
2.5.1 Thermal Profiles on Face ... 31
2.5.2 Thermal Emotional Profiles: Rapidity and Intensity ... 32
2.5.3 Thermal Emotion Recognition using HMM ... 33
2.6 Conclusion ... 34
2.7 References ... 35
Chapter 3. Automatic Thermal Emotional Detection ... 39
3.1 Introduction ... 40 3.2 Research Challenges ... 42 3.3 Experiment ... 42 3.3.1 Experiment Equipment ... 42 3.3.2 Experiment Organization ... 45 3.4 Application ... 46
3.4.2 Facial Area Recognition using CNN ... 49
3.4.3 Emotion Detection from EEG Data ... 53
3.4.4 Emotion Detection from Thermal Image ... 55
3.5 Result and Discussion ... 58
3.6 Conclusion ... 60
3.7 Acknowledgement ... 60
3.8 References ... 60
Chapter 4. Findings and Conclusion ... 66
List of Tables
Table I. Means and standard deviations (parentheses) of ratings for emotions (Panayiotou,
2008). ... 21
Table II. The participant-independent and participant-dependent accuracy table. ... 33
Table III. EEG-Based Emotion Detection Accuracy (%) ... 58
List of Figures
Figure 1. Examples of upper face action units and some combinations (Donato, Gianluca, et al.
1999) ... 10
Figure 2. Five pictures of a child showing the temperature change of the nasal tip. ... 17
Figure 3. Chronic inflammation of the forefoot following a sport injury (Ring, 2012). ... 18
Figure 4. ICI 7320 Infrared Camera. ... 19
Figure 5. Arousal-valence Model. ... 20
Figure 6. Training classifiers using Hidden Markov Model. ... 22
Figure 7. Emotiv EPOC headset. ... 23
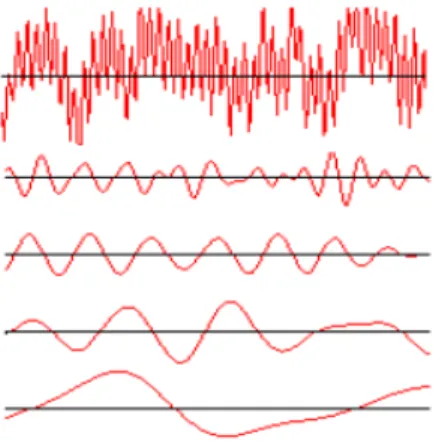
Figure 8. A raw EEG sample and its filtered component frequencies. Respectively (from the top): Beta, Alpha, Theta and Delta Brainwaves (Heraz et al. 2009). ... 24
Figure 9. Experiment Method. ... 26
Figure 10. Experiment Step 1. Display stimuli and record thermal picture. ... 27
Figure 11. IR Camera exports temperature data on pixels for every thermal picture. ... 28
Figure 12. For each thermal photo, find five-areas (forehead, nose, mouth, left cheek and right cheek) locations manually, and then calculate the five-area mean temperatures. ... 28
Figure 13. Comparison and extraction features of the thermal photo series. ... 29
Figure 14. EEG and Thermal Emotional Arousals have 3 to 6 second difference. ... 30
Figure 15. Two thermal signal charts of the 2nd and the 3rd experiment, showed that left cheek is cooler than the right. ... 31
Figure 16. A similar while slower thermal arousal segment comparing with EEG arousal. .... 32
Figure 17. Emotiv EEG headset. ... 43
Figure 18. Fourteen channel signals: AF3, F7, F3, FC5, T7, P7, O1, O2, P8, T8, FC6, F4, F8, and AF4. ... 43
Figure 19. ICI 7320 Infrared Camera and Its User Interface. ... 44
Figure 20. Experiment Organization. ... 45
Figure 21. Stimuli Display Method. ... 45
Figure 22. Thermal Emotion Detection Application Architecture. ... 46
Figure 23. Emotion Detection Result UI. ... 48
Figure 24. Facial Area Detection Approach. Step 1, cut the facial area from the thermal image; step 2, detect four facial areas (eyes, mouth and nose) using deep CNN; step 3, calculate the position of cheeks according to the positions of other facial areas. ... 50
Figure 25. Two-level convolution neural network. ... 51
Figure 26. The structure of one of the deep convolutional neural network (left eye) at the first CNN level. ... 52
Figure 27. Highlighted emotions to detect on the Arousal-Valence Dimension. ... 54
Figure 28. LSTM was applied to detect emotion changes. ... 56
List of Abbreviations
CNN: Convolutional Neural network CCRF: Conditional Random Fields EEG: Electroencephalogram FDM: Fractal Dimension Model HMM: Hidden Markov Model LSTM: Long Short-Term MemoryLSTM-RNN: Long Short Term Memory Recurrent Neural Network MLR: Multi-Linear Regression
PhyCS: International Conference on Physiological Computing Systems SVM: Support Vector Machine
SVR: Support Vector Regression UI: User Interface
FD: Fractal Dimension
Acknowledgement
I would like to express my sincere gratitude to my advisor Prof. Claude Frasson for his continuous support of my Master research and study, for his patience, motivation, and immense knowledge. His guidance helped me produced high-quality papers to submit and to publish in conferences. For my thesis writing, I really appreciated his guide on my task division, planning and management. I could not have imagined having a better advisor and mentor for my Master study.
Besides my advisor, I would like to thank my colleagues Sahbi Benlamine, Samira Bouslimi and Ben Abdessalem Hamdi for their patient suggestions, precious support and continuous encouragement.
Finally, I want to express my appreciation to my parents Fuyi Yang and Yougang Fu for giving birth to me and providing me spiritual supports throughout my life, to my beloved husband Lu Gao for his continued and unfailing love, support and understanding, to my lovely sweet daughter Bo Yuan Gao for her bright smiles which always cheer me up.
Chapter 1. Introduction
1.1 Background and Objective
As one of the effective methods to improve the human-computer interactions, emotion detection has been an emerging research field in many disciplines of biology, neuroscience, psychology, cognitive science and computer science. In recent decades, researches on detecting emotions theoretically and empirically from text (Kao, Edward Chao-Chun, et al. 2009), speech (El Ayadi, Moataz, et al. 2011), music (Kim, Jonghwa, and Elisabeth André, 2008), facial expression (Sprengelmeyer, R., et al, 1998), body posture (De Gelder, Beatrice. 2006), and EEG (Electroencephalogram) signals (Petrantonakis and Leontios, 2010) has increased significantly. While for speech-based emotion detection, the global-level acoustic features are not able to describe dynamic variation along an utterance (Busso, Carlos, et al. 2004), the facial expression based emotion recognition also is restricted by the pictures’ quality and clarity, or the lighting conditions. For the EEG-based technologies, as the headset device as to be worn by subject, it’s hard to apply to remote and mobile scenarios. In this thesis, we do a progressive approach to analyse the feasibility and accuracy of a non-invasive emotion detection method – thermal imaging based technology. We propose and carry out an experiment to capture both EEG and thermal photos for subjects when they are watching affective stimuli. Then both signals are trained and classified with machine learning algorithms in the application we implemented. The recognized emotions by two source are visualized in the application.
1.2 Outline of The Thesis
Following the study approach, this thesis is organized as below. Section 1 reviews the emotion detection background, methods and related affective computing technologies. Section 2 is my research paper of detecting thermal emotion profiles with the comparison with EEG based emotion detection, which was accepted and was presented at the PhyCS2016 conference. Section 4 is another paper about the application and algorithm of automatically detecting the emotion from the infrared images, comparing with the emotion detection from EEG signals,
which titled as Automatic Thermal Emotional Detection and which was submitted to the PhyCS 2017 conference. The final findings and conclusions of this thesis will be done in section 4.
1.3 Related Researches
Affective computing researchers have used various measures to estimate and detect emotion states, including self-report, behavior analysis, facial expression interpretation, and neurophysiologic measurement. In this section, we review the methods and algorithms used in emotion detection and compare their advantages and limitations.
1.3.1 Detect Emotion from Text and Speech
As the most general and direct way for human to interact with a computer system is via writing text or verbal communication, the researches of detecting emotions from text and speech have increasingly developed since Picard and Roalind proposed the conception of affective computing in 1997. The three categories: keyword-based, learning-based, and hybrid recommended approaches were mainly applied into textual affective detection (Kao, Edward Chao-Chun, et al. 2009) in blogs, news, or other articles. With the emerging development of social media, understanding the emotion expression, such as friendship, compassion or threaten, from short informal text has become an hot topic. Machine learning algorithms, such as non-linguistic machine learning, and support vector machines (SVMs) are widely used (Abbasi et al., 2008; Argamon et al., 2007; Boiy, Erik, and Marie-Francine Moens, 2009; Thelwall, Mike, et al. 2010; Wilson, Wiebe, & Hwa, 2006) in emotion detection, furthermore recognize sentiment strength or perform opinion mining. Speech emotion recognition was applied in car driving system for detecting a driver’s stressed mental state to avoid car accidents (Scheller et al.2 2004).
However, there are some research concerns in text and speech emotion recognition. The ambiguity of keywords, lack of linguistic information, and difficulties in determining emotion identifiers (Shivhare et al. 2012) have limited the performance and precision of emotion detection. Ayadi et al. (2011) also pointed the issue of identify proper features for efficiently characterizing different emotion.
1.3.2 Detect Emotion from Facial Expression
About how feelings communicate, psychologist Albert Mehrabian pointed in 1968 that feelings are communicated more by nonverbal elements such as facial expression or tones of voice than by words a person uses. He gave the formula of how much each of communicate messages contribute to the whole expression effect: Total Impact = 7% verbal + 38% vocal + 55% facial. As a multi-signal input-output communication system, the human face is our preeminent means of understanding somebody’s affective states (Keltner et al. 2003). Keltner and many researchers believe that, among four classes of facial signals (static facial signals, slow facial signals, artificial signals, rapid facial signals), rapid facial signals (facial expressions) communicate emotions (Ekman & Friesen, 2003; Ambady & Rosenthal, 1992; Keltner & Ekman, 2000) and personal traits (Ambady & Rosenthal, 1992).
Figure 1. Examples of upper face action units and some combinations (Donato, Gianluca, et al. 1999)
In 1971, Ekman and Frisen proposed and experimentally proved the relationships between six emotions (happiness, sadness, anger, surprise, disgust and fear) and distinctive patterns of the facial muscles. Later, they developed a facial action labeling system named as
muscles in 1978. 44 different action united (AUs) (Figure 1.) were distinguished to indicate the smallest visually discernable facial muscle movement (Ekman and al. 1980). Essa and Alex (1997) proposed an extended FACS model (FACS+) to observe subjects’ expression articulations in video sequence and archived 98% recognition accuracy. Then, machine learning models, such as Hidden Markov Model (HMM) (Cohen et al. 2000; 2003), LSTM (Wöllmer, Martin, et al. 2010), and Support Vector Machines (Michel et al.), etc, were applied to facial expression recognition for higher computing performance and precession. While as expressions recognition of images or videos is obviously impacted by lighting conditions, infrared thermal images was suggested to use to identify emotions even in dark environment (Yoshitomi et al. 2000; Hernández, Benjamín, et al.2007).
1.3.3 Detect Emotion from EEG
Over the recent decades, a number of researchers used physiological signals on affective computing and have achieved impressive results using machine learning algorithms. Among the various physiological signals, electroencephalogram (EEG) is the most popular method to analyse emotion status because it reaches high accuracy and provides real-time data processing possibility. Zheng et al. compared multiple deep learning method to classify EEG signals and achieved 87.62% accuracy using DBN-HMM and 84.08% accuracy using SVM. Petrantonakis and Hadjileontiadis (2011) applied Support Vector Machines model on emotion recognition and got 94.4% accuracy. Murugappan et al. (2009) combined spatial filtering and wavelet transform to classify emotions (happy, surprise, fear, disgust, and neutral). Liu et al. (2010) implemented a real-time algorithm to recognize six emotions, including fear, frustration, sadness, happiness, pleasant and satisfied, and achieved 90% classification accuracy for distinguishing joy, anger, sadness and pleasure.
However, during the experiment, we found that EEG can’t support long time experiment due to the humidity conditions that the electrode contacts require. In other words, when the electrode contacts become dry, the signals are not able to be effectively processed to computers. Another restriction is that EEG requires the subjects to stay near the device, which limits the applications of EEG based emotion detection.
1.3.4 Summary
Above emotion detection methods have achieved good results and they have been applied in a number of business areas, such as in social media marketing (Cvijikj and Michahelles, 2011), in affect aware video games (Szwoch and Wioleta, 2015), and in customer response analysis to products (Desmet, 2003). However, as the speech based emotion recognition requires multiple large databases for semantic feature classification, the facial expression recognition needs proper clarity and lighting conditions, the wearable device based affective analysis limits the subjects’ moving area, we proposed a new non-invasive emotion detection method – Thermal Emotion Detection, comparing its rapidity, intensity and accuracy with the results of EEG emotion detection.
Chapter 2. Experiment Set up and Thermal Emotional
Profile Detection
The main approach of our thermal emotion detection research is: step 1. to setting up an experiment of displaying stimuli pictures and capturing both EEG and thermal photos; step 2. to analyse the thermal emotional profiles comparing with that of EEG; step 3. to facilitate thermal facial area detection and improve the precision of thermal emotion detection using deep machine learning algorithms. This paper is to achieve the goals of the first and second steps, and next paper in chapter 3 is describing how we achieve the goal of the third step.
Then for this paper, to understand the links between brain signal and the skin temperature changes impacted by the blood flow changes, we set up six experiments inviting participants to watch a series of stimuli pictures with wearing EEG device and facing a thermal camera. Thus, the EEG signals and thermal photos are recorded for later analysis.
In terms of inviting participants, an email describing the experiment goals and how it works was distributed to the students of the Department of Computer Science and Operation Research (DIRO) of University of Montreal. Many students showed interests and we selected the first six students and scheduled experiment appointment with them. Before every experiment, the participant need to sign the Consent Form to make sure he or she understand the research objective, the participation in the research, the confidentiality, the advantage and disadvantage, and the right of withdrawal.
Before every experiment, the participants were suggested to sit and stay calm for letting their temperature keep at a stable situation. During each 60-minutes experiment, 80 pre-selected stimuli pictures from International Affective Picture System (IAPS) were displayed to participants, and every picture were displayed three seconds to ensure the participant’s emotion reactions aroused. Meantime, the brain activities and thermal photos were captured and saved automatically.
Then after the completion of the six experiments, we selected the most active brain activity channels to recognize the EEG emotional changes, and we manually identify the facial
areas (eyes, nose, month, and cheeks) on each thermal photo to train classifiers and then detect thermal emotional changes. As the manually facial area identification method limits the thermal data volume for further study, we proposed a model to identify facial areas automatically. This method is described and implemented in paper 2 (chapter 3).
In terms of machine learning algorithms that we applied to detect emotions, Hidden Markov Model (HMM) was applied because of its good performance on profile classification. Considering the individual differences, in this case, the temperature arousal differences or the skin temperature differences based their previous activities, we implemented the HMM algorithm to train and classify the thermal profiles and detect thermal emotion changes based on the participant himself or herself data (participant-independent) and based on all six participants’ thermal data (participant-dependent). The result shows that thermal emotional profile changes are 3 to 6 second slower than that of EEG, and the participant-dependent thermal emotion detection model brings better accuracy than that of the participant-independent model. There are still many work to do for achieving higher accuracy. We can arrange more experiments to get more thermal data for improving the HMM classifier training; we can try and apply other machine learning algorithms to find a way to get higher accuracy. Besides, the stimuli can be changed from image to sound to trigger the emotion arousal, such as IADS2 (the International Affective Digitized Sounds), and we can group participants by gender or character to reduce the impact from the individual differences.
Detecting Thermal Emotional Profile
(Accepted and published at the conference PhyCS 2016)Yang Fu and Claude Frasson University of Montreal
Department of Computer Science and Operations Research, [email protected], [email protected]
Keywords: Emotion Recognition, IAPS, Skin Temperature, Thermal Emotional Profile, Machine Learning, EEG, HMM (Hidden Markov Model), Infrared camera
Abstract: Human can react emotionally to specific situations provoking some physiological changes that can be detected using a variety of devices: facial expression, electrodermal activity, and EEG systems are among the efficient devices that can assess the emotional reactions. However, emotions can trigger some small changes in blood flow with an impact on skin temperature. In the present research we use EEG and a thermal camera to determine the emotional profile of a user submitted to a set of emotional pictures. Six experiments were performed to study the thermal reactions to emotions, and in each experiment, 80 selected standard stimuli pictures of 20 various emotional profiles from IAPS (a database of emotional images) were displayed to participants every three seconds. An infrared camera and EEG were used to capture both thermal pictures of participants and their electrical brain activities. We used several area of the face to train a classifier for emotion recognition using Machine Learning models. Results indicate that some specific areas are more significant than others to show a change in temperature. These changes are also slower than with the EEG signal. Two methods were used to train the HMM, one is training classifier per the participant self data (participant-independent), another is training classifier based on all participants’ thermal data (participant-dependent). The result showed the later method brings more accuracy in emotion recognition.
2.1 Introduction
Research in education, psychology, computational linguistics, and artificial intelligence acknowledge that emotions have an effect on learning (Heraz et al, 2007). Many works in that field focus on identifying learners’ emotions as they interact with computer systems such as Intelligent Tutoring Systems (Chaffar et al, 2009) or educational games (Derbali et al, 2012).
Unfortunately, many of these types of systems only focus on external behavior like face analysis, vocal tones and gesture recognition. Most of the time, psychological methods are used to collect real-time sensing data. Despite advances in these methods, it is still a challenging problem. The effective emotional state and its assessment lack precision. In addition, these methods are not applicable in the case of disabled, taciturn and impassive learners. Today, researches are directed toward a multi-model system that can automatically extract physiological signal changes in addition to vocal, facial or posture changes. All those features can be combined to detect and assess emotions.
2.1.1 Assessing Emotions
To properly interact with the learner, the emotion data collection methods have evolved from self-report (Anderson, 2001) to facial expression analysis (Nkambou, 2004), to body posture and gesture interpretations (Ahn et al, 2007), and to biofeedback measurements (Heraz et al, 2007, 2009). To increase the prediction of the emotional and cognitive learner states, the approaches of combining different kinds of information collection channels were applied (Kapoor et al, 2005). Regarding biofeedback measurement, researches showed that the Electroencephalograms (EEG) is one of the most reliable and accurate physiological signal to monitor the brain activities (Heraz et al, 2007). However, the wearable EEG devices, such as Q sensor (worn on wrist), EPOC Neuroheadset (worn on head), or SomaxisMyoLink (worn on body), also limit the user’s movement. It will be more convenient if there is a way to measure emotions noninvasively. In our research, our goal is to see the relation between the changes of skin temperature and emotions.
2.1.2 Assessing Emotions
During the past half century, psychologists have discovered and studied the relationship between skin temperature and emotion changes (Baker and Taylor, 1954). They have indicated that the skin temperature is getting lower because of the production of a constriction of the arterioles when the participants are under a stressful situation. By testing 27 participants with 4 negative and 4 positive stimuli, Vos P et al. (2012) found that the skin temperature is higher for expressing low intensity negative emotions. Kuraoka and Nakamura (2010) measured the nasal region temperature changes studying emotion in macaque monkeys. They found temperature decreased when the monkeys were facing negative situations. More interestingly, another experiment in the research of Ioannou et al. (2013) showed that when a child felt guilty after breaking a toy, his nose tip cooled off with more purple color (third picture); and after he was soothed, the thermal color turned more orange indicating his nose wormed (fifth picture on Figure 2).
Figure 2. Five pictures of a child showing the temperature change of the nasal tip. In this paper we present an exploratory study of using thermal camera to detect and assess emotions. After looking at the functionalities of a thermal camera and their use in the industry, we present the features of Electroencephalograms devices (EEG), a well known method for assessing emotions, mental engagement and workload. Then, we present the experiments realized with a set of emotional stimuli and the two devices. We compare the measures obtained with the two devices to validate thermal assessments.
2.2 Thermal Camera
Infrared thermography is a powerful technique for non-destructive and non-invasive investigation. It has been applied in building leakage detection (Titman, 2001; Balaras, 2002), medicine area (Jones, 1998), and even accident rescue (Doherty et al., 2007). Because of its
non-invasive and non-destructive nature, the thermal detection can be rapidly completed, with slight access efforts and costs. The visibility of the output also can be interpreted immediately by a skilled practitioner (Titman, 2001).
2.2.1 Thermal Camera in Medicine
Measuring body temperature is one of the traditional diagnostic methods in medicine, besides, it is also applied to measure the outcome of clinical trials. In recent decades, as a non-invasive and painless method, thermal imaging technique has been widely applied to various fields of diagnostic, such as to find the sites of fractures and inflammations, to recognize the degree of burn, to detect breast cancer and to determine the type of skin cancer tumors (Ogorevc et al., 2015). As Ring et al. (2012) mentioned in their research, the skin temperature can indicate the existence of inflammation in underlying tissue (Figure 3), osteoarthritis, soft tissue rheumatism, and complex regional pain syndrome (CPRS). A temperature difference of 1 °C between the affected and the non-affected limb is one of the diagnostic criteria of CPRS (Wilson et al. 1996).
Figure 3. Chronic inflammation of the forefoot following a sport injury (Ring, 2012). Studies showed that infrared imaging is also a powerful tool for clinical testing. Devereaux et al. (1985) used infrared thermography to quantify joint inflammation and to assess patients’ response to therapy of rheumatoid arthritis. By following patients over 12 months, the researchers found that there are significant correlations for thermography with other parameters of disease activity. In recent years, the study of Spalding et al. (2008) showed that
three-dimensional measures and thermal imaging are able to indicate a significant coincidence between high temperature and swelling of figure joints.
2.2.2 Using Infrared Camera for Emotion Detection
2.2.2.1 Infrared Camera
In our study, we used an infrared camera (ICI 7320) (Figure 4) to capture real time thermal images and provide radiometric data streams to hard or portable devices. The camera is able to give sensitive and accurate thermal data in a range of -20°C to 100°C. Comparing with EEG, because of the camera’s non-invasive feature, it is easier to set up and configure.
Figure 4. ICI 7320 Infrared Camera. 2.2.2.2 IAPS
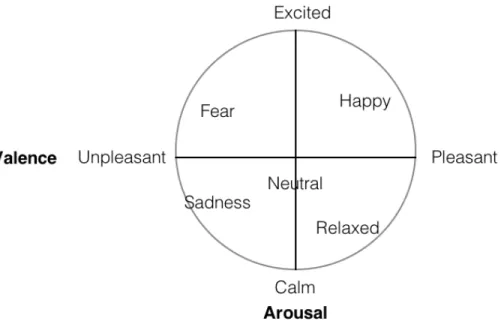
To know which emotions should be detected we used a set of emotional pictures as stimuli materials which have been categorized according to specific emotions. The Centre for the Study of Emotion and Attention (CSEA) of the University of Florida developed two large sets of affective stimuli, IAPS (International Affective Picture System) and IADS (the international Affective Digitalized Sound system), to provide standard materials for emotion and attention related studies. Based on Osgood et al. (1962) seminal work, IAPS assessed the emotions from three dimensions: affective valence, arousal and dominance. In this research, the arousal-valence model (Figure 5) was used to represent the emotions. Valence ranges from pleasant to unpleasant and arousal ranges from calm to excited. Dominance, which is also called control, is a less strongly-related dimension. In our experiments, we selected 80 IAPS pictures
from 20 various picture sets for presenting to participants and measuring their emotional reactions.
Figure 5. Arousal-valence Model.
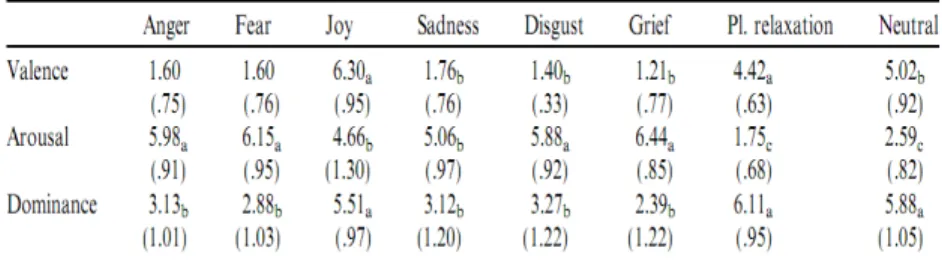
Emotions considered were: neutral, happy, sad, angry, fear, disgust, and sad. To measure them according to arousal and valence dimensions, we used the means and standard deviations of the rating emotion table (Table I) from Panayiotou (2008) research as a standard base for further machine learning.
Human skin temperature is the product of heat dissipated from the vessels and organs within the body, and the effect of environmental factors on heat loss or gain. To facilitate the detection of emotions by thermal variations we will focus on five area of the face: forehead, nose, mouth, left cheek and right cheek.
Table I. Means and standard deviations (parentheses) of ratings for emotions (Panayiotou, 2008).
Considering that the temperature changes may require time to display on participants skin, every picture was displayed three seconds. Meanwhile, to figure out how the skin temperature is back to a ‘neutral’ status, a non-stimuli picture was shown in between every two IAPS pictures.
The emotional profile, which depends on each participant, will be based on two parameters: 1) the rapidity of the thermal changes; and 2) the temperature change intensity.
2.2.2.3 Hidden Markov Models
Six students were invited to participate into this study and they were asked to watch the eighty slide-showing pictures without any disruption. Thermal photos were taken every three seconds during the picture-displaying period. Then the features of thermal changes on the five areas of their face (forehead, nose, mouth, left cheek and right cheek) were trained and classified with a Hidden Markov Model, in order to obtain the thermal emotional profiles.
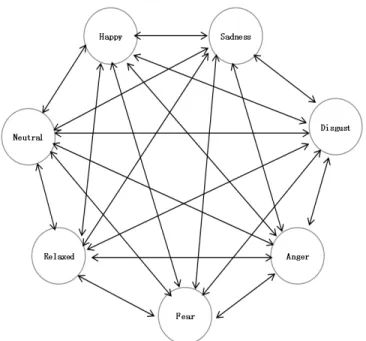
Hidden Markov Models (HMM) are widely used to find out the joint probability of a collection of hidden variables and observed variables. It is defined by a tuple λ=(n, m, A, π, B), where n indicates the number of hidden states, m indicates the number of observable states, A is the state transition probability, B is the emission probability density function of each state, and π is the initial state probability. In this research, recognizing emotion from a series of thermal data over the time is a typical modeling problem which can take advantage of HMM.
As an emotion state can transfer to any other states, the state-transition topology of the emotion recognition model is an ergodic topology (Figure 6). Then, we train the maximum likelihood classifier using the Baum-Welch algorithm. According to the classifiers, the hidden states – emotions (neutral, happy, sad, disgust, angry, afraid, relaxed) can be computed from the observed states (turn wormer (1), colder (2), or no change (0) on nose, on forehead, etc.) - the thermal change states. Two training methods were used in our study: one is to train the classifier with a participant’s previous data, which was named as participant-independent training. Another is to train the classifier based on all other participants’ data, named as
participant-dependent method.
Figure 6. Training classifiers using Hidden Markov Model.
2.3 Using EEG to Measure Emotions
In this section, we introduce the EEG device, explain how it monitor brain activities and how it was applied on emotion detection.
2.3.1 Emotiv Classification of Emotions
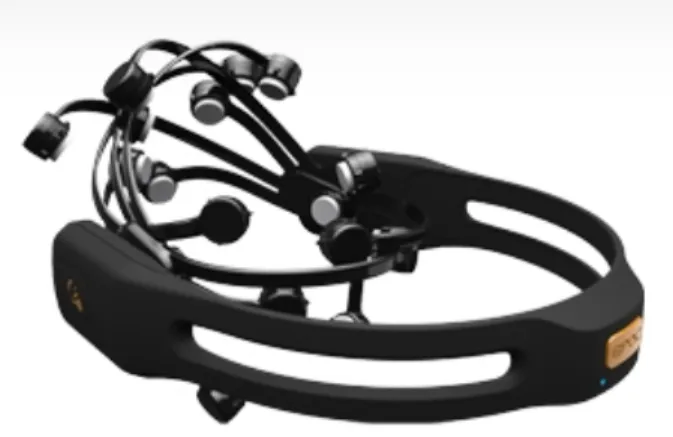
In many recent researches, EEG has been applied to recognize emotions (Figure 7). We also took EEG as comparison reference to analyze the rapidity and intensity of thermal signals. Thus EEG signals were captured at the same time when the participants were watching the experiment pictures and when the thermal pictures were recorded.
Figure 7. Emotiv EPOC headset.
EEG detects the electrical signals released by the brain through a series of electrodes placed. The brainwaves were categorized into 6 different frequency bands: delta, theta, alpha, beta1, beta 2 and beta 3 waves (Figure 8). Two of them, the alpha (8-12Hz) and beta (12-30Hz) were used in our research, since alpha waves are the main indicator for an alert and beta signals are related to the active state of mind (Bos et al. 2006).
Figure 8. A raw EEG sample and its filtered component frequencies. Respectively (from the top): Beta, Alpha, Theta and Delta Brainwaves (Heraz et al. 2009).
2.3.2 Correlation between Two Measure Methods
In recent decades, EEG has been used in many researches to recognize emotions. Murugappan et al. (2009) combined spatial filtering and wavelet transform to classify emotions (happy, surprised, afraid, disgust, and neutral). Liu et al. (2010) implemented a real-time algorithm to recognize six emotions, including fear, frustration, sadness, happiness, pleasure and satisfaction, and achieved 90% classification accuracy for distinguishing joy, anger, sadness and pleasure. EEG was also applied in monitory drivers’ emotional behavior and help them to adjust their negative emotions to keep driving safely (Frasson et al. 2014).
Based on the EEG emotion recognition methods and algorithms, it is more efficient for us to apply the thermal technique into emotion detection area. We can also use the HMM or other proved model to perform classification and detect emotion changes. The only questions to consider are which thermal signals to capture, how to tailor the classifier training model to fit the thermal data processing approach, and how to check the accuracy of emotion recognition with thermal signal. Thus, in our research, the EEG emotion detection methods were used as important inputs and reference for the study of applying thermal signal on emotion reorganization.
2.4 Experiment
2.4.1 Experiment Overview
2.4.1.1 Experiment Method
As shown in Figure 9, the participants were invited to watch a series of IAPS stimuli pictures. During the experiment, an Emotiv EPOC headset (Figure 7) and an infrared camera (ICI 7320, Figure 4) were used to respectively capture the real-time Electroencephalography (EEG) signals, and the thermal pictures of the participants’ faces. After recording both EEG and thermal pictures, we used the ICI camera software to export the 640*480 digital temperature matrix, which means 300k temperature data, in csv format for each infrared picture. To deal with the numerous thermal data, a data analysis agent was implemented to detect face areas, calculate average temperatures, and identify thermal changes. By comparing the EEG and thermal changes, we analyzed the thermal emotional profiles according to rapidity and intensity parameters. The details of the approach are presented in the next subsection.
Figure 9. Experiment Method.
2.4.1.2 Experiment Material Selection
The International Affective Picture System (IAPS) provides the rating of a large set of emotionally-evocative color photographs across a wide range of semantic categories. In each picture set (totally 20 picture sets), 60 different IAPS pictures are varied in valence and arousal
pictures in each picture set and displayed them 3 seconds each, which means that 80 IAPS pictures were selected. Meanwhile, to measure the thermal emotional changes when the participant is in neutral state, a preparation picture writing “Get ready to watch the next picture” appeared for three seconds before displaying the next IAPS picture.
2.4.2 Experiment Steps
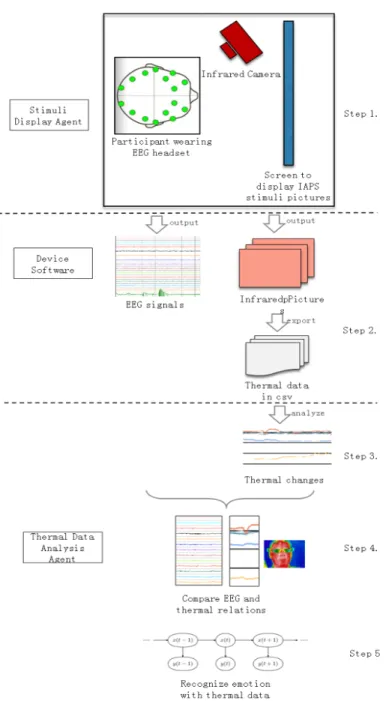
The methodology of the experiment process is decomposed into five steps indicated below. Two agents Stimuli Display Agent and Thermal Data Analysis Agent are co-working with EEG and ICI camera software in experiments. The Stimuli Display Agent was designed to associate the experiment to record participant information, experiment information and every pictures displaying time, etc. About Thermal Data Analysis Agent, it was developed to read thermal pictures, calculate face five areas temperature, and analyze thermal changes.
Step 1. Participants view stimuli pictures, and devices record EEG data and thermal pictures. Six experiments were performed one by one with different participants of the two genders of similar ages. We helped every participant to wear the EEG headset and positioned the IR camera in front of him/her. After the devices were set properly, the participant was invited to watch the pictures slide-showed by the Stimuli Display Agent in a quiet environment. In the meantime, the pictures were displaying, the EEG data were recorded in real time and the thermal pictures were taken (refer to the sample picture in Figure 10) every 3 seconds.
Step 2. Export temperature data for every thermal picture. As mentioned in the Experiment Material Selection paragraph, in each experiment, 160 pictures were displayed to each participant and a total of 160 thermal photo accordingly. Later the thermal pictures were manually exported into related 160 cvs files (as IR Flash Software version 2.13.29.10 only supports exporting thermal matrix into csv file one by one) (Figure 11).
Figure 11. IR Camera exports temperature data on pixels for every thermal picture. Step 3. Calculate the mean temperatures on five face areas and analyze thermal changes. The face location of a thermal photo was detected manually and five areas were focused for further analyzing thermal changes (Figure 12). Considering that every thermal picture can generate a 640 * 480 temperature data matrix, the data volume of 160 thermal pictures reaches almost 50 million data. To process the data efficiently, an initial analysis of calculating area average temperature were performed and the mean values were recorded instead of saving the huge amount of raw data into database, performed by the Thermal Data Analysis Agent. Then the thermal state changes (Figure 13) were identified. Please note that we focused more on the temperature changes, not the absolute temperature value since every human has different thermal activity, even when they are in the same environment.
Figure 12. For each thermal photo, find five-areas (forehead, nose, mouth, left cheek and right cheek) locations manually, and then calculate the five-area mean temperatures.
Figure 13. Comparison and extraction features of the thermal photo series.
Step 4. Compare EGG emotional profiles with thermal emotional profiles. In this step, both EEG data and thermal changes were compared to analyze the rapidity and intensity of thermal emotional profiles (Figure 14). For the EEG data, the beta/alpha ratio (Fp1 and Fp2) were set as an indicator of the arousal state, and alpha activities (F3, F4) was used to recognize valence state (Bos, 2006). Then we use the thermal change produced in previous step to compare with the EEG arousal/valence states to figure out if thermal detection refers to the same emotional state measured by the EEG.
Area Temperature Forehead 27.82 Nose 21.56 Mouth 31.02 Left Cheek 28.83 Right Cheek 29.21
Area Temperature Change Forehead 27.98 ↑ Nose 20.06 ↓ Mouth 31.62 ↑ Left Cheek 27.98 ↓ Right Cheek 28.65 ↓
Area Temperature Change Forehead 28.02 ↑ Nose 20.56 ↑ Mouth 30.72 -Left Cheek 27.76 ↓ Right Cheek 29.67 ↑
…
The 1stThermal Picture The 2ndThermal Picture The NthThermal PictureFigure 14. EEG and Thermal Emotional Arousals have 3 to 6 seconds difference.
Step 5. In this step, we applied Hidden Markov Model on emotion recognition using thermal data. Considering the individual differences, the emotion arousal may be different for each participant. Then the question is whether to use the participant’s history data to train classifiers or use all other participants’ history data to train, which will bring higher accuracy when using the classifiers to detect emotions. As mentioned in subsection 2.3.2, we proposed two methods to train the emotion classifiers, one is based on participant himself or herself data (named as participant-independent model), and the other is based on other participants’ data (named as participant-dependent model).
For the first model, only current participant’s thermal signals were taken into account. The thermal data of the first 60 IAPS pictures and 60 preparation pictures were used as input to train the classifier for a participant, then the classifier was used to recognize the emotions when he/she was watching the rest of 20 pictures.
A segment of EEG data
For the second model, the participant-dependent model, in order to recognize a participant’s emotion when he/she was watching the stimuli pictures, the classifiers were trained based on the other five participants’ thermal data, As the training base for the second model is larger than the first model, theoretically, the emotion recognition accuracy of the second model will be better than the first one. In the next section, the experiment result shows that the inference is correct.
2.5 Results and Discussion
2.5.1 Thermal Profiles on Face
Figure 15. Two thermal signal charts of the 2nd and the 3rd experiment, showed that left cheek is cooler than the right.
By assessing all six experimental results, we found that generally the nose temperature is lower than cheek temperature, and normally the left cheek is cooler than the right cheek which is the same as the finding of Rimm-Kaufman et al (1996). Figure 15 shows the sub segments of
the 2ndand 3rdexperiment. X indicated the pictures number that the participant watched (0 refers
to the preparation picture) and Y indicates the temperature.
2.5.2 Thermal Emotional Profiles: Rapidity and Intensity
Doucleff (2013) indicated in his study that the skin temperature changes because of the stimulation of nervous system, oxygen to the muscles, heart beat and blood pressure. So the skin thermal signal must appear slower than the brain signals. Then two questions arise: How long the thermal change can reflect on participant’s skin? And what are the thermal intensities reflecting to different stimuli materials. In this section, we compare EEG and thermal data to analyze the emotional profiles from two dimensions: rapidity and intensity (Figure 16).
Figure 16.A similar while slower thermal arousal segment comparing with EEG arousal.
We filtered EEG data, and then used FC6 for getting the arousal levels and F3/F4 channel for getting the valence levels (Liu et al. 2010). By comparing the EEG channel signals with thermal changes, which were calculated in the experiment step 3, we found that around 60% similar thermal arousals on forehead and left cheek were shown 3 to 6 seconds after the EEG arousal. In terms of intensity, the temperature increase was normally within a range of 0.1°C to
0.5°C, and temperature decrease in a smaller range of 0.05 to 0.3°C, which means the skin temperature is easier to increase than to decrease.
2.5.3 Thermal Emotion Recognition using HMM
As mentioned in the experiment approach section, the emotion recognition was conducted using participant-independent and participant-dependent methods. This two method is mainly referring to which training sets are considered. For the participant-independent, we selected the participant’s first 60 stimuli pictures and related thermal photos to train the emotional classifiers, then test the classification model on the remaining 40 stimuli picture and related thermal photos. For the participant-dependent method, as the name signifies, one participant’s emotion likelihood depends on the other participants’ classifications, which means that the classifier training was based on a total of 800 (=160*5) thermal samples. The results in Table I show that we achieved higher accuracies with participant-dependent model, which meets our inference.
Table II. The participant-independent and participant-dependent accuracy table.
Participant No. Participant-Independent Accuracy(%) Participant-Dependent Accuracy(%) 1 4.55 38.89 2 18.18 23.46 3 4.59 35.19 4 9.09 30.25 5 27.27 28.40 6 4.55 30.25 Average 11.37 31.07
From an overall point of view, there are possibilities to improve the emotion recognition accuracies to higher rates. The solutions could be to perform more experiments, to display more IAPS pictures to train the model, and to replace current manually indicated five-area locations by detecting automatically the five-area locations subject to change.
2.6 Conclusion
More experiments could be performed to improve the HMM classifier training, to enhance the analysis accuracy, and study the emotion profile differences by gender or ages. Furthermore, the matching learning algorithm used in this research could be applied to recognize the emotion profiles on the other normative emotional stimuli sets, such as IADS2 (the International Affective Digitized Sounds). More data analysis can be applied to find which part(s) of skin temperature can provide more accurate emotion recognition. As unlike the facial expression, the internal thermal reaction cannot be controlled by the participant, we can also compare the accuracy between facial expression and thermal emotion detection. Meanwhile, as manually locating faces on thermal photos is unrealistic in high volume of data analysis, an automatic face detection method should be built out to improve the efficiency. Next target also includes the improvement of our application, Thermal Profile Analyzer to display both EEG and thermal signals for replaying the experiment and showing participant’s emotional analysis result.
2.7 References
Ahn, Hyung-il, Teeters, Alea, Wang, Andrew, Breazeal, Cynthia, & Picard, Rosalind. (2007). Stoop to Conquer: Posture and affect interact to influence computer users' persistence, The 2nd International Conference on Affective Computing and Intelligent Interaction, September 12-14, Lisbon, Portugal.
Anderson, James. (2001). Tailoring Assessment to Study Student Learning Styles. In American Association for Higher Education, (53) 7.
Baker, Lawrence M.; Taylor, William M. (1954). The relationship under stress between changes in skin temperature, electrical skin resistance, and pulse rate. Journal of Experimental Psychology, Vol 48(5), Nov 1954, 361-366.
Balaras, C. A., &Argiriou, A. A. (2002). Infrared thermography for building diagnostics. Energy and buildings, 34(2), 171-183.
Bos, Danny Oude, (2006). EEG-based Emotion Recognition, The Influence of Visual and Auditory Stimuli. Department of Computer Science, University of Twente.
Chaffar, Soumaya, Derbali, Lotfi, & Frasson Claude. (2009). Towards Emotional Regulation in Intelligent Tutoring Systems, AACE World Conference on E-learning in Corporate, Government, Healthcare& Higher Education: E-LEARN 2009, Vancouver, Canada. Derbali, Lotfi& Frasson, Claude. (2012). Assessment of Learners’ Motivation during Interactions with Serious Games: a Study of some Motivational Strategies in Food-Force. Advances in Human-Computer Interaction - Special issue on User Assessment in Serious Games and Technology-Enhanced Learning. Volume 2012, January 2012. Article No. 5.
Devereaux, M. D., Parr, G. R., Thomas, D. P., &Hazleman, B. L. (1985). Disease activity indexes in rheumatoid arthritis; a prospective, comparative study with thermography. Annals of the Rheumatic Diseases, 44(7), 434-437.
Doherty, Patrick &Rudol, Piotr. (2007) A UAV Search and Rescue Scenario with Human Body Detection and Geolocalization, Volume 4830 of the series Lecture Notes in Computer Science pp 1-13.
Doucleff, Michaeleen. (2013). Mapping Emotions On The Body: Love Makes Us Warm All Over, Health News From NPR, December 30, 2013.
Frasson, C., Brosseau, Pierre-Olivier, Thi Hong Dung Tran. Virtual Environment for Monitoring Emotional Behaviour in Driving. The 12th International Conference On Intelligent Tutoring Systems (ITS 2014). Honolulu, Hawaii. June 5-9, 2014.PDF
Heraz, Alicia, Razaki, Ryad. & Frasson, Claude. (2007) Using machine learning to predict learner emotional state from brainwaves. 7th IEEE conference on Advanced Learning Technologies: ICALT 2007, Niigata, Japan, 2007.
Heraz, Alicia, Razaki, Ryad. & Frasson, Claude. (2009)How Do Emotional Stimuli Influence the Learner's Brain Activity? Tracking the brainwave frequency bands Amplitudes.
International Conference on Agents and Artificial Intelligence. ICAART, Jan 2009. Porto,
Portugal.
Ioannou, Stephanos, Ebisch, Sjoerd, Aureli, Tiziana, Bafunno, Daniela, Ioannides, Helene Alexi, Cardone, Daniela, Manini, Barbara, Romani, Gian Luca, Gallese, Vittorio, &Merla, Arcangelo. (2013) The Autonomic Signature of Guilt in Children: A Thermal Infrared Imaging Study. Published: November 19, 2013. DOI: 10.1371/journal.pone.0079440.
Jatupaiboon, Noppadon, Pan-ngum, Setha, &Israsena, Pasin. (2013). Real-Time EEG-Based Happiness Detection System, The Scientific World Journal, vol. 2013, Article ID 618649, 12 pages, 2013. doi:10.1155/2013/618649.
Jones, B.F.(1998) A Reappraisal of the Use of Infrared Thermal Image Analysis in Medicine, IEEE TRANSACTIONS ON MEDICAL IMAGING, VOL. 17, NO. 6, DECEMBER 1998, 1019-1027.
Kapoor, Ashish, Ahn, Hyungil, & Picard, Rosalind W. (2005) Mixture of Gaussian Processes for Combining Multiple Modalities, in Proceedings of Multiple Classifier Systems, Eds. N. C. Oza, R. Polikar, J. Kittler, and F. Roli, 6th International Workshop, MCS 2005, June 2005, Seaside, CA, pp. 86-96.
Kuraoka, Koji,http://www.sciencedirect.com/science/article/pii/S0031938410004294 - af0010Nakamura, Katsuki. (2011) The use of nasal skin temperature measurements in studying
emotion in macaque monkeys. Physiology & Behavior Volume 102, Issues 3–4, 1 March 2011, Pages 347–355
Lang, Peter J. (2008). International affective picture system (IAPS): Affective ratings of pictures and instruction manual. Technical Report A-8. University of Florida, Gainesville, FL. Bradley, M.M., & Cuthbert, B.N. (2008).
Liu, Y., Sourina, O., & Nguyen, M. K. (2010, October). Real-time EEG-based human emotion recognition and visualization. 2010 International Conference on Cyberworlds (CW)(pp. 262-269). IEEE.
Murugappan, M., Nagarajan, R., &Yaacob, S. (2011). Combining spatial filtering and wavelet transform for classifying human emotions using EEG Signals. Journal of Medical and Biological Engineering, 31(1), 45-51.
Nkambou, R.V. (2004). Facial expression analysis for emotion recognition in ITS. In: ITS’2004 workshop on Emotional Intelligence proceedings.
Ogorevc, J., Pušnik, I., Geršak, G., Bojkovski, J., &Drnovšek, J. (2015). Thermal imaging in medicine. ZdravniškiVestnik, 84(11), 757-770.
Osgood, C.E. (1962). Studies on the generality of affective meaning systems. American Psychologist, 17, 10-28.
Panayiotou, G. (2008). Emotional dimensions reflected in ratings of affective scripts. Personality and Individual Differences, 44(8), 1795-1806
Ring, E. F. J., &Ammer, K. (2012). Infrared thermal imaging in medicine. Physiological measurement, 33(3), R33.
Rimm-Kaufman, S. E., & Kagan, J. (1996). The psychological significance of changes in skin temperature. Motivation and Emotion, 20(1), 63-78.
Spalding, S. J., Kwoh, C. K., Boudreau, R., Enama, J., Lunich, J., Huber, D., .& Hirsch, R. (2008). Three-dimensional and thermal surface imaging produces reliable measures of joint shape and temperature: a potential tool for quantifying arthritis. Arthritis Research and Therapy, 10(1), R10.
Titman, D. J. (2001), Applications of thermography in non-destructive testing of structures, NDT & E International, 34(2), 149-154.
Vos, Pieter, De Cock, Paul, Munde, Vera, Petry, Katja, Noortgate, Wim Van Den , Bea, &Maes B. (2012) The tell-tale: what do heart rate; skin temperature and skin conductance reveal about emotions of people with severe and profound intellectual disabilities? Res Dev Disabil. 2012 Jul-Aug; 33(4): 1117-27.
Wilson, P R, Low, P A, Bedder, M D, Covigton, W E C, and Rauck, R. (1996) Diagnostic algorithm for complex regional pain syndromes Reflex Sympathetic Dystrophy ed A Re-appraisal, W Jänig and M Stanton-Hicks (Seattle: IASP Press) pp 93-105
Chapter 3. Automatic Thermal Emotional Detection
In Chapter 2, we described the experiments to display stimuli pictures and record both EEG signals and thermal photos, and the comparison of emotion detection performance using these two kinds of signal. We continue to apply more machine learning models to facilitate facial area detection on thermal photo, and to improve the emotion detection based on EEG and thermal photos. To further code reuse and easy to interact with computers, we implemented a application called Thermal Emotional Detector to support uploading both EEG and thermal data, analyzing emotional profiles, and then display recognized emotions.Based on the experiment results described in Chapter 2, we proposed CNN (Convolutional Neural Network) to automatically identify the locations of eyes, nose, mouth and cheeks on a thermal photo, applied LSTM (Long-Short Term Model) to classify the emotional profiles based on the temperature changes on above facial areas, and then implemented Fractal Dimension (FD) Algorithm in EEG emotion detection.
The results show the EEG based emotion detection has higher accuracy than using thermal changes. This may be because of the limited thermal training data, which means more experiment need to be performed. On the other hand, we may improve the accuracy by adjusting the machine learning algorithms. In summary, in other to use the thermal cameras’ as a non-invasive method to detect emotions, we still need to optimize the machine learning models or try other algorithms. So that thermal emotion detection technology can be widely applied to improve the human-computer interactions, such as health care, e-learning, customer preference analysis and video games.
Automatic Thermal Emotional Detection
(Submitted at the conference PhyCS 2017)Yang Fu and Claude Frasson University of Montreal
Department of Computer Science and Operations Research, [email protected], [email protected]
Abstract:
In recent decades, detecting emotions has attracted the interests of researchers in the areas of psychology, neuroscience and computer science. To effectively identify emotions, facial emotion expression, emotion state in speech, body languages and EEG (Electroencephalography) have been studied with machine learning methods. In this research, we are exploring how the facial temperature changes relate to human emotions, such as happiness, sadness, fear and relax. We implemented an application named as Thermal Emotional Detector to support analysing both the EEG and thermal signal in terms of emotion recognition. CNN (Convolutional Neural Network) was applied in this application for face identification in thermal images and emotion detection. The emotions identified by both electroencephalography and skin temperature changes are able to be displayed and compared by the application.
Keywords: Emotion Recognition, Skin Temperature, Thermal Emotional Profile, Machine Learning, EEG, CNN (Convolutional Neural Network), LSTM (Long Short Term Memory)
3.1 Introduction
In recent decades, as one of the methods to improve the human-computer interactions, emotion recognition has become a growing field in psychology, neuroscience and computer
such as interest, anger, joy, sadness, fear, or contempt, e-learning systems are able to response and adjust training materials more properly and timely, video games are able to be more interactive and challenging, and the communication with autistics may become possible. Researches showed that using the real-time detected emotions as the feedback to e-learning systems could lead them to deliver proper e-learning content and increase their superiority significantly (Liping et al, 2009). Derbali and Frasson (2012) have successfully showed that several physiological parameters such as heart rate, skin conductance, and electroencephalogram (EEG) are suitable to assess the effects of motivational strategies on learners’ motivation. In Rani, Sarkar and Liu’s study (2005), the physiological signals were utilized as a powerful indicator to make a game more challenging and to induce the player to perform better.
To identify the affective states, the methods evolve from self-report (Anderson, 2001), text and speech (New et al. 2003), facial expression analysis (Nkambou, 2004), body posture and gestures interpretations (Ahn et al, 2007), to biofeedback measurements (Heraz et al, 2007b, 2007c, 2008). For the latter, researches proved that the Electroencephalogram (EEG) is one of the reliable physiological signals to monitor the brain activities (Heraz et al, 2007b) and furtherly recognize emotion changes. To increase the accuracy of detecting affective states, the approaches of combining different kinds of affective signal collection channels were applied (Kapoor et al, 2005).
However, the patients who suffer from facial nerve paralysis, are not able to express facial emotions effectively (Coulson, Susan et al. 2004). The wearable devices, including EEG, Q sensor (worn on wrist), EPOC Neuroheadset (worn on head), and Somaxis MyoLink (worn on body), require the subjects to be near the equipment. Thus, in our research, we propose a remote and non-invasive way, using thermal signals to detect emotions.
As it has been proved that EEG is an effective tool for the emotion recognition (Liu, Yisi et al. 2010, 2011; Bos and Danny, 2006), EEG was used as a reference to check the accuracy of thermal emotion detection, and to compare the rapidity and intensity of the emotions explored though skin temperature. Thermal facial parts identification and thermal emotional feather classification are two main challenges in our study. We apply deep machine learning algorithms – CNN (Convolutional Neural Network) to resolve these issues and achieve higher accuracy
rate. Intelligent interactive systems can greatly benefit from the result to enhance the user motivation and application performances.
3.2 Research Challenges
There are two main technology challenges in detecting thermal emotions automatically. First, identifying the exact location of face, eyes, nose and mouth is a crucial precondition for thermal emotional analysis. Because we found that the commonly used facial detection method – using Haar feature-base cascades classifiers (Wilson, 2006) was not working on thermal images. In our previous study reference, to focus on the affective study, the face points were manually identified. This was a long task to achieve. Thus in this research, we used Deep Convolution Network Cascade (Sun et al., 2013) for accurate facial points detection.
The second challenge is that identifying a method to interpret the emotional changes based on the facial skin temperature changes. Instead of using IR facial expression to recognize emotion (Yoshitomi, Yasunari, et al. 2000; Wang, Shangfei, et al., 2010; Nguyen, Hung, et al. 2013), we want discover the mystery of the relation between temperature and emotional changes, especially the model should recognize features from each subjects’ thermal change differences.
3.3 Experiment
We proposed and carried out an experiment recording both thermal facial photos and EEG signals of subject when they are watching the visual stimuli – International Affective Picture System (IAPS) (Lang, Peter J. et al. 2008). An application was implemented to display the IAPS stimuli images, to support the upload of the thermal data and EEG data for each subject, and to analyze and compare the emotion detection accuracies using these two kinds of signals. We describe the architecture, algorithm and technologies of the EEG and thermal emotion application in the the next section.
3.3.1 Experiment Equipment
Figure 17. Emotiv EEG headset.
Figure 18. Fourteen channel signals: AF3, F7, F3, FC5, T7, P7, O1, O2, P8, T8, FC6, F4, F8, and AF4.
During the experiment, subjects were invited to wear Emotiv EEG headset (Figure 17) to capture electroencephalogram signals when they were watching the slide-showed affective pictures. 14 channel signals: AF3, F7, F3, FC5, T7, P7, O1, O2, P8, T8, FC6, F4, F8 and AF4 (Figure 18) were monitored and recorded through the wireless Bluetooth connection. Its bandwidth is at 0.2-45 Hz; digital notch filters is at 50Hz and 60Hz; A/D converter is with 16 bits resolution and sampling rate is of 128Hz. EEG-based emotion recognition is one of the most common used methods since capturing brain activities is a natural and direct way to observe human’s emotion responses. However, proper electrode application is crucial to obtain signals in good quality. For instance, skin preparation, application of conductive gel, correct position of electrode, wetting degree of electrode all may impact the experiment performance (Mak, J.
N., et al. 2011). In this research, comparing with the EEG-based emotion recognition method, we study the feasibility and accuracy of thermal imaging based method.
3.5.1.2 Infrared Camera
In this research, an infrared camera (ICI 7320) (Figure 19) produced by Infrared Camera Inc. was used as it not only has the capability of gauging temperature ranging from -20°C to 100°C with precision up to 0.01°C, but also provides a perfect resolution of 320x240 pixels. In terms of the functions, the camera support to capture series images and export the temperature data on every pixel of each image. The refresh rate is 50/60 Hz. With the USB connection, the captured infrared image and temperature data can be processed and displayed in real-time on a computer.
Figure 19. ICI 7320 Infrared Camera and Its User Interface.
Infrared thermography was proved to be an effective technique for non-destructive and non-invasive investigation. This technique is widely applied in building leakage detection (Titman, 2001), in medicine research (Jones, 1998), and even in accident rescue (Doherty et al., 2007). Because of its non-invasive feature, the thermal detection is able to be performed rapidly with little access efforts and costs. The infrared output can be interpreted immediately by a skilled practitioner (Titman, 2001). For instance, a property inspector can use IR camera to find energy leaks caused by improperly installed or damaged insulation, thermal bridges, air leakage, moisture damages or cracks in concretes (Balaras, 2002).
3.3.2 Experiment Organization
Figure 20. Experiment Organization.
Figure 21. Stimuli Display Method.
We carried out an experiment (Figure 20) inviting participants to watch a series of affective stimuli pictures which had been selected from International Affective Picture System (IAPS). During each experiment, one participant was wearing an Emotiv EPOC headset and placed in front of an infrared camera when he/she was watching the affective stimuli pictures which were displayed by our application (Figure 21) every 3 seconds. Both electroencephalogram (EEG) signals and thermal photos of the participant’s face were recorded for further analysis. In every experiment, 60 affective stimuli images varying in valence and
arousal ranges, together with neutral elements, were displayed in 30 minutes. During every experiment, 14 channels EEG signals in EDF format and around 160 thermal images in 320*240 pixel digital format were recorded.
3.4 Application
In this section, we describe our designed application architecture based on Model-View-Control (MVC) framework, how the components interact, and the machine learning algorithms applied in the main functions.
3.4.1 Application Architecture
Figure 22. Thermal Emotion Detection Application Architecture.
Figure 22 illustrates the architecture of Thermal Emotion Detection Application based on the Model-View-Controller (MVC) framework. The related classes and actions were grouped in three types of component as below.