HAL Id: hal-02347673
https://hal.umontpellier.fr/hal-02347673
Submitted on 27 Nov 2020
HAL is a multi-disciplinary open access
archive for the deposit and dissemination of
sci-entific research documents, whether they are
pub-lished or not. The documents may come from
teaching and research institutions in France or
abroad, or from public or private research centers.
L’archive ouverte pluridisciplinaire HAL, est
destinée au dépôt et à la diffusion de documents
scientifiques de niveau recherche, publiés ou non,
émanant des établissements d’enseignement et de
recherche français ou étrangers, des laboratoires
publics ou privés.
(Rodentia: Muridae) is a polytypic subspecies
Hassan Rajabi-Maham, Annie Orth, Roohollah Siahsarvie, Pierre Boursot,
Jamshid Darvish, François Bonhomme
To cite this version:
Hassan Rajabi-Maham, Annie Orth, Roohollah Siahsarvie, Pierre Boursot, Jamshid Darvish, et al..
The south-eastern house mouse Mus musculus castaneus (Rodentia: Muridae) is a polytypic
sub-species. Biological Journal of the Linnean Society, Linnean Society of London, 2012, 107 (2),
pp.295-306. �10.1111/j.1095-8312.2012.01957.x�. �hal-02347673�
The south-eastern house mouse Mus musculus
castaneus (Rodentia: Muridae) is a polytypic subspecies
HASSAN RAJABI-MAHAM
2, ANNIE ORTH
1, ROOHOLLAH SIAHSARVIE
1,3,
PIERRE BOURSOT
1, JAMSHID DARVISH
3and FRANÇOIS BONHOMME
1*
1
Institut des Sciences de l’Evolution, ISEM, CNRS UMR 5554, CC 063, Université Montpellier 2, Place E. Bataillon, 34095 Montpellier, France
2Department of Animal Biology, Faculty of Biological Sciences, Shahid Beheshti University, G.C., velenjak, Tehran 19839-63113, Iran
3Rodentology Research Department, Ferdowsi University of Mashhad, Mashhad 91775-1436, Iran
Received 13 March 2012; revised 2 May 2012; accepted for publication 2 May 2012
Accurate knowledge of the biogeographic history and precise characterization of the genetic make-up of a taxon are essential to investigate speciation processes and achieve sound evolutionary comparisons. A case in point is the house mouse Mus musculus and its three parapatric subspecies, which have become a model for such studies. However, although Mus musculus domesticus and Mus musculus musculus constitute genetically well-characterized homogeneous entities, the case of Mus musculus castaneus remains poorly documented. Using mtDNA control region variation in a sample of 402 individuals, covering much of the distribution range of this subspecies, we identify four haplogroups that show largely non-overlapping geographic distributions. They appear to have undergone post-Neolithic expansions, presumably through commensalism with humans, but exhibit a much more ancient divergence. These results point towards a strong past subdivision and a vicariant origin of the different haplogroups, with each retaining a subfraction of the total variability. The genomic consequences of this spatial heterogeneity on the present taxonomic partition will have to be appraised, and may challenge the use of
this subspecies as a single entity in evolutionary studies. © 2012 The Linnean Society of London, Biological
Journal of the Linnean Society, 2012, 107, 295–306.
ADDITIONAL KEYWORDS: commensalism – mitochondrial haplogroups – phylogeography – quaternary vicariance – range expansion – secondary admixture – South Asia – taxonomy.
INTRODUCTION
Although the house mouse Mus musculus has been a fundamental laboratory model for more than a century, its natural populations remained relatively poorly described for decades. Yet, M. musculus is cer-tainly one of the first taxa that became technically amenable to gene diversity studies over sufficiently large samples. For instance, allozymes were well-characterized in some of its populations as early as 1969, and the analysis of mitochondrial DNA varia-tion has been pervasive since 1978. Despite these advantages, M. musculus is not the best-known
mammal species as far as phylogeography is con-cerned, and there are many grey zones that remain to be explored. This is somewhat unfortunate, given the attention bestowed on the important role played by this species as a model in various fields such as immunology, speciation, or genome evolution (Baines & Harr, 2007; Geraldes et al., 2008; Halligan et al., 2010; Yang et al., 2011).
Historically, the image that has slowly emerged from studies on the taxonomic status, origin, and interrelationships of the various components of M. musculus, is that of a taxon with at least three main subspecies: Mus musculus domesticus; Mus musculus musculus; and Mus musculus castaneus (Boursot et al., 1993; Prager, Orrego & Sage, 1998; Guénet & Bonhomme, 2003; Geraldes et al., 2008;
*Corresponding author. E-mail: bonhomme@univ-montp2.fr
Biological Journal of the Linnean Society, 2012, 107, 295–306. With 3 figures
Bonhomme et al., 2011; Yonekawa et al., 2012). Among these, M. m. castaneus (Waterhouse, 1842; Philippines) is considered as more polymorphic, with a larger effective population size, and as having retained more ancestral polymorphisms than the other two subspecies (e.g. Phifer-Rixey et al., 2012). It is now established that the distribution of these three taxa has considerably expanded into a worldwide distribution from the centre of origin through its association with humans during the Neolithic. Nev-ertheless, although the genetic make-up and origin of the well-characterized M. m. domesticus in the west, and to a lesser extent M. m. musculus in the east, is becoming reasonably well documented (Duvaux et al., 2011), that of M. m. castaneus and the populations in the centre of the original species range, believed to be located somewhere between the north of the Indian subcontinent and the adjacent regions of Iran and Afghanistan (Boursot et al., 1996; Din et al., 1996, but see Prager et al., 1998), is far from completely elucidated. The populations from these places, some-times called ‘central’ populations, are collectively more diverse than are either M. m. domesticus or M. m. musculus. This is attested by a higher hetero-zygosity rate for various markers such as allozymes, simple sequence repeats (SSRs), or nuclear gene sequences (Din et al., 1996; Bonhomme et al., 2007; Geraldes et al., 2008; Halligan et al., 2010), as well as by the diversity of the mitochondrial lineages present (Boursot et al., 1993; Boissinot & Boursot, 1997; Prager et al., 1998; Terashima et al., 2006). Neverthe-less, the geographic origin and possible partitioning of this diversity remains largely unknown.
Whereas M. m. domesticus or M. m. musculus often show reciprocal mitochondrial monophyly, this is far from being the case for the matrilines found in the centre of the species range, which were designated as ‘oriental lineages’ by Boursot et al. (1996) and Boissi-not & Boursot (1997). Prager et al. (1998) preferred to use the name ‘M. (m.) castaneus’ for the populations harbouring those lineages, while noting at the same time that the often invoked but poorly sampled Mus (musculus) bactrianus could be a valid taxon or a local form of M. m. castaneus in the western part of its range. Subsequent literature dealing with variation in M. musculus mainly ignored the taxonomical problem posed by the genetic heterogeneity of the populations in the centre of its range, and almost invariably referred to the existence of the domesticus, musculus, and castaneus trio without further ques-tion as to its validity.
In the present work, we extend the description of the matrilines found in the ‘central populations’ by analysing the mitochondrial DNA (mtDNA) control region in a sample of 402 individual sequences origi-nating from Iran to China through Pakistan and
India, but also from more remote locations such as Kenya and New Zealand. The results show that at least three well-differentiated clades (hereafter called haplogroups) exist in the so-called M. m. castaneus subspecies and central populations. These lineages probably correspond to geographically defined iso-lates, but human-mediated transport has probably triggered a sensible degree of admixture. Providing a better account of the evolution of lineages that origi-nated in a region of complex geomorphology is one further step towards unravelling the key factors involved in the biogeographical history of the whole species.
MATERIAL AND METHODS ORIGIN OF SAMPLES AND DNA EXTRACTION
A total of 285 mice from Iran, Pakistan, India, China, Thailand, and Kenya were included in this study. The sample sizes and geographical coordinates are given in Table 1 and are presented in Figure 1. Samples from Iran were collected during the years 2004–2009, under the supervision of the Rodentology Research Department of Ferdowsi University of Mashhad, with regular snap-traps used for pest control. Other samples were issued from the ISE-Montpellier DNA collection, established between 1988 and 2002. The skulls of most of these specimens have also been
included in the morphological characterization
reported in Siahsarvie et al. (2012), and are deposited in the osteological collections of these two institu-tions. Tissues were stored in 70% ethanol or deep-frozen prior to standard phenol–chloroform DNA extraction. A 931-bp section of the mitochondrial control region was sequenced with exactly the same protocol as described in Rajabi-Maham, Orth & Bon-homme (2008). The sequence primers were located at
position 15 378 (3′) and 41 (5′) of the M. musculus
strain C57BL/6J mtDNA sequence (Bayona-Bafaluy et al., 2003). Sequences are deposited in GenBank under accession numbers JN416649–JN416769. Addi-tionally, 106 sequences were retrieved from GenBank, stemming primarily from a handful of earlier publi-cations, as shown in Table 1, and 11 others were kindly provided by B. Harr (Max Planck Institut, Ploen, Germany). We used 16 haplotype sequences
referable to M. m. domesticus, M. m. musculus
(including Mus musculus molossinus), and to the mitochondrial lineage known as Mus musculus gen-tilulus (Prager et al., 1998) as possible out-groups. Mus musculus domesticus, the worldwide mito-chondrial variation of which is now rather well documented (see, for instance, Boursot et al., 1996; Rajabi-Maham et al., 2008; Searle et al., 2009a, b; Jones et al., 2011, and references therein), was rep-resented by a set of sequences belonging to eight
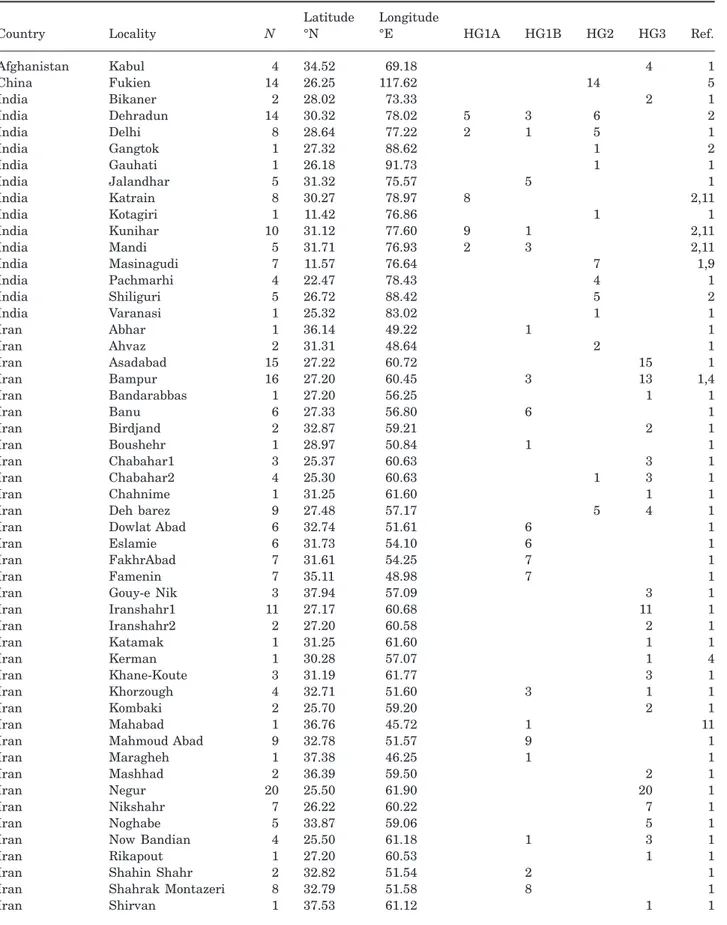
Table 1. Sampling localities, geographical coordinates, and haplogroup assignation of the 402 sequences referable to Mus
musculus castaneus analysed in this study
Country Locality N
Latitude °N
Longitude
°E HG1A HG1B HG2 HG3 Ref.
Afghanistan Kabul 4 34.52 69.18 4 1 China Fukien 14 26.25 117.62 14 5 India Bikaner 2 28.02 73.33 2 1 India Dehradun 14 30.32 78.02 5 3 6 2 India Delhi 8 28.64 77.22 2 1 5 1 India Gangtok 1 27.32 88.62 1 2 India Gauhati 1 26.18 91.73 1 1 India Jalandhar 5 31.32 75.57 5 1 India Katrain 8 30.27 78.97 8 2,11 India Kotagiri 1 11.42 76.86 1 1 India Kunihar 10 31.12 77.60 9 1 2,11 India Mandi 5 31.71 76.93 2 3 2,11 India Masinagudi 7 11.57 76.64 7 1,9 India Pachmarhi 4 22.47 78.43 4 1 India Shiliguri 5 26.72 88.42 5 2 India Varanasi 1 25.32 83.02 1 1 Iran Abhar 1 36.14 49.22 1 1 Iran Ahvaz 2 31.31 48.64 2 1 Iran Asadabad 15 27.22 60.72 15 1 Iran Bampur 16 27.20 60.45 3 13 1,4 Iran Bandarabbas 1 27.20 56.25 1 1 Iran Banu 6 27.33 56.80 6 1 Iran Birdjand 2 32.87 59.21 2 1 Iran Boushehr 1 28.97 50.84 1 1 Iran Chabahar1 3 25.37 60.63 3 1 Iran Chabahar2 4 25.30 60.63 1 3 1 Iran Chahnime 1 31.25 61.60 1 1
Iran Deh barez 9 27.48 57.17 5 4 1
Iran Dowlat Abad 6 32.74 51.61 6 1
Iran Eslamie 6 31.73 54.10 6 1
Iran FakhrAbad 7 31.61 54.25 7 1
Iran Famenin 7 35.11 48.98 7 1
Iran Gouy-e Nik 3 37.94 57.09 3 1
Iran Iranshahr1 11 27.17 60.68 11 1 Iran Iranshahr2 2 27.20 60.58 2 1 Iran Katamak 1 31.25 61.60 1 1 Iran Kerman 1 30.28 57.07 1 4 Iran Khane-Koute 3 31.19 61.77 3 1 Iran Khorzough 4 32.71 51.60 3 1 1 Iran Kombaki 2 25.70 59.20 2 1 Iran Mahabad 1 36.76 45.72 1 11
Iran Mahmoud Abad 9 32.78 51.57 9 1
Iran Maragheh 1 37.38 46.25 1 1
Iran Mashhad 2 36.39 59.50 2 1
Iran Negur 20 25.50 61.90 20 1
Iran Nikshahr 7 26.22 60.22 7 1
Iran Noghabe 5 33.87 59.06 5 1
Iran Now Bandian 4 25.50 61.18 1 3 1
Iran Rikapout 1 27.20 60.53 1 1
Iran Shahin Shahr 2 32.82 51.54 2 1
Iran Shahrak Montazeri 8 32.79 51.58 8 1
Iran Shirvan 1 37.53 61.12 1 1
haplogroups chosen to illustrate the variability within this indisputably monophyletic subspecies.
PHYLOGENETIC AND MISMATCH ANALYSES
Sequences spanning positions 15 430–16 286 were considered for all analyses in this study. Alignment was performed with MAFFT 5 (Katoh et al., 2005) using default options. Out-group sequences were pasted and manually edited with BIOEDIT (Hall,
1999). The complete alignment, together with
GenBank accession numbers, is presented in Supple-mentary Figure S1. The MEGA 5.0 software package
(Tamura et al., 2011) was used to calculate the basic diversity parameters among and within populations according to the maximum composite likelihood sub-stitution model, with pairwise deletion and unequal rates among sites. A maximum likelihood tree was obtained from PHYML 3.0 (Guindon & Gascuel, 2003) with the Generalised Time Reversible (GTR) muta-tion model and a transimuta-tion/transversion ratio of 5.95, a gamma correction of 0.645, and a proportion of invariable sites of 0.748 and 4 invariant categories, as estimated by the program. Node support was esti-mated with the approximate likelihood ratio test (aLRT) method (Anisimova & Gascuel, 2006). Four
Table 1. Continued
Country Locality N
Latitude °N
Longitude
°E HG1A HG1B HG2 HG3 Ref.
Iran Takht-e-edalate 1 31.32 61.72 1 1 Iran Tehran1 3 35.81 51.43 3 1 Iran Tehran2 3 35.70 51.42 3 1,4 Iran Zabol 3 31.25 61.60 3 1 Iran Zanjan 9 36.67 48.48 9 1 Kenya Bamburi 2 -3.95 39.73 2 1 Kenya Bombolulu 5 -4.02 39.70 5 1 Kenya Eastland 2 -1.29 36.86 2 1 Kenya Nairobi 4 -1.31 36.74 4 1 Kenya Kalokol 1 3.52 35.83 1 1 Kenya Kangemi 13 -1.27 36.74 13 1 Kenya Kibera 3 -1.32 36.78 3 1 Kenya Mtwapa 3 -3.95 39.74 3 1 Kenya Shanzu 4 -3.97 39.75 4 1
New Zealand Borland 1 -45.83 167.50 1 8
New Zealand Chatham Island 1 -43.83 176.50 1 8
New Zealand Grebe 1 -45.83 167.33 1 8
New Zealand Karori 1 -41.33 174.67 1 8
New Zealand S Fiordland 2 -46.17 167.67 2 8
New Zealand Taiaroa 1 -45.83 174.67 1 8
Pakistan Awaran 1 26.45 65.22 1 7 Pakistan Gujarkhan 1 33.26 73.30 1 1 Pakistan Gwadar 1 25.12 62.32 1 7 Pakistan Islamabad 2 33.72 73.06 1 1 1 Pakistan Jaba 1 34.78 72.35 1 7 Pakistan Nodiz 1 26.05 62.77 1 7 Pakistan Pasni 1 25.25 63.47 1 7 Pakistan Rawalpindi 9 33.60 73.04 1 5 3 1 Pakistan Tahmasapabad 2 33.60 73.10 1 1 1 Pakistan Ushu 1 35.53 72.65 1 7
Taiwan Hsinpu & Taichung 28 22.93 120.57 20 8 5
Taiwan Taiwan 12 23.20 120.18 7 5 10
Thailand Pathum Thani 12 13.95 100.57 12 1,9
Thailand Thonburi 2 13.72 100.48 2 6,3
This study: 2. Baines & Harr, 2007; 3. Goios et al., 2007; 4. Gündüz et al., 2000; 5. Geraldes et al., 2008; 6. Prager et al., 1996; 7. Prager et al., 1998; 8. Searle et al., 2009b; 9. Voolstra et al., 2007b; 10. Yu, H.-T. & Yang, S.-T., unpubl. data; 11. Harr, B., unpubl. data.
haplogroups with high aLRT support were identified. Mismatch distribution (MMD) analyses were carried out with ARLEQUIN (Excoffier, Laval & Schneider, 2005) for each haplogroup separately using goodness-of-fit tests based on the sum of squared deviations and raggedness index (Harpending, 1994), see also Supplementary Figure S3. Sites with plurinucleotidic indels were considered as equivalent to a single point
mutation. The parameter t = 2mt (population
expan-sion time scaled by the mutation rate) was estimated from mismatch distribution analysis, when applica-ble, under the two models implemented in ARLE-QUIN (spatial and demographic expansions). The
standard deviation of thet estimates was deduced as
half the width of the 95% confidence interval, esti-mated by a 1000 bootstrap procedure.
GEOGRAPHICAL REPRESENTATION OF GENETIC VARIATION
In order to avoid arbitrary groupings of sampling locations, the estimated density distribution over a
grid of 120¥ 110 points, representing the
geographi-cal area under study, was obtained for each of the three main haplogroups (HG1A and HG1B were grouped together) using the kriging function of the
‘fields’ package under R (R Development Core Team, 2011). Basically, for large numbers of irregularly spaced observations, this package computes the spatial predictions of missing values using a Gaus-sian covariance function, estimated through the itera-tive resolution of a large linear system. Observations were weighted by the number of individuals sampled at each location relative to the total. The density matrix for each haplogroup was then attributed to one of the basic red, green, or blue (RGB) colours with the rgb function (grDevices), and the three grids were superimposed to produce a single false-colour image.
RESULTS
THREE DIVERGENT LINEAGES IN
MUS MUSCULUS CASTANEUS
Figure 2 shows the maximum likelihood tree obtained for the 402 sequences corresponding to 140 haplo-types (See also Supplementary Figure S2). Three lineages encompassing four haplogroups, hereafter designated as HG1A, HG1B, HG2, and HG3, could be identified, with approximate aLRT values of 0.81, 0.91, 0.90, and 0.76, respectively, and with HG1A and
Figure 1. Sampling localities for the 402 Mus musculus specimens used in this study. The corresponding sample size and coordinates are presented in Table 1.
HG1B being grouped together, albeit with a lower aLRT value (0.73). Interestingly, HG3 appears as slightly more divergent from the other two haplo-groups, whereas HG2 is closest to M. m. musculus, M. m. domesticus, and M. m. gentilulus (aLRT
support 0.82). Although graphically rooted by
M. m. domesticus, M. m. musculus, and M. m. gentilu-lus, which are themselves clustered with an aLRT support of 0.85, the precise rooting of the tree is not attainable because the D-loop is too divergent in more distantly related species, and it is difficult to assess whether the so-called ‘castaneus’ matrilines form a monophyletic group or not. However, and this is what matters here, there is no long branch separating castaneus from the rest, suggesting that the onset of the divergence of these three lineages probably occurred in a relatively short time. It is interesting to note that a large 76-bp indel between position 15 430 and 15 506 is fixed in HG1A, HG1B, and HG2, and is polymorphic but at low frequency within HG3. This indel is colinear with the 75-bp repeat described by Prager, Tichy & Sage (1996) as polymor-phic within M. m. musculus, denoting a homoplasy-prone deletion/duplication mechanism.
The four columns preceding the last of Table 1 indicate the distribution of HGs within each sample. Table 2 displays the molecular diversity parameters for each of the four haplogroups. The average nucle-otide divergence was 1.14% on the global sample. Each clade is separated from the others by relatively large net nucleotidic divergences (average 0.91% among the four haplogroups only, for an average net divergence of 1.55% with the musculus clade and 3.06% with domesticus/gentilulus. If we adopt an
intersubspecific substitution rate of 10% nucleotide–1
Myr–1 (Prager, Boursot & Sage, 1997) for the D-loop,
we obtain at face value an average age of 45 500 years for the most recent common ancestor (MRCA) of the three lineages, which is clearly much earlier than the end of the last glacial period. Now, if we consider that the nucleotide variability within each clade originated in separate populations, we can apply the mismatch analysis within each of them. The sudden expansion hypothesis (either spatial or demographic) could not be rejected, indicating that each haplogroup under-went a recent expansion (Supplementary Figure S3;
Table 2). The averaget values estimated by the MMD
data analysis were 5.6, 3.31, 0.82, and 6.14 for HG1A, HG1B, HG2, and HG3, respectively. These values may be translated into times of expansion for each haplogroup, this time with an intrasubspecific
muta-tion rate of 40% site–1Myr–1, as proposed by
Rajabi-Maham et al. (2008), rather than the interspecific rate used above. The estimated times were 8000, 4750, 1200, and 8850 years, respectively. A Student’s
unpaired t-test (bilateral, with n1+ n2– 2 d.f.) shows
that thet value of HG2 is significantly smaller than
the other three (P< 0.001), whereas among the latter,
HG1A and HG3 could not be distinguished.
Interest-ingly, the highest t value, obtained for HG3, was
significantly smaller than that estimated with exactly 90 81 91 73 82 76 69 99 98 72 85 0.05
HG2
HG1B
HG1A
HG3
gentilulus domesticus musculusFigure 2. Maximum likelihood tree for 402 mtDNA (D-loop) sequences referred to Mus musculus castaneus, and 16 haplotypes of Mus musculus musculus, Mus mus-culus molossinus, Mus musmus-culus domesticus, and Mus musculus gentilulus, used as out-groups. Branch robust-ness, as indicated by approximate likelihood ratio test (aLRT) values of over 50%, is shown. Haplogroups 1A, 1B, 2, and 3 are described in the text. The grey, yellow, and purple colours designate individual sequences sampled in Pakistan+ Afghanistan, Iran, and India, respectively. White circles are for all other localities. Note that the white circles inside HG3 solely originate from Taiwan. Scaled by percentage nucleotidic divergence.
the same method and molecule for the global expan-sion of M. m. domesticus (t = 8.72) by Bonhomme et al. (2011).
AGEOGRAPHIC DISTRIBUTION FOR THE THREE MAJOR LINEAGES
Figure 3 shows the false-colour image of the esti-mated density distribution of the three major clades, encompassing the four haplogroups. The Chinese, Taiwanese, Kenyan, and New-Zealand samples were omitted from this map because of low sampling density too far away from the main data set to provide a reliable kriging value. The association of
some haplogroups with geographical regions is
obvious: for instance, HG3 (blue) corresponds almost entirely to eastern Iran, along with some sequences from nearby Afghanistan and Indo-Pakistan, and more surprisingly from Taiwan (shown in Table 1). HG2 (green) may be found in Pakistan and India, but is also found in Kenya, China, Taiwan, Thailand, and New Zealand. Although HG1A and HGIB are not individualized in Figure 3 (red), HG1A only encom-passes matrilines from the northernmost corner of India and Pakistan, whereas HGIB predominates in central and north-west Iran, but is also present in Indo-Pakistan (Table 1; refer to the leaves of the tree in Supplementary Figure S3 for the precise location of the sequences in each haplogroup).
DISCUSSION
GEOGRAPHIC ORIGIN OF THE THREE MAJOR LINEAGES
It is tempting to propose that the core geographical distribution described above for each of the three lineages constitutes the cradle of origin where they would have survived during an ancient period of isolation, possibly linked with the last glaciation. Under this hypothesis, putative separate refuges would have existed for the mice now present in eastern Iran, Afghanistan, and south Pakistan (HG3), north-east India (HG2), and for HG1A an area essen-tially covering the Himalayan foothills of north-west India. The case of HG1B that has a disjoint distribution (central /north-west Iran, and Pakistan) is puzzling, because the sequences from Iran and Indo-Pakistan in this haplogroup are not only geo-graphically but also phylogenetically separate, as is clearly visible in Figure 2. Note that a recent report shows that castaneus-like subfossil skulls have been found in a site near Isfahan (central Iran), and
are attributed to the mid-Palaeolithic, 30 000BC
(Shabani et al., 2010). Early human influence is thus likely to have played a role in the geographical duality of this haplogroup. It should be remembered that post-glacial movements are often not a simple
T able 2. Genetic diversity indices of four Mus musculus castaneus D-loop haplogroups (HGs): N (sample size), h (haplotype number), p (nucleotide diversity), Hd (haplotype diversity), M (mean number of mismatch), expansion parameter t= 2 m t, and various statistics from the mismatch distribution analysis under two dif ferent models HGs Nh Hd Pi M Demographic expansion Spatial expansion t mean t t 2.5% t 97.5% SSD PR P t t 2.5% t 97.5% SSD PR P HG1A 28 20 0.979 0.00458 5.59 6.00 3.02 8.16 0.0012 0.90 0.01 1 0.82 5.21 3.02 7.62 0.0017 0.82 0.01 1 0.89 5.61 HG1B 98 47 0.965 0.00634 6.30 3.40 1.17 12.39 0.0047 0.37 0.010 0.43 3.22 1.36 8.02 0.0044 0.52 0.010 0.59 3.31 HG2 140 30 0.028 0.00202 1.77 0.80 0.09 3.77 0.0021 0.60 0.042 0.64 0.83 0.43 3.34 0.0021 0.49 0.042 0.63 0.82 HG3 136 42 0.933 0.00608 5.85 6.20 3.66 8.00 0.0069 0.06 0.023 0.05 6.07 3.42 7.87 0.0036 0.69 0.023 0.57 6.14 HG1B_ Iran 77 35 0.0948 0.00465 4.23 4.50 2.70 5.73 0.0043 0.17 0.024 0.24 4.47 2.29 5.78 0.0031 0.53 0.024 0.46 4.49 Estimates of expansion times for each haplogroup under the two expansion models implemented in ARLEQUIN (demographic, expansion of a single deme of g rowing size; spatial, geographical spread of new demes of equal size); N , number of individuals; h, number of haplotypes; Hd , haplotypic diversity; Pi, nucleotidic diversity; M , mean observed mismatch number; t, age of expansion in mutation unit, together with percentiles estimated by 1000 bootstraps; SSD, model fit (sum of squared deviation with its P value); R , raggedness (observed, with its P value conditioned by the corresponding model).
expansion from refugia into wider areas, but may imply more complex trajectories tracking a transitory reopening of favourable habitats. In the case of M. musculus, the situation is even more complex if empty territories became available through commen-salism. In this context, the disparity in secondary admixture between haplogroups is noteworthy: HG2 is practically the only one to have been exported to many other places in the world, with the notable exception of the HG3 matrilines in Taiwan, whereas HG1A and HG1B are much more geographically restricted. Note that the Iranian locality of Chabahar, a large seaport at the entrance of the Persian Gulf, and samples from Pakistan and India contain sequences belonging to three and four haplogroups, respectively, illustrating places where secondary admixture is more frequent.
DIVERGENCE TIME
In addition, to make use of the well-documented evo-lutionary rate of mitochondrial cytochrome b (cyt-b), we retrieved the 28 non-musculus or non-domesticus M. musculus cyt-b sequences available in GenBank (many of them actually labelled M. m. molossinus). When aligned with sequences of the latter two sub-species, three types of highly divergent castaneus
sequences emerge with high bootstrap values
(Supplementary Figure S4). One of these is repre-sented by a single sequence from Kathmandu (Nepal), another one by two sequences coming from Taiwan and north-eastern Iran, and the 25 others stemming mostly from the castaneus type that cluster within M. m. molossinus from Hokkaido Island (Terashima et al., 2006), but also Indonesia and Thailand. It is tempting to consider that those three lineages match the lineages that we have defined from the D-loop: the one from Nepal would correspond to our HG1A; the one from Taiwan, termed group CAS I, would match our HG3; whereas the last group, termed group CAS II, would be HG2. The geographical sampling of Terashima et al. (2006) did not include localities where HG1B could be found. The average nucleotide divergence over 1140 cyt b sites among the three castaneus lineages amounted to 2.53% (7.98%) to 3.05% (11.46%) between domesticus and castaneus to 2.87% (9.66%) between musculus and castaneus, and to 2.38% (7.98%) between domesticus and musculus. The values between parentheses provide the diver-gence values for the third codon position only. These results suggest that the onset of these divergences would match several quasi-simultaneous vicariance events. Interestingly, Nabholz, Glemin & Galtier (2009) have recently re-evaluated the phylogenetic
Figure 3. False-colour image of the distribution of the three major castaneus mitochondrial lineages obtained by kriging the matrix of their frequency at each location (see text). Red, green, and blue correspond to the haplogroups HG1A+ HG1B, HG2, and HG3, respectively. Note that red dots in Pakistan and India correspond primarily to HG1A, but not exclusively so, whereas those in Iran belong only to HG1B, as is visible in Figure 2.
substitution rate of the third codon position of cyt-b in many mammalian orders and genera, including Mus. They found a per lineage substitution rate of 0.22
substitutions of the third codon–1Myr–1 in Mus
indutus, and 0.098 in Rattus norvegicus. If the rate calculated for M. indutus holds for M. musculus, the values we estimated would thus roughly correspond to a 180 000-year-old divergence among the castaneus clades. This figure would be even higher if the M. musculus rate is closer to that of Rattus, but a higher rate than that in M. indutus cannot be ruled out. The large discrepancy between cyt-b and D-loop divergence estimates (180 000 and 45 000 years, respectively) demonstrates the relative imprecision of molecular dating, arising from a combination of features: high homoplasy, resulting in important saturation phenomena; an underestimation of the substitution rate for the D-loop; and the large inter-taxa fluctuation of these rates, as illustrated in Nabholz et al.(2009). Whatever the true rates, our results probably point towards vicariance events linked with at least the last glacial event (beginning c. 90 000 years ago), during which subpopulations would have survived in favourable refugia on the southern slopes of the almost continuous mountain range that expands from the Caucasus to the Hima-layas, from north-western Iran to north-eastern India.
CONGRUENCE WITH OTHER MARKERS
Little information is available yet, but on a partially overlapping sample Rajabi-Maham et al. (unpubl. data) have shown that two different subtypes of the so-called musculus Y chromosome were associated with Iranian mice, mostly pertaining to mtDNA HG1B and HG3, with an almost exact match between the Y chromosome subtype and mtDNA haplogroups in the limited sample analysed by these authors. These Y chromosome variants appear restricted to the Iranian plateau, thus reinforcing the idea of a long-term isolation in this area. On the other hand, a widespread so-called castaneus Y chromosome type is to be found in Indo-Pakistan and elsewhere in south-east Asia, thus predominately associated with HG2, and probably originating from the Indian subconti-nent (Rajabi-Maham et al., unpubl. data).
The Y chromosome and mtDNA are two elements with similar and small effective sizes (Ne/2 or less if they are submitted to recurrent selection, or if there is a sex-linked differential variance in reproductive success). They are thus expected to attain monophyly more rapidly than recombining and bisexually trans-mitted autosomes. In the study of gene variation at eight loci on mouse chromosome 8, Nunome et al. (2010) indicated that two haplotypic combinations
existed in south-east Asian castaneus, but their study included no mice of Iranian origin. On the other hand, we had access to the nuclear genotypes of 15 wild individuals from Iran, Afghanistan, Pakistan, and India, together with 12 reference samples belonging to M. m. domesticus and M. m. musculus (five and seven, respectively). These mice were typed for 7810 single nucleotide polymorphisms (SNPs; F. Pardo de la Villena & J. Didion, pers. comm.) by the MUGA DNA chip (Collaborative Cross Consortium, 2012). From this data set we extracted 226 positions that were identically monomorphic in domesticus and musculus, but were variable among the 15 castaneus samples, in order to limit a possible effect of second-ary exchanges or ascertainment bias. The average percentage nucleotidic diversity between the cas-taneus samples was 0.29, with the most distant indi-viduals being those from central Iran (HG1B; Yazd) and those from southern India (HG2; Masinagudi). The individuals possessing HG3 or HG1A as well as HGIB from Pakistan and northern India clustered in between, as shown on the tree in the Supplementary Figure S5.
Taken as a whole, these results partially support the divergence patterns evidenced by the matrilines, and suggest that supplementary information from nuclear genes are not likely to change the present picture much, as animals from central Iran, which have an HG1B of their own, are also quite distinct from a nuclear standpoint from those of south-east Iran harbouring only HG3. Within the so-called cas-taneus group there are signatures of evolution in isolation in a distant past, with a clear-cut difference between the eastern and the western regions of the study zone. Interestingly, the almost complete spatial segregation of HG1 and HG3 on one hand and HG2 on the other fits rather well with the morphological characterization recently performed by Siahsarvie et al. (2012) on a partially overlapping sample, according to which the mice from the central Iranian plateau are clearly differentiated from those of Indo-Pakistan, as already suggested by Darvish (2008) from a more limited sample.
EXPANSION
It has been amply demonstrated for M. m. domesticus that most if not all of its matrilineal diversity is linked to recent expansion linked to commensalism with humans (reviewed in Bonhomme & Searle, 2012), which dates back to the first Pleistocene warming, some 12 000 years ago. Here, all four hap-logroups also show signs of recent expansion. Inter-estingly, this expansion took place at somewhat later times than for M. m. domesticus, with HG1B being the haplogroup harbouring the oldest signature. One
can thus infer that the encounter between local M. musculus representatives and Neolithic humans having facilitated their expansion may have occurred later in this region (Djamali et al., 2009) than further west in the Fertile Crescent. This is even more evident for the mice carrying HG2, for which the onset of expansion is dated to c. 1200 years ago); conversely, it is practically the only haplogroup to have been transported by humans further east, and to all the other locations around the Indo-Pacific where M. m. castaneus is currently found.
NOMENCLATURE
If we thus take for granted that present-day ‘castaneus’ stem from at least three isolates, if not four, this raises questions as to where exactly they originate from and what is their taxonomic status. Marshall (1986) men-tions at least 13 Latin names for M. musculus in the region covered by our study, and long-standing ques-tions remain as to the validity of some of them, such as M. m. bactrianus, the type of which is from Kandahar in Afghanistan. From our data (samples from Zabol, in the same geomorphological basin as Kandahar, and from Kabul further north), it may be argued that a mtDNA HG3 originated in this part of the world, and could thus correspond to an original ‘bactrianus’ clade if ‘bactrianus’ is a valid name with respect to anteri-ority. Now, do mice harbouring HG3 constitute a separate subspecies? Given the degree of admixture detected in the mtDNA sequences (HG3 is, for example, well represented in Taiwan, together with HG2), this issue cannot presently be solved. However, mtDNA does not tell us much about the existence of the eventual barriers to gene flow, as prevails in the well-studied domesticus–musculus interaction, and the study of many nuclear genes over a large sample would be needed to evaluate this possibility. If the admixture of nuclear genes is frequent, the three oriental clades would then be remnants of an ancient subspeciation event that is in the process of being completely erased, and it would be thus wise to retain the single ‘castaneus’ denomination. Alternatively, if subsequent analyses identify under-dominant interac-tions impeding gene flow between these clades [i.e. in narrow hybrid zones, such as in north-eastern Iran between Birdjand (HG3) and Mashhad (bona fide M. m. musculus); see Darvish, Orth & Bonhomme, 2006], a revision of the taxonomy of M. musculus may once more be warranted, and may resuscitate M. m. bactrianus Blyth, 1846 (Kandahar), Mus mus-culus urbanus Hodgson, 1845 (Kathmandu), Mus musculus gerbillinus Blyth, 1853 (Punjab), or Mus musculus homourus Hodgson, 1845 (Nepal), according to the anteriority rule and the availability of type specimens, which is far from being assured.
ACKNOWLEDGEMENTS
Sequencing was performed on the platform
«Génomique Environnementale» of Labex CeMEB (Montpellier). This work was financed principally by recurrent annual funding from the Centre national de la recherche scientifique (CNRS) to FB. It is ISE-M contribution no. 2012-046. The authors are indebted to Bettina Harr for kindly providing unpublished sequences from Indian samples, as well as to Fern-ando Pardo Manuel de Villena and John Didion for the MUGA genotyping. Janice Britton-Davidian is gratefully acknowledged for insightful comments and corrections of the article.
REFERENCES
Anisimova M, Gascuel O. 2006. Approximate
likelihood-ratio test for branches: a fast, accurate, and powerful alter-native. Systematic Biology 55: 539–552.
Baines JF, Harr B. 2007. Reduced X-linked diversity in
derived populations of house mice. Genetics 175: 1911– 1921.
Bayona-Bafaluy MP, Acin-Perez R, Mullikin JC, Park JS, Moreno-Loshuertos R, Hu P, Perez-Martos A, Fernandez-Silva P, Bai Y, Enriquez JA. 2003.
Revisit-ing the mouse mitochondrial DNA sequence. Nucleic Acids
Research 31: 5349–5355.
Boissinot S, Boursot P. 1997. Discordant phylogeographic
patterns between the Y chromosome and mitochondrial DNA in the house mouse: selection on the Y chromosome?
Genetics 146: 1019–1034.
Bonhomme F, Orth A, Cucchi T, Rajabi-Maham H, Catalan J, Boursot P, Auffray JC, Britton-Davidian J. 2011. Genetic differentiation of the house mouse around
the Mediterranean basin: matrilineal footprints of early and late colonization. Proceedings of the Royal Society
B-Biological Sciences 278: 1034–1043.
Bonhomme F, Rivals E, Orth A, Grant GR, Jeffreys AJ, Bois PR. 2007. Species-wide distribution of highly
polymor-phic minisatellite markers suggests past and present genetic exchanges among House Mouse subspecies. Genome
Biology 8: R80.
Bonhomme F, Searle JB. 2012. House mouse
phylogeogra-phy. In: Baird SJE, Macholán M, Munclinger P, Piálek J, eds. Evolution of the house mouse. Cambridge studies in
morphology and molecules: new paradigms in evolutionary biology macholan. New York, NY: Cambridge University
Press. (in press).
Boursot P, Auffray J-C, Britton-Davidian J, Bonhomme F. 1993. The Evolution of House Mice. Annual Review of
Ecology and Systematics 24: 119–152.
Boursot P, Din W, Anand R, Darviche D, Dod B, Von Deimling F, Talwar G, Bonhomme F. 1996. Origin and
radiation of the house mouse : mitochondrial DNA phylog-eny. Journal of Evolutionary Biology 9: 391–415.
Collaborative Cross Consortium. 2012. The genome
architecture of the collaborative cross mouse genetic refer-ence population. Genetics 190: 389–401.
Darvish J. 2008. Biosystematic approach to geographic
variations of house mouse group, Mus musculus L. 1766.
Iranian Journal of Animal Biosystematics 4: 31–58.
Darvish J, Orth A, Bonhomme F. 2006. Genetic transition
in the House Mouse Mus musculus of Eastern Iranian Plateau. Folia Zoologica 55: 349–357.
Din W, Anand R, Boursot P, Darviche D, Dod B, Jouvin-Marche E, Orth A, Talwar G, Cazenave P-A, Bonhomme F. 1996. Origin and radiation of the house
mouse : clues from nuclear genes. Journal of Evolutionary
Biology 9: 519–539.
Djamali M, de Beaulieu J-L, Miller N, Andrieu-Ponel V, Berberian M, Gandouin E, Lahijani H, Ponel P, Sal-imian M, Guiter F. 2009. A late Holocene pollen record
from Lake Almalou in NW Iran : evidence for changing land-use in relation to some historical events during the last 3700 years. Journal of Archaeological Science 36: 1346– 1375.
Duvaux L, Belkhir K, Boulesteix M, Boursot P. 2011.
Isolation and gene flow: inferring the speciation history of European house mice. Molecular Ecology 20: 5248– 5264.
Excoffier L, Laval G, Schneider S. 2005. Arlequin ver. 3.0:
an integrated software package for population genetics data analysis. Evolutionary Bioinformatics Online 1: 47–50.
Geraldes A, Basset P, Gibson B, Smith KL, Harr B, Yu HT, Bulatova N, Ziv Y, Nachman MW. 2008. Inferring
the history of speciation in house mice from autosomal, X-linked, Y-linked and mitochondrial genes. Molecular
Ecology 17: 5349–5363.
Goios A, Pereira L, Bogue M, Macaulay V, Amorim A. 2007. mtDNA phylogeny and evolution of laboratory mouse
strains. Genome Research 17: 293–298.
Guénet JL, Bonhomme F. 2003. Wild mice: an
ever-increasing contribution to a popular mammalian model.
Trends in Genetics 19: 24–31.
Guindon S, Gascuel O. 2003. A simple, fast and accurate
algorithm to estimate large phylogenies by maximum like-lihood. Systematic Biology 52: 696–704.
Gündüz I, Tez C, Malikov V, Vaziri A, Polyakov AV, Searle JB. 2000. Mitochondrial DNA and chromosomal
studies of wild mice (Mus) from Turkey and Iran. Heredity
84: 458–467.
Hall TA. 1999. BioEdit: a user-friendly biological sequence
alignment editor and analysis program for Windows 95/98/ NT. Nucleic Acids Symposium Series. 41: 95–98.
Halligan DL, Oliver F, Eyre-Walker A, Harr B, Keightley PD. 2010. Evidence for pervasive adaptive protein evolution
in wild mice. PLoS Genetics 6: e1000825.
Harpending HC. 1994. Infertility and forager demo-graphy. American Journal of Physical Anthropology 93: 385–390.
Jones EP, Jóhannesdóttir F, Gündüz I˙, Richards MB, Searle JB. 2011. The expansion of the house mouse into
north-western Europe. Journal of Zoology 283: 257–268.
Katoh K, Kuma K, Toh H, Miyata T. 2005. MAFFT version
5: improvement in accuracy of multiple sequence alignment.
Nucleic Acids Research 33: 511–518.
Marshall JT. 1986. Systematics of the genus mus. In: Potter
M, Nadeau JH, Cancro MP, eds. 12–18. The wild mouse in
immunology. New York: Springer.
Nabholz B, Glemin S, Galtier N. 2009. The erratic
mito-chondrial clock: variations of mutation rate, not population size, affect mtDNA diversity across birds and mammals.
BMC Evolutionnary Biology 9: 54. doi:
10.1186/1471-2148-9-54
Nunome M, Ishimori C, Aplin KP, Tsuchiya K, Yonekawa H, Moriwaki K, Suzuki H. 2010. Detection of
recombinant haplotypes in wild mice (Mus musculus) pro-vides new insights into the origin of Japanese mice.
Molecu-lar Ecology 19: 2474–2489.
Phifer-Rixey M, Bonhomme F, Boursot P, Churchill GA, Piálek J, Tucker PK, Nachman MW. 2012. Adaptive
evolution and effective population size in wild house mice.
Molecular Biology & Evolution. online April 3, 2012
doi:10.1093/molbev/mss105.
Prager E, Boursot P, Sage R. 1997. New assays for Y
chromosome and p53 pseudogene clines among East Hol-stein house mice. Mammalian Genome 8: 279–281.
Prager EM, Orrego C, Sage RD. 1998. Genetic variation
and phylogeography of central Asian and other house mice, including a major new mitochondrial lineage in Yemen.
Genetics 150: 835–861.
Prager EM, Tichy H, Sage RD. 1996. Mitochondrial DNA
sequence variation in the eastern house mouse, Mus
mus-culus: comparison with other house mice and report of a
75-bp tandem repeat. Genetics 143: 427–446.
R Development Core Team. 2011. R: a language and
environment for statistical computing. Available at: http:// www.R-project.org.
Rajabi-Maham H, Orth A, Bonhomme F. 2008.
Phyloge-ography and postglacial expansion of Mus musculus
domes-ticus inferred from mitochondrial DNA coalescent, from Iran
to Europe. Molecular Ecology 17: 627–641.
Searle JB, Jamieson PM, Gündüz I, Stevens MI, Jones EP, Gemmill CE, King CM. 2009b. The diverse origins of
New Zealand house mice. Proceedings of the Royal Society
B-Biological Sciences 276: 209–217.
Searle JB, Jones CS, Gündüz I, Scascitelli M, Jones EP, Herman JS, Rambau RV, Noble LR, Berry RJ, Gimenez MD, Johannesdottir F. 2009a. Of mice and
(Viking?) men: phylogeography of British and Irish house mice. Proceedings of the Royal Society B-Biological Sciences
276: 201–207.
Shabani M, Darvish J, Mashkour M, Ghasemzadeh F, Mirshamsi O. 2010. Contemporary and sub-fossil house
mice (Mus musculus Linnaeus, 1758) (Rodentia : Muridae) from Iran. Iranian Journal of Animal Biosystematics 6: 45–54.
Siahsarvie R, Auffray J-C, Darvish J, Rajabi-Maham H, Yu H-T, Agret S, Bonhomme F, Claude J. 2012. Patterns
of morphological evolution in the mandible of the house mouse Mus musculus (Rodentia: Muridae). Biological
Journal of the Linnean Society 105: 635–647.
Tamura K, Peterson D, Peterson N, Stecher G, Nei M, Kumar S. 2011. MEGA5: molecular Evolutionary
Gene-tics Analysis Using Maximum Likelihood, Evolutionary Distance, and Maximum Parsimony Methods. Molecular
Biology and Evolution 28: 2731–2739.
Terashima M, Furusawa S, Hanzawa N, Tsuchiya K, Suyanto A, Moriwaki K, Yonekawa H, Suzuki H. 2006.
Phylogeographic origin of Hokkaido house mice (Mus
mus-culus) as indicated by genetic markers with maternal,
pater-nal and biparental inheritance. Heredity 96: 128–138.
Voolstra C, Tautz D, Farbrother P, Eichinger L, Harr B. 2007. Contrasting evolution of expression differences in the
testis between species and subspecies of the house mouse.
Genome Research 17: 42–49.
Yang H, Wang JR, Didion JP, Buus RJ, Bell TA, Welsh CE, Bonhomme F, Yu AH, Nachman MW, Pialek J, Tucker P, Boursot P, McMillan L, Churchill GA, de Villena FP. 2011. Subspecific origin and haplotype
diver-sity in the laboratory mouse. Nature Genetics 43: 648– 655.
Yonekawa H, Sato JJ, Suzuki H, Moriwaki K. 2012.
Origin and genetic status of Mus musculus molossinus: a typical example for reticulate evolution in the genus mus. In: Baird SJE, Macholán M, Munclinger P, Piálek J, eds. Evolution of the house mouse. Cambridge studies in
mor-phology and molecules: new paradigms in evolutionary biology macholan. New York, NY: Cambridge University
Press.
SUPPORTING INFORMATION
Additional supporting information may be found in the online version of this article: Figure S1. Alignment of 402 D-loop sequences with GenBank accession numbers. Figure S2. Maximum-likelihood tree, with complete sequence names.
Figure S3. Histograms of mismatch distribution in each haplogroup.
Figure S4. Neighbour-joining tree of the 28 cytochrome-b sequences referred to Mus musculus castaneus in GenBank. Mus musculus domesticus and Mus musculus musculus are also included. Sequences appear with their GenBank accession numbers.
Figure S5. Neighbour-joining tree depicting the relationships among 15 individuals from Iran, Afghanistan, Pakistan, and India, based on 226 single nucleotide polymorphisms (SNPs) of the MUGA chip that were polymorphic solely in those individuals, and identically monomorphic in Mus musculus domesticus and Mus musculus musculus.
Please note: Wiley-Blackwell are not responsible for the content or functionality of any supporting materials supplied by the authors. Any queries (other than missing material) should be directed to the corresponding author for the article.