HAL Id: hal-00296964
https://hal.archives-ouvertes.fr/hal-00296964
Submitted on 26 Sep 2006
HAL is a multi-disciplinary open access
archive for the deposit and dissemination of
sci-entific research documents, whether they are
pub-lished or not. The documents may come from
teaching and research institutions in France or
abroad, or from public or private research centers.
L’archive ouverte pluridisciplinaire HAL, est
destinée au dépôt et à la diffusion de documents
scientifiques de niveau recherche, publiés ou non,
émanant des établissements d’enseignement et de
recherche français ou étrangers, des laboratoires
publics ou privés.
Modelling spring flood in the area of the Upper Volga
basin
M. Helms, O. Evdakov, J. Ihringer, F. Nestmann
To cite this version:
M. Helms, O. Evdakov, J. Ihringer, F. Nestmann. Modelling spring flood in the area of the Upper Volga
basin. Advances in Geosciences, European Geosciences Union, 2006, 9, pp.115-122. �hal-00296964�
www.adv-geosci.net/9/115/2006/ © Author(s) 2006. This work is licensed under a Creative Commons License.
Advances in
Geosciences
Modelling spring flood in the area of the Upper Volga basin
M. Helms, O. Evdakov, J. Ihringer, and F. Nestmann
Institute for Water and River Basin Management, University of Karlsruhe, Germany
Received: 23 January 2006 – Revised: 22 May 2006 – Accepted: 3 July 2006 – Published: 26 September 2006
Abstract. Integrated river-basin management for the Volga river requires understanding and modelling of the flow pro-cess in its macro-scale tributary catchments. At the ex-ample of the Kostroma catchment (16 000 km2), a method combining existing hydrologic simulation tools was devel-oped that allows operational modelling even when data are scarce. Emphasis was placed on simulation of three pro-cesses: snow cover development using a snow-compaction model, runoff generation using a conceptual approach with parameters for seasonal antecedent moisture conditions, and runoff concentration using a regionalised unit hydrograph ap-proach. Based on this method, specific regional character-istics of the precipitation-runoff process were identified, in particular a distinct threshold behaviour of runoff generation in catchments with clay-rich soils. With a plausible overall parameterisation of involved tools, spring flood events could successfully be simulated. Present paper mainly focuses on the simulation of a 16-year sample of snowmelt events in a meso-scale catchment. An example of regionalised simula-tion in the scope of the modelling system “Flussgebietsmod-ell” shows the capabilities of developed method for applica-tion in macro-scale tributary catchments of the Upper Volga basin.
1 Introduction
After its almost complete transformation into a cascade of reservoirs, the water and energy resources of the Volga river offer enormous economic value. On the other hand, the river has been transformed into an unstable system with large-scale risk potential, especially due to increased retention times of water and mass in the reservoirs. Therefore, sus-tainable use of the resources of the Volga river requires the Correspondence to: M. Helms
development of appropriate technologies for integrated river-basin management. This is the aim of the interdisciplinary German-Russian cooperation project “Volga-Rhine” dealing with various aspects of quantitative and qualitative resources management in the Volga basin. Since the flow process is the main dynamic natural boundary condition in the river sys-tem, the development of operational simulation tools for pre-diction and forecast of river flow in the macro scale is crucial in the scope of the project and the major goal of the investi-gations presented in this paper. According to the basic con-cept of the project (“Volga-Rhine”), the tools developed for the Volga basin are based on modelling experiences gained during many years in Germany. However, due to different natural conditions and data availabilities in the Volga basin, regional adaption is necessary.
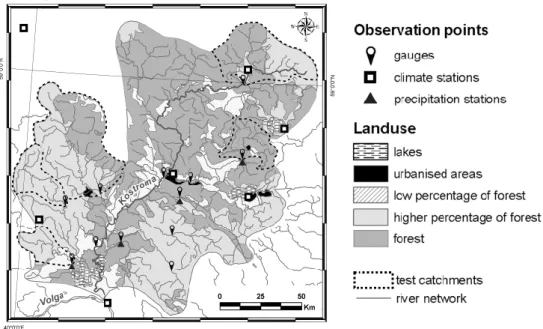
The hydrologic simulation tools were developed for the Kostroma catchment (16 000 km2, Fig. 1) in the transition zone of mixed and boreal forests (about 300 km NE of Moscow). With respect to regionalised modelling, soil areas of a glacial series and forest fractions occurring in this catch-ment are representative for large areas of the Upper Volga basin. Annual precipitation depths vary in the range between 400 and 800 mm (average about 600 mm) with a maximum in summer. However, due to maximum evaporation rates in summer and snow accumulation in winter, the flow regime is dominated by a maximum in spring (due to snowmelt). A secondary maximum occurs in autumn.
Due to their widespread occurrence in the Volga basin, we focussed our investigation on areas with clay-rich soils (“de-bris loam and clay” of a young-moraine area and “loam and clay” of an old-moraine area; Fig. 1). The predominating FAO soil unit of these areas is podzoluvisol. Furthermore, we emphasised snowmelt induced spring floods, which are the dominating hydrologic characteristic under the prevail-ing climate.
For the appropriate selection of an operational modelling approach, some boundary conditions have to be considered.
116 M. Helms et al.: Modelling spring flood in the area of the Upper Volga basin
Fig. 1. Soil textures, river network, sites of gauges and
meteorologi-cal observation stations and defined test catchments in the Kostroma catchment.
At the scale of the investigated catchments, uncertainty con-cerning interaction of hydrologic processes has to be taken into account (Uhlenbrook, 2005). Particular uncertainty in the study area results from non-linear threshold behaviour of clay-rich soils (Lindenmaier et al., 2005) and data scarcity. Gauges with series of daily flow (1970–1986) and climate stations with series of daily precipitation depth and partly daily air temperature (1970–1990) are shown in Fig. 1. Only in Kostroma and Vologda, detailed meteorological informa-tion is available. Informainforma-tion on soil texture (Fig. 1) is based on a map with low spatial resolution (scale 1:2.5 Mio.). Fur-thermore, a digital map of soil cover (Fig. 2) and a Digital Elevation Model were derived from satellite images (Land-sat TM, ASTER).
Regarding these boundary conditions and the goal of op-erational modelling of the precipitation-runoff (PR) process, parsimonious and robust conceptual modules with semi-distributed, representative parameters are adequate to iden-tify and quaniden-tify the essential flood-relevant processes at the scale of the major tributaries catchments of the Volga river. For the application of these modules under the specific natu-ral conditions and data availability in the Volga basin, a step-wise procedure controlling uncertainty was developed. The first step consists of the (reliable) simulation of homogeneous hydrologic situations, i.e., events with spatially and
tempo-rally homogeneous distribution of input variables and hydro-logic states (“test events”) in meso-scale catchments with ho-mogeneous properties (“test catchments”). In Sect. 2, proper-ties of runoff generation and runoff concentration are derived for these situations. Based on this knowledge, snowmelt and spring flood events are simulated (Sect. 3). In Sect. 4, per-spectives of regionalisation of the modelling approach for macro-scale application are demonstrated. Conclusions are drawn in Sect. 5.
2 Identification of runoff-generation and runoff-concentration properties
We selected five meso-scale test catchments: two in a young-moraine area, and three in an old-young-moraine area (Fig. 1). In this paper, we focus on the example of the catchment of gauge Emelyanovo (597 km2). Furthermore, we selected 123 snow-free days with significant mean precipitation depths (≥5 mm) of all stations excluding Vologda, and homoge-neous spatial distribution (coefficient of variation ≤0.33). Measured precipitation depths of the stations were spa-tially interpolated using the inverse distance-squared method (Smith, 1993) to calculate areal precipitation depths of the test catchments and other sub-catchments of the Kostroma river. Corresponding to above mentioned 123 days, we de-fined 40 PR test events. The event of May 1978 (Fig. 3) was most suitable for the first step: precipitation was tem-porally concentrated, snow-free and had a relatively uniform spatial distribution allowing reliable interpolation. Further-more, the event occurred immediately after a major snow-melt period. Therefore, retention capacity of the catchment of Emelyanovo was very low and hence almost not vari-able. For this event, a reliable non-parametric unit hydro-graph (UH) was derived (Pilgrim and Cordery, 1993).
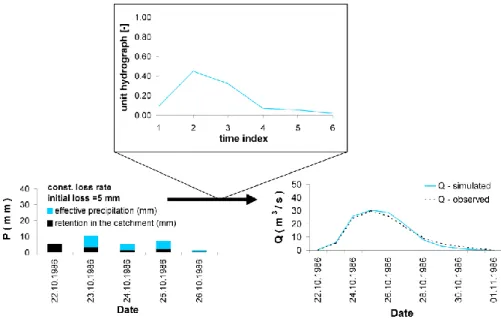
Using the identified UH and overall runoff coefficients (RC) of the test events, percentage approaches for opera-tional modelling of the temporal distribution of effective pre-cipitation (or conversely loss; Pilgrim and Cordery, 1993) were evaluated. Amongst others, the constant percentage approach (constant loss fraction), the phi-index approach (constant potential loss rate) and the exponential percentage approach (loss fraction exponentially decreasing with time) were considered. As an example, see the constant percentage approach applied on the event of October 1986 (Fig. 4). For this evaluation, effective precipitation depths simulated with the percentage approaches and systematic variations of initial loss (IL) were each convoluted with the UH and diagnosed in comparison to observed hydrographs of direct flow (straight-line separation as satisfactory approximation). Like in Fig. 4, the constant-percentage approach produced best fits to the observed direct flow in almost all test events. However, cal-ibrated IL exhibit high seasonal and event-specific variabil-ity (values up to 35 mm in catchment Emelyanovo). On the other hand, high maximum (or final) RC (after subtraction of
Fig. 2. Soil cover derived from a Landsat TM scene, river network, sites of gauges and meteorological observation stations and defined test
catchments in the Kostroma catchment.
Fig. 3. Derivation of the non-parametric unit hydrograph for a precipitation-runoff event in May 1978 with homogeneous conditions of
runoff generation in the test catchment Emelyanovo.
IL) occurred. Both, high maximum RC and high IL result from characteristics of predominating podzoluvisols. It may be assumed that clay depletion in eluvial E-horizons may cause high IL while low water-permeability of illuvial Bt-horizons may cause high maximal RC. In old-moraine areas, these characteristics of runoff generation are more distinct than in young-moraine areas.
3 Modelling of snowmelt and spring flood events
For snow accumulation, precipitation forms were identi-fied using spatially interpolated values of air temperature in comparison to threshold values of transitions between pre-cipitation forms. Regarding the scarcity of meteorological data, the degree-day method (Gray and Prowse, 1993) with time-variant degree-day factor (DDF) was used to model the energy-exchange processes of the snow-cover. Compaction
118 M. Helms et al.: Modelling spring flood in the area of the Upper Volga basin
Fig. 4. Derivation of effective precipitation depths for a precipitation-runoff event in October 1986 in the test catchment Emelyanovo using
the constant percentage approach with optimised initial loss and the known unit hydrograph.
and retention of liquid water in the snow cover were taken into account in a snow-compaction module (Bertle, 1966). Using these approaches, the development of snow cover and, hence, its water release were simulated. For calibration of the time-variant DDF, we used the criterion that after convo-lution with the UH, water release of the snow cover results in values with constant ratio to observed direct flow in the area of the flood peak (corresponding to the constant percentage approach, see Sect. 2 and Fig. 5). For the almost completely forested catchment of Emelyanovo with relatively low radia-tion impact, calibrated DDF’s are about 0.5 mm/d·K in win-ter (Fig. 6). In the major melt periods in spring, DDF’s vary between about 1.3 (initial melt stage) and about 2.0 mm/d·K (advanced stage with daily mean temperatures continuously greater than 5◦C). An exception is the final melt stage in 1982 (DDF=3.1 mm/d·K; see Fig. 6), however, reduced DDF’s (e.g., 2.3 mm/d·K) result only in a slight shift of the peak of convoluted water release. In autumn (until 30 Novem-ber), DDF’s similar to those in spring (2.0 mm/d·K) may be assumed as satisfactory approximation. These DDF’s cor-respond to those specified for “boreal forest” and “taiga” in Gray and Prowse (1993). Moreover, Fig. 6 shows a plausible development of calibrated DDF’s during spring in all years except 1982 (see above) and 1986. In general, scattering may be attributed to different sequences of weather situations and might be explained by more detailed meteorological data (ra-diation, weather classification).
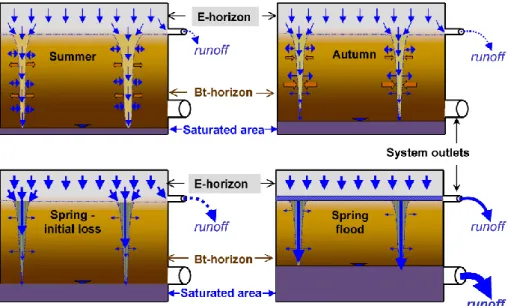
For the investigated areas with predominating podzoluvi-sols, we postulate the following hypothesis on the essential processes of runoff generation due to snowmelt (compare Fig. 7): in summer, with negative soil water balance, macro-pores and hence preferential flow paths are formed due to
clay shrinkage in the upper Bt-horizon and in its (diagnos-tic) interlocking area with the E-horizon. A deeper saturated soil reservoir (excess water typically occurring in podzoluvi-sols) is filled by infiltrating precipitation water. In autumn, the size of macro-pores is reduced due to wetting of the soil and clay swelling. However, due to typical tonguing of the E-horizon (coarser grained material) into the Bt-horizon, the discussed soil area remains more or less permeable. Dur-ing winter, this soil state is conserved. Therefore, infiltratDur-ing snowmelt water in spring is more or less retained in upper soil horizons before it enters into the saturated reservoir. In an advanced infiltration stage, water is displaced from the saturated reservoir due to hydraulic connection to infiltration water and pressure transmission.
To prove the hypothesis and to transfer it to a conceptual model based on available data (see Sect. 1), regression equa-tions for runoff volume VOL [m3] and IL [m3] of flood events due to snowmelt were developed (Eqs. (1) and (3), for the catchment of Emelyanovo). Overall RC 9 was calculated according to Eq. (2). Regressors in Eqs. (1) and (3) were selected among:
– event parameter: volume 6I [m3] of system input I (= water release of the snow cover);
– state/memory parameters describing moisture condi-tions: volumes of base flow QB [m3] (Duband et al., 1993) for summer and autumn of the antecedent year (June–September 6QBJ S; October—December 156QBOD; see Fig. 8), and – in Eq. (3) – overall RC
9during the flood event.
In one year (1978/1979), 6QBODand in particular 6QBJ S were much greater than in all other years, which were
Fig. 5. Calibration of a snow model for spring 1984 in catchment Emelyanovo using the criterion of constant daily ratios between convoluted
water release of the snow cover and observed direct flow in the area of the flood peak. In addition, direct flow simulated with the constant percentage approach and parameters estimated with a regression approach is shown.
analysed. IL was zero and 9 about one in spite of a relatively low 6I . Since Eq. (3) would be strongly biased by this sin-gle year, the latter was excluded from the analysis of IL and a case differentiation was made. Since no significant bias was found in Eq. (1), the complete series could be analysed with respect to VOL.
log(V OL) = −4.7 + 1.28 · log(6I ) + 0.31 · log(6QBJ S) (1)
9 = V OL/6I (2)
I L =5.48 · 106+29.27 · 106·9 −0.15 · 6I (3) Coefficients of determination of the analysed series show good fits to observed VOL (R2=0.82 for Eq. (1); R2=0.86 af-ter back-transformation) and calibrated IL (R2=0.89). Since correlation among the regressors is low (R2≤0.07), it may be assumed that collinearity is weak. However, to validate Eq. (1) and (3), split-sample tests were performed (sample 1: 1970/1971–1977/1978; sample 2: 1978/1979–1985/1986 or 1979/1980–1985/1986), i.e., parameters determined from sample 1 were assigned to sample 2 and vice versa. For both equations, regression coefficients remain in the same or-der of magnitude in the subdivided samples, and coefficients of determination of the overall series remain high: R2=0.76 (R2=0.80 after back-transformation) for Eq. (1) and R2=0.85 for Eq. (3).
Introduction of the regressor 6QBOD (see Eq. (4) for
VOL) improves the fits: R2=0.86 (R2=0.90 after back-transformation) for VOL and R2=0.91 for IL.
log(V OL) = −5.7 + 1.35 · log(6I ) + 0.23 · log(6QBJ S)
+0.15 · log(6QBOD) (4)
However, collinearity has to be considered due to higher correlation among log 6QBODand log 6QBJ S(R2=0.25).
Fig. 6. Degree-day factors (DDF’s) of the melting seasons
1970-1986 in catchment Emelyanovo derived from diagnosis of a snow-compaction model using river flow as reference variable. Plausible development of the DDF’s is diagnosed by a fitted sigmoid fct. with the specified coefficients of determination R2. Uncertain DDF’s occur in the years 1982 and 1986.
In a split-sample test, the regression coefficient of log(6QBOD)was confirmed in sample 1 (with relatively low 6QB-values; coefficient 0.17), but not in sample 2 (with relatively high 6QB-values; coefficient 0.05). However, us-ing the equation derived from sample 1, the fit to sample 2 is almost as good as the fit of the equation derived from sample 1 itself (R2=0.85 vs. 0.87). Therefore, validation of Eq. (4) was at least partly successful. For IL, validation of the equa-tion including 6QBODwas less successful due to unstable regression coefficients of 6QBOD in the subdivided sam-ples and due to a coefficient of determination of the overall series less than those of the validation of Eq. (3) (R2=0.83 vs. 0.85).
120 M. Helms et al.: Modelling spring flood in the area of the Upper Volga basin
Fig. 7. Scheme of the discussed runoff-generation mechanism of spring flood events in catchments with predominating podzoluvisols. Blue
arrows indicate dynamics of soil water, brown block arrows those of the soil matrix due to shrinkage or swelling of clay.
Fig. 8. Flow hydrograph (Q) of autumn 1982 at the gauge of
Emelyanovo and baseflow (QB) calculated according to Duband et al. (1993) by an auto-regressive approach, which uses the exoge-neous variable “direct flow” and which was calibrated according to an analysis of recession curves.
Regarding above hypothesis, these results may be inter-preted as follows:
Positive impact of 6I on VOL is evident. Furthermore, log(6QBOD)and in particular log(6QBJ S)explain consid-erable variance fractions of log(V OL) and confirm positive dependence of VOL on moisture conditions in summer and autumn of the antecedent year.
Also IL depends on the interaction of input (reducing im-pact) and moisture conditions in soil (amplifying impact due to reduced permeability). Analyses revealed that the es-sential variance fraction of IL may be explained using the lumped parameters 6I and 9. Further differentiation (using the regressors 6QBOD and 6QBJ S)does not improve the
statistical properties of the model. However, in years with very wet conditions in the antecedent summer and autumn (e.g., 1978/1979), IL may become zero, apparently due to the high initial elevation of the water table of the saturated reservoir and the high soil water content in the E-horizon. The exact critical conditions for the switch from application of Eq. (3) to the assumption that IL is zero still cannot be quantified based on available data.
Finally, flood events were simulated using the constant percentage approach and estimated parameters (9 and IL ac-cording to Eqs. (2), (3), and (4))). As an example, see the event of 1984 in Fig. 5). Nash-Sutcliffe efficiency criteria (EC) for single events vary between 0.53 and 0.93, except those of 1971 and 1986 (EC=0.41 and 0.15). However, for all events, the overall EC of 0.80 (EC=0.87 if 1986 is ex-cluded) confirms the adequacy of the model. In the valida-tion of the model, the EC is in the same order of magnitude (EC=0.77; EC=0.84 if 1986 is excluded).
4 Perspectives toward regionalisation and macro-scale modelling
For the test events (Sect. 2), similar runoff-generation prop-erties among the test catchments within considered soil ar-eas were found. For snowmelt events (Sect. 3), a compari-son of runoff-generation properties was still not reliable due to lower or mixed forest fractions in some test catchments increasing uncertainty of the DDF (radiation impact). To evaluate transferability, test catchments with high and homo-geneous forest fractions in other areas of the Upper Volga basin should be considered first. In case of confirmed trans-ferability, the regionalised application of the model, e.g.,
Fig. 9. Kostroma catchment upstream of the Veksa mouth: simulated hydrographs of the flood event in May 1978 for selected sites along
the Kostroma river. The “observed” hydrograph at the lowest site was calculated as difference of the hydrographs in Bui and Makhrovo (the latter multiplied with 1.1 to account for the unobserved area downstream of the gauge).
for generalised diagnosis of the snow model or macro-scale simulation including unobserved catchments, will require re-gionalisation of a parameterised UH. According to Plate et al. (1988), the time to peak tAof the UH is related to catch-ment parameters. These parameters may be derived with a Geographic Information System (GIS):
tA=P1 ·
L · LC
IW1.5 !0.26
·e−0.016·u·e0.004·f ·a1·a2·a3(5)
with L, LC (length of the major watercourse between the mouth and the watershed, and between the mouth and a line perpendicular to the centroid of the catchment), Iw(weighted slope of the watercourse; Plate et al., 1988), u, f (urbanised and forested fraction of the catchment in %, compare Fig. 2) and P 1 (calibrated catchment factor). Correction factors a1
to a3 account for event characteristics (precipitation
inten-sity, season, RC; Plate et al., 1988). The peak value of the UH umaxis calculated from tA, coefficients b and c depend-ing on time step and the correction factor ucoraccounting for
retention effects without influence on tA.
umax=ucor·b · tAc (6) Based on extensive experience in application of the regional-isation approach in Germany (including moraine areas), only
P1 and ucor need calibration. With tA and umax,
parame-ters n and k of the Nash cascade (parametric UH) may be derived (Plate et al., 1988). In the test catchments, P 1 was calibrated for an optimal fit of parametric to non-parametric UH’s. Significant differences between young-moraine ar-eas (P 1∼=0.18) and old-moraine areas (P 1∼=0.10), and mi-nor differences within these areas indicate that P 1 may be
transferred to unobserved catchments for regionalisation of the UH. Similar conclusions were drawn for ucor.
The approach was applied to the event of May 1978 in the Kostroma catchment upstream of the Veksa mouth (6000 km2, see Fig. 9). Meso-scale sub-catchments with each homogeneous soil properties were defined using the GIS. Furthermore, the structure of the river network and the position of gauges were taken into account. Using properties of runoff generation identified for this event (see Sect. 2), in-terpolated meteorological parameters and regionalised UH’s, direct flow could be simulated also for unobserved catch-ments. For each soil area, base flow was regionalised assum-ing simple linear dependence from catchment area. The good fit of the simulation to the observed event at gauge Gnes-dikovo (Fig. 9) confirms the adequacy of the regionalised model. Finally, the event was simulated for the overall catch-ment of the Kostroma upstream of the Veksa mouth using above described modules in the framework of the “Flussgebi-etsmodell” – FGM (Ihringer, 1999). To couple the modules, flood routing for the watercourse of the Kostroma (model of Kalinin and Miljukov, see Plate (1977)) was included. Re-sults of the simulation at selected sites along the Kostroma river with increasing peak and volume of the flood wave are shown in Fig. 9. At the catchment outlet, simulated and ob-served hydrographs (derived from observations at the gauges Bui and Makhrovo) match well.
5 Conclusions
A stepwise procedure was developed for operational mod-elling of PR processes under specific natural conditions and
122 M. Helms et al.: Modelling spring flood in the area of the Upper Volga basin with scarce data availability in the Upper Volga basin.
Em-phasis was placed on spring floods in areas of clay-rich soils including the following processes:
– Runoff concentration: a regionalised UH for meso-scale catchments was derived. Beside modelling of runoff concentration, it may serve for the diagnosis of mod-ules for runoff generation and snow-cover development using river flow as available reference variable.
– Runoff generation: distinct threshold behaviour of clay-rich soils (podzoluvisols) depending on season and time-variant state, was identified. Due to the sys-tems memory, impact of moisture conditions of the an-tecedent year on runoff generation in spring was found. A hypothesis on a corresponding mechanism of runoff generation was largely verified in a conceptual model. Further improvement of the model would require addi-tional data and might be achieved by its empirical proof (analysis of longer periods and additional catchments to increase statistical evidence) or by its process-based differentiation including inspection of soil profiles in different seasons, acquisition of soil-moisture data and tracer experiments to separate event water and pre-event water.
– Snow-cover development: a continuously working snow-compaction model with time-variant DDF was successfully applied for forested catchments. How-ever, additional analyses should be performed, espe-cially for catchments with lower forest fraction. If pos-sible, analyses should include additional meteorological data (snow depths, radiation, weather situations). Altogether, a plausible overall picture of the essential flood-relevant processes in the Kostroma catchment could be achieved by combined application of the described tools. Re-gionalised simulation using FGM as core module shows its capabilities in the complete simulation of PR processes in macro-scale catchments of the Volga basin. Furthermore, the modular structure of FGM enables substitution and compar-ison of individual modules. It may thus serve as base for efficient evaluation of different simulation techniques, espe-cially concerning runoff generation and snow-cover develop-ment, which should include regional modelling experiences of Russian scientists. Beyond this hydrologic aspect, the operational modelling system opens the perspective of in-tegrated river basin management in the Upper Volga basin (compare Sect. 1).
Acknowledgements. The research has been supported by the
German Federal Ministry for Education and Research (grant 02WT0094). The authors are grateful to the partners at the University of Architecture and Civil Engineering in N. Novgorod (S. V. Sobol, A. V. Fevralev) and the All-Russian Research Inst. for Hydraulic Engineering and Land Reclamation (A. Shcherbakov) for valuable discussions and support in data collection. Thanks are due to F. Lindenmaier, Inst. of Water and River Basin Manage-ment/University of Karlsruhe, for valuable discussions.
Edited by: R. Barthel, J. G¨otzinger, G. Hartmann, J. Jagelke, V. Rojanschi, and J. Wolf
Reviewed by: anonymous referees
References
Bertle, F. A.: Effect of Snow Compaction on Runoff from Rain on Snow, Bureau of Reclamation, Engineering Monograph, 35, 45p., Washington, 1966.
Duband, D., Obled, Ch., and Rodriguez, J. Y.: Unit hydrograph revisited: an alternate iterative approach to UH a, effective pre-cipitation identification, J. Hydrol., 150, 115–149, 1993. Gray, D. M. and Prowse, T. D.: Snow and Floating Ice, in:
Hand-book of Hydrology, edited by: Maidment, D. R., McGraw-Hill, Inc., New York, 1993.
Ihringer, J.: Softwarepaket f¨ur Hydrologie u. Wasserwirtschaft (Software package for Hydrol. Water Res. Manag.). Dpmt. of Wat. and River Basin Man., Univ. of Karlsruhe, 1999.
Lindenmaier, F., Zehe, E., Helms, M., Evdakov, O., and Ihringer, J.: Effect of Soil Shrinkage on Runoff Generation in Micro-and Meso-Scale Catchments, edited by: Sivapalan, M., PUB: Promises and Progress, IAHS-Publ. No. 303, 305–317, Walling-ford, 2006.
Pilgrim, D. H. and Cordery, I.: Flood Runoff, in: Handbook of Hydrology, edited by: Maidment, D. R., McGraw-Hill Inc., New York, 1993.
Plate, E.: Ablauf von Hochwasserwellen in Gerinnen (Routing of flood waves in river channels), Parey, Hamburg, 1977.
Plate, E., Ihringer, J., and Lutz, W.: Operational Models for Flood Calculations, J. Hydrol., 100, 489–506, 1988.
Smith, J. A.: Precipitation, in: Handbook of Hydrology, edited by: Maidment, D. R., McGraw-Hill, Inc., New York, 1993. Uhlenbrook, S.: Von der Abflussbildungsprozessforschung zur
prozess-orientierten Modellierung (From Research in the Process of Runoff Generation Towards Process-Oriented Modelling), Hydrol. und Wasserbewirtschaftung (Hydrol. Wat. Res. Manag.), 49(1), 13–24, 2005.