Paris et al. Int J Sports Exerc Med 2019, 5:151
Volume 5 | Issue 11 DOI: 10.23937/2469-5718/1510151
International Journal of
Sports and Exercise Medicine
Open AccessCitation: Paris L, Guidoux R, Saboul D, Duclos M, Boirie Y, et al. (2019) Comparison of Active and Sed-entary Bout Lengths in Normal and Overweight Adults using eMouverecherche. Int J Sports Exerc Med 5:151. doi.org/10.23937/2469-5718/1510151
Accepted: November 02, 2019; Published: November 04, 2019
Copyright: © 2019 Paris L, et al. This is an open-access article distributed under the terms of the Creative Commons Attribution License, which permits unrestricted use, distribution, and reproduction in any medium, provided the original author and source are credited.
Comparison of Active and Sedentary Bout Lengths in Normal
and Overweight Adults using eMouverecherche
Ludivine Paris
1, Romain Guidoux
2, Damien Saboul
3,4, Martine Duclos
1,5, Yves Boirie
1,6and Sylvie
Rousset
1*1Unité de Nutrition Humaine (UNH)-INRA, Université Clermont Auvergne, France 2IP Leanware, 25 Boulevard Jules Cibrand, 63500 Issoire, France
3Almerys, 46 Rue du Ressort, 63967 Clermont-Ferrand Cedex 9, France
4Laboratoire Interuniversitaire de Biologie de la Motricité (LIBM EA 7424), Université de Lyon, France 5Service Médecine du Sport et des Explorations Fonctionnelles, CHU Clermont-Ferrand, France 6Service Nutrition Clinique, CHU Clermont-Ferrand, France
Introduction
Long sitting time and lack of physical activity (i.e., inactivity) are associated with obesity and non-com-municable chronic diseases. Adults seated more than 8 hours per day had a 62% higher risk of obesity com-pared to those seated for less than 4 hours per day [1]. Total daily sitting time was associated with low-er plow-ercentage lean mass and highlow-er total body fat mass in older people [2]. Clear evidence exists that physical activity time is associated with a more favor-able BMI and mobility. Thus, young adults who spent more than 30 min engaged in moderate to vigorous
ReSeaRch aRticLe
Check for updates
Abstract
Background: Physical inactivity and long sedentary time
are common in obese people. The eMouveRecherche appli-cation was developed to provide accurate minute-by-minute classification of physical activity in light, moderate, vigorous intensity and sedentary bouts. The aim was to compare the frequency and length of bouts in Normal-Weight (NW) and Overweight (OW) adults.
Methods: Fifty-seven adult participants either normal
weight or overweight wore a smartphone with the eMouve application for the entire waking period of the day. The con-tinuous 1-5, 5-15, 15-30, 30-60 and higher than 60-minute bouts for each behavior were counted.
Results: The total number of bouts was higher in NW
than in OW (12.4 vs. 9.8 bouts.h-1, p < 0.001). The
break-down of immobile and active bouts according to their length was different in the two groups. The NW had a significantly higher percentage of brief immobile bouts (1-5 min) (65.2% vs. 49.7%), while OW had a significantly higher percentage of 5-15 min (26.8% vs. 19.1%) and 15-30 min sedentary bouts (11.8% vs. 8.0%). The 1-5 min bouts of light-intensity activity were statistically more fre-quent in OW (93.6% vs. 83.5%), whereas bouts of 5-15 min (15.1% vs. 6.4%) and 15-30 min bouts (1.3% vs. 0%) were more common in NW.
Conclusion: The frequency of both immobile and
light-in-tensity activity bouts was lower in OW, whereas the dura-tion of bouts was respectively longer for immobile behavior
and shorter for light-intensity activity, resulting in a contin-uous sedentary pattern with few active breaks. The over-weight appears to be a barrier to the spontaneous practice of light-intensity physical activity.
Keywords
Physical activity bout, Sedentary bout, eMouveRecherche application, Accelerometer, Normal-weight adults, Over-weight adults
Abbreviations
BMI: Body Mass Index; NW: Normal Weight; OW: Over-weight; TEE: Total Energy Expenditure; M: Men; W: Women
*Corresponding author: Sylvie Rousset, Clermont Auvergne University, INRA, UNH, Human Nutrition Unit, 63000
tions that modify time spent in sedentary behavior [13]. The advantage of using a smartphone com-pared with a research device is the wide availability of smartphones in the general population. This avail-ability makes it possible to consider carrying out ep-idemiological studies without device limitation. Be-cause of objective measurements given by the accel-erometers, the assessments of both the intensity and duration of active and sedentary behaviors are more accurate than the subjective responses collected by physical activity questionnaires. Objective measure-ments avoid errors attributable to reporting bias and difficulties with recall [14]. In a previous work, we developed the eMouveRecherche application to ac-curately quantify four types of behavior: Immobility, light-, moderate- and vigorous-intensity activity from accelerometry data collected by smartphones. Specif-ic algorithms to quantify time spent in these four cat-egories were developed in two distinct populations and tested in controlled and free-living conditions [15,16]. The algorithms were scientifically validated with less than 5% of error in absolute value against the reference method (indirect calorimetry) or re-search device (Armband®). In free-living conditions, Overweight (OW) individuals spent more time immo-bile (81% vs. 65% of the waking period) and twice less time in light-intensity activities than Normal-Weight (NW) individuals (15% vs. 29%). No difference in moderate or vigorous intensity activity was observed between the two groups [17]. Such gaps in time spent in immobile or light-intensity activities constitute a behavioral marker of BMI or fat mass. There may be other behavioral markers of excess weight than the cumulative sedentary or lightly active time. The aim of the present work was to compare sedentary and active profiles in the same participants already stud-ied by Rousset, et al. [17], but this time according to the frequency and the length of sedentary, light, moderate and vigorous physical activity intensity pe-riods. The authors hypothesized that the sedentary and active pattern would be different in NW and OW participants.
Methodology
Participants
Two groups of adult participants in active profes-sional life, either NW (n = 30) or OW (n = 27), free of chronic disease, were studied in free-living condi-tions. During the preliminary visit, they were given a resting electrocardiogram validated by a cardiologist (ECG cardimax FX-7202, Fukuda Denshi). They were weighed and their height was measured to compute the BMI. The participants were told to maintain their current habits for the waking period of one day, i.e., spontaneous activities. Each participant was instruct-ed to wear an Android smartphone (Samsung Galaxy x Cover or LG Nexus 4 or Nexus 5 or the participant’s physical activity per day had lower fat mass than the
other participants [3]. Greater physical activity is as-sociated with less adiposity in the general adult pop-ulation [4]. Moreover, regular physical training leads to a reduction in fat mass, abdominal obesity and prevents loss of muscle. In another study, adult men and women in the highest quartile of moderate or vigorous physical activity time had significantly faster gait speed and performed a greater number of sit-to-stand transitions evaluated for physical capacity tests [5].
Physical exercise has been promoted as a strate-gy not only to prevent weight gain, to maintain body weight after weight loss but also to effectively pre-vent and treat many psychiatric, neurological, met-abolic, cardiovascular and pulmonary diseases [6]. Therefore, the physical activity guidelines for Amer-icans recommend spending at least 150 to 300 min-utes engaged in moderate-intensity activity or 75 to 150 minutes in vigorous aerobic physical activity per week in bouts of 10 min or more [7]. Recommenda-tions emphasize that moving more and sitting less will benefit nearly everyone. A recent meta-analysis of over one million adults found an exponential in-crease in the risk of all-cause mortality and cardio-vascular disease-related mortality in people who sat more than 8 h.d-1 and were also physically inactive
(less than 5 min.d-1 of at least moderate-intensity
physical activity [8]. However, the guidelines offer no recommendations regarding sedentary time. More recently, due to the objective physical activity assess-ment using accelerometers, light-intensity physical activity and breaks in sitting time (sit-to-stand tran-sition) have been studied and showed beneficial ef-fects on health and reduced mortality. For example, more frequent breaks in sitting time were associated with a 45% reduced risk of having pre-sarcopenia, defined as appendicular lean mass divided by Body Mass Index (BMI) [2]. Some studies also showed that performing frequent short bouts of light-intensity physical activity (less than 5 min) improved resting blood pressure in overweight and type 2 diabetic pa-tients [9,10]. Loprinzi (2017) found that after adjust-ing for the moderate-vigorous physical activity time, each supplementary hour of light-intensity activities decreased mortality by 16% [11]. The meta-analysis of Ekelund, et al. in which sedentary and active be-haviors were measured by accelerometers showed that 375 min.d-1 of light-intensity physical activity or
24 min.d-1 of moderate or vigorous activity or less
than 9.5 h-1 of sedentary time were associated with
reduced risk for mortality in middle aged adults and elderly people [12].
The smartphone can be used today in research studies for different purposes as a device to evaluate behaviors in free-living conditions or to test
interven-consent form before beginning the clinical trial.
Statistical analysis
Two-way (gender, BMI group) analyses of variance with interaction were carried out to determine if the two groups had similar age, BMI, TEE and TEE per kilo-gram of body mass. The same model of variance was then applied to the total number of bouts per hour to determine if they differed between men and women, and between NW and OW participants. The same mod-el of analysis of variance was then performed for each behavioral category. Finally, time accumulated in each behavioral category was then analyzed by length to de-termine if gender and/or BMI group influenced the du-ration of bouts.
Results
Differences in age, BMI and TEE between NW and
OW
Fifteen women and 15 men were normal weight (NW, 22.2 ± 1.9 kg.m-2), and 14 women and 13 men
were overweight or obese (OW, 34.2 ± 4.4 kg.m-2). There
was a significant gender*BMI category interaction. NW women had a slightly lower BMI than men (21.6 vs. 22.9 kg.m-2, F = 3.9, p = 0.06), whereas OW women had a
sig-nificantly higher BMI than men (37.1 vs. 31.3 kg.m-2, F =
21.4, p < 0.0001).
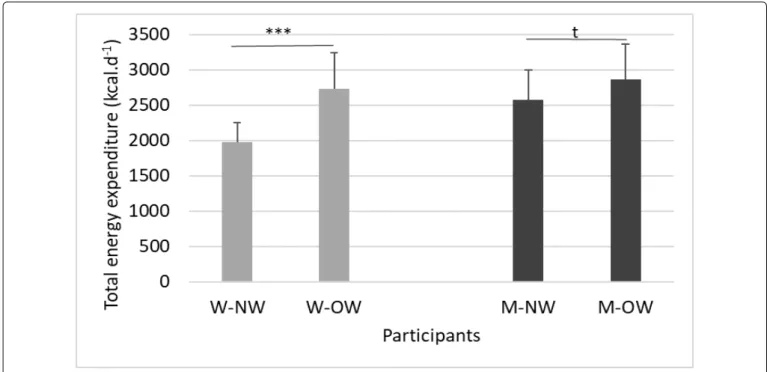
The OW participants were older than the NW par-ticipants: 45 ± 9 years vs. 33 ± 9 years (F = 24.8, p < 0.0001). The TEE assessed by eMouveRecherche was lower in NW than in OW (2278 ± 460 kcal.d-1 vs. 2798
± 494 kcal.d-1, F = 22.1, p < 0.0001; Figure 1), and
high-er in men than in women (2707 ± 467 kcal.d-1 vs. 2330
smartphone) in the left pants pocket for the entire waking period (from 8:00 about to 22:00). The eMou-veRecherche application collects the smartphone accelerometry data at 6 Hz. The raw accelerometry data were then sent via Internet to the Activ Collector Web platform (https://activcollector.clermont.inra. fr) where they were immediately compiled and ana-lyzed according to the validated algorithms [15,16]. The clinical trial and the accelerometry data manage-ment have already been described in detail [16]. To-tal Energy Expenditure (TEE) was assessed from time spent in the four behavioral categories and from the equations of Schofield for the NW and Mifflin for the OW [18]. Since short bouts of physical activity could produce beneficial health outcomes and long seden-tary bouts could be deleterious, each bout of con-tinuous behavior for the waking period (immobile, light-, moderate- and vigorous-intensity activity) was ranked in either the 1-5 min, 5-15 min, 15-30 min, 30 to 60 min or more than 60 min bouts. The ratio of bout number of a fixed length to the total number of bouts present in the behavioral category was com-puted in order to show the proportion (%) according to length. The ratio of the cumulative duration of a fixed length bout to the total duration was calculated in each behavioral category to show the percentage of time spent per length category.
The protocol was approved by the French Commit-tee for the Protection of Human Subjects (Sud-Est VI). It was registered under the references 2013-A00188-37 and 2013-A01140-45 in the ANSM system, and un-der the references NCT01995162 and NCT02348554 in Clinical Trials. The participants signed an informed
Figure 1: Difference in total energy expenditure between BMI and gender.
W-NW: Normal-Weight Women, W-OW: Overweight Women, M-NW: Normal-Weight Men, M-OW: Overweight Men.
Differences in the total bout number between
NW and OW
The two-way analysis of variance showed a signif-icant effect of BMI group, gender and their interac-tion on the total number of bouts, regardless of their length (Figure 3). They were lower in OW than in NW participants (9.4 vs. 11.3 bouts.h-1, p < 0.0001), and in
women than in men (10.4 vs. 11.8 bouts.h-1, p = 0.001).
The BMI*gender interaction was also significant: even though the number of bouts differed in normal-weight ± 547 kcal.d-1, F = 10.9, p = 0.0007). Moreover, there
was a significant gender*BMI interaction (Figure 1): The gap in TEE between the NW and OW was higher in women than in men.
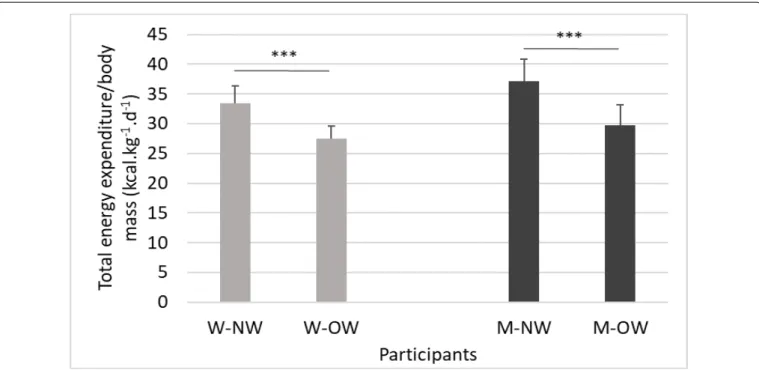
The total energy related to body weight was higher in NW than in OW (35.3 ± 3.8 vs. 28.6 ± 3.0 kcal.kg-1, F =
64.7, p < 0.0001) and higher in men than in women (33.8 ± 5.2 kcal.kg-1 vs. 30.7 ± 5.2 kcal.kg-1, F = 12.6, p = 0.0008;
Figure 2) without significant interaction between gen-der and BMI.
Figure 2: Difference in total energy expenditure related to weight between BMI and gender.
W-NW: Normal-Weight Women, W-OW: Overweight Women, M-NW: Normal-Weight men, M-OW: Overweight Men.
***: p < 0.0001.
Figure 3: Total number of bouts per recording hour by gender and weight status.
NW: Normal Weight, OW: Overweight.
trary, the 5-15 min bouts of light-intensity activity were more than double in NW than in OW participants. Only the NW participants performed the 15-30 min bouts of light-intensity activity.
As regards the moderate- and vigorous-intensity ac-tivities, there was no difference between the groups. They represented 4.7% vs. 3.0%, and 0.4% vs. 0.01% of the waking period, respectively, in NW and OW partic-ipants. The more frequent bouts in moderate-intensi-ty activimoderate-intensi-ty had a 1-5 min length (more than 88% of the bouts), then the 5-15 min bouts. Bouts longer than 15 min were uncommon. Vigorous-intensity activities were rare: Only five NW and one OW participant had at least one bout of vigorous activity. The shortest bouts of vig-orous activity were the most frequent.
The two-way analysis of variance often showed a BMI effect as shown above but no effect of gender or of BMI*gender interaction except for the light-intensity 15-30 min bouts. NW women had a higher proportion of 15-30 min bouts than OW women (2.0% vs. 0%, p < 0.001), while no difference occurred between NW and OW men (0.6% vs. 0%, p = 0.18).
Cumulative duration of bouts according to their
length in the four behavioral categories
After examining the number of bouts by length out of the total number, Table 1 shows the cumulative tion of the bouts by length compared to the total dura-tion in each behavioral category.
In NW participants, the cumulative duration of sed-entary bouts was about 20%, regardless of their length men and women (13.6 vs. 11.3, p = 0.0001), they were
similar in overweight people (10.0 and 9.5 bouts.h-1, p
= 0.35).
Number of bouts per recording hour in the four
behavioral categories
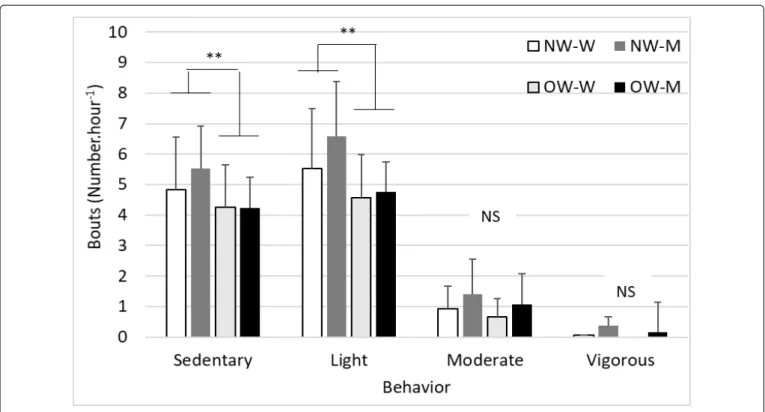
Considering the number of bouts in each behavioral category, the analysis of variance shows that BMI influ-enced the number of bouts, regardless of their length. Both the number of sedentary and light-intensity bouts per recording hour were higher in NW than in OW par-ticipants: 5.2 sedentary bouts per hour vs. 4.2 (F = 6.2, p = 0.01) and 6.0 light-activity bouts per hour vs. 4.7 (F = 10.4, p = 0.002), respectively (Figure 4). No difference between the two BMI groups occurred for moderate or vigorous bouts. Gender had no significant effect on the number of bouts in any category.
As a reminder, the total percentage of time spent in sedentary behavior was lower in NW than in OW participants (65% vs. 82%) and vice versa for light-in-tensity activities (29% vs. 15%) [17]. In Table 1, we compared the proportions of the bouts according to their length in NW and OW participants. The short sedentary bouts (1-5 min) predominated compared to the other lengths in NW participants, whereas in OW participants, 1-5 min sedentary bouts constituted less than half of the sedentary bouts.
Light-intensity activity time was divided into short bouts in both groups. Thus, 1-5 min bouts represent-ed more than 80% of bouts in this category and were more common in OW participants (Table 1). On the
Figure 4: Number of bouts in the four behavioral categories according to gender and BMI.
W-NW: Normal-Weight Women, W-OW: Overweight Women, M-NW: Normal-Weight Men, M-OW: Overweight Men.
p = 0.08).
Discussion
The purpose of this work was to compare sed-entary and active patterns during a free-living day between NW and OW men and women. This study showed that BMI dramatically influenced the number and the length of bouts in both sedentary behavior and light-intensity activity. Thus, OW participants had less sedentary bouts but of greater length than their NW counterparts. In both groups, the very short bouts of light intensity or moderate activity were pre-dominant, and bouts longer than 15 min were less frequent. However, the difference between groups focused on the cumulative duration of short bouts of light intensity that was higher in OW participants, whereas that of the long bouts was higher in NW par-ticipants.
Obese people are more sedentary than NW indi-viduals [17,19-21]. Belletiere, et al. showed that of-ten interrupting sitting posture was associated with lower BMI and waist circumference in an Australian adult cohort (AusDiab) [20]. In our study, we also found that frequent short bouts in sedentary behav-ior unlike long bouts were associated with the NW status. Kim, et al. showed that about 70% of seden-(Table 1), whereas in OW participants, the cumulative
time of the longest sedentary bouts was better repre-sented than the shortest ones. The cumulative duration of the shortest bouts (1-5 min) in sedentary behavior performed by NW participants was twice as high as those of the OW participants. The aggregate time of the sedentary bouts of 5-15 min, 15-30 min, 30-60 min and more than one hour were similar between the two groups.
The cumulated duration of light activity was the highest for the shortest bouts and decreased when the bout length increased in both groups. However, the cumulative duration of 1-5 min bouts was sig-nificantly higher in OW participants, whereas that of 5-15 and 15-30 min was greater in NW participants.
There was no difference between BMI groups in cu-mulative duration of moderate- or vigorous- intensity bouts, regardless of their length. There was only a gen-der effect and a gengen-der*BMI interaction on the cumu-lative duration of light-intensity 15-30 min bouts. This bout length of light-intensity activity was more popular in women than in men. NW women had a higher signif-icant cumulative duration of 15-30 min bouts than OW women (9.9 % vs. 0%, p < 0.001), whereas a slight differ-ence occurred between NW and OW men (3.8% vs. 0%,
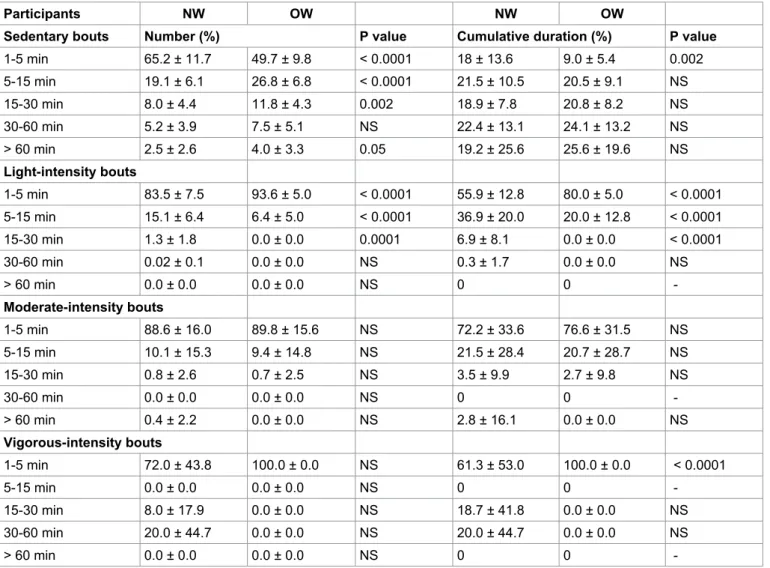
Table 1: Mean and standard deviation of the number and cumulative duration of bouts per length, behavioral category and weight
status of the participants.
Participants NW OW NW OW
Sedentary bouts Number (%) P value Cumulative duration (%) P value
1-5 min 65.2 ± 11.7 49.7 ± 9.8 < 0.0001 18 ± 13.6 9.0 ± 5.4 0.002 5-15 min 19.1 ± 6.1 26.8 ± 6.8 < 0.0001 21.5 ± 10.5 20.5 ± 9.1 NS 15-30 min 8.0 ± 4.4 11.8 ± 4.3 0.002 18.9 ± 7.8 20.8 ± 8.2 NS 30-60 min 5.2 ± 3.9 7.5 ± 5.1 NS 22.4 ± 13.1 24.1 ± 13.2 NS > 60 min 2.5 ± 2.6 4.0 ± 3.3 0.05 19.2 ± 25.6 25.6 ± 19.6 NS Light-intensity bouts 1-5 min 83.5 ± 7.5 93.6 ± 5.0 < 0.0001 55.9 ± 12.8 80.0 ± 5.0 < 0.0001 5-15 min 15.1 ± 6.4 6.4 ± 5.0 < 0.0001 36.9 ± 20.0 20.0 ± 12.8 < 0.0001 15-30 min 1.3 ± 1.8 0.0 ± 0.0 0.0001 6.9 ± 8.1 0.0 ± 0.0 < 0.0001 30-60 min 0.02 ± 0.1 0.0 ± 0.0 NS 0.3 ± 1.7 0.0 ± 0.0 NS > 60 min 0.0 ± 0.0 0.0 ± 0.0 NS 0 0 -Moderate-intensity bouts 1-5 min 88.6 ± 16.0 89.8 ± 15.6 NS 72.2 ± 33.6 76.6 ± 31.5 NS 5-15 min 10.1 ± 15.3 9.4 ± 14.8 NS 21.5 ± 28.4 20.7 ± 28.7 NS 15-30 min 0.8 ± 2.6 0.7 ± 2.5 NS 3.5 ± 9.9 2.7 ± 9.8 NS 30-60 min 0.0 ± 0.0 0.0 ± 0.0 NS 0 0 -> 60 min 0.4 ± 2.2 0.0 ± 0.0 NS 2.8 ± 16.1 0.0 ± 0.0 NS Vigorous-intensity bouts 1-5 min 72.0 ± 43.8 100.0 ± 0.0 NS 61.3 ± 53.0 100.0 ± 0.0 < 0.0001 5-15 min 0.0 ± 0.0 0.0 ± 0.0 NS 0 0 -15-30 min 8.0 ± 17.9 0.0 ± 0.0 NS 18.7 ± 41.8 0.0 ± 0.0 NS 30-60 min 20.0 ± 44.7 0.0 ± 0.0 NS 20.0 ± 44.7 0.0 ± 0.0 NS > 60 min 0.0 ± 0.0 0.0 ± 0.0 NS 0 0
-predicted sedentary time in middle age subjects over a 5-year period [27]. In contrast, the authors failed to find that sedentary time predicts body mass gain. The heaviness could be the reason for fewer activity efforts.
Some intervention studies showed that replacing 30 min of prolonged sitting by moderate or vigorous physical activities resulted in lower BMI and waist circumference [28,29]. This effect seemed to have a larger impact compared with replacing sedentary be-havior with light physical activities [29]. However, it is more feasible to practice the latter ones than moder-ate or vigorous activities for the general population, elderly people and patients with chronic diseases. Moreover, the present study showed that the physi-cal activity deficit in OW participants compared to NW participants was focused on light-intensity behaviors.
In spite of a shorter time spent in active behaviors, OW participants expended more energy than NW par-ticipants. However, TEE per kilogram of body weight was lower in OW participants. Other authors such as Lefai, et al. also found similar results [30]. They explained that higher TEE in OW was due to higher resting metabolic rate and physical activity energy expenditure, but these differences disappeared af-ter adjustment of body mass. Higher TEE in OW is the result of a greater fat free mass and fat mass [31]. Uygur, et al. also showed that resting metabolic rate (RMR) was significantly higher and RMR per kilogram of body weight was lower in both male and female obese adults compared to normal-weight controls [32].
Limitations
The present study has certain limitations: The two groups differed in age. OW individuals were older than NW. Thus, it is common to gain body weight with ag-ing. The number of overweight persons is higher after 40 years than around 30 years. The authors are con-vinced that the age in the 33-45-year interval was not the responsible factor for the sedentary and active pat-terns observed in the study but, instead, that excessive weight is a powerful barrier to mobility. The behavioral recording time was short (a single day) but sufficient to reveal differences between NW and OW behavioral pat-terns. Only two groups of participants were studied. In the future, the sedentary and active behaviors of older people, either healthy or with chronic diseases, will be studied.
Conclusion
Long light-intensity bouts and frequent interrup-tions in sedentary time were associated with the NW status. On the contrary, long sedentary bouts were a specific pattern in OW participants. These results seem to show that to be able to move smoothly from tary bouts took less than 5 minutes in an adult
pop-ulation, whereas only NW participants in the present study reached approximately 65% of bouts (< 5 min-utes) [22]. Thus, the OW participants in the present study had only 49.7% of short sedentary bouts, the other sedentary bouts being longer. In the Husu, et al. study, the cumulative duration of sedentary bouts lasting less than 5 minutes was shorter than those of over 5 minutes (19% vs. 77%) in a large 30- to 75-year-old Finnish population sample [23]. These re-sults were similar to those observed in the NW sam-ple of the present study (18% vs. 82%) but differed from those observed in the OW sample (9% vs. 91%,
Table 1). The meta-analysis of Chastin, et al. reported that interrupting sedentary bouts by light- or moder-ate- to vigorous- intensity breaks helps to decrease BMI and to improve postprandial glycemia [24]. The mean daily number of standing bouts and time accu-mulated from different bout lengths were associated with a reduction of waist circumference [23]. These previous studies and the present findings concurred that time spent standing, the high number of sit-to-stand transitions and/or long light-intensity activities had positive effects on anthropometric or biological parameters because they were associated with lower BMI, smaller waist circumference or reduced post-prandial glucose and insulin responses [25]. These non-exercise activities seem to be of the utmost im-portance because they may further affect metabolism and body composition.
The different patterns of sedentary and active be-haviors between the two weight statuses were not re-lated to strong efforts, at least in appearance. Thus, no marked difference in time spent in moderate- or vig-orous-intensity activities occurred between the two groups. The difficulty for the OW participants was to interrupt sitting posture by standing and making slow movements. If the sitting/standing transition can be performed within a few seconds, it needs energy and a strong contraction of leg muscles, leading to pain in the joint area. Nakagata, et al. reported that the ener-gy cost for 10 sit-to-stand transitions at normal speed (1 s) was about 3.6 METs in NW young men. When the speed was slow (3 s), the energy cost increased by 40%. Moreover, when the body weight increased, the intensity of sit-to-stand transitions increased as well [26]. These findings may help us to understand why OW or obese people are reluctant to stand up. The effort expended for the sit-to-stand transition will be much greater in OW people because of both their heavy body weight and slower posture change. In these conditions, OW people could perceive tran-sitions as difficult, unlike normal-weight people. The short light-intensity bouts observed in OW partici-pants may also be due to the heavy weight body and the fatigue resulting from moving it. In Ekelund, et al., BMI, body weight, fat mass and waist circumference
9. Larsen RN, Kingwell BA, Sethi P, Cerin E, Owen N, et al. (2014) Breaking up prolonged sitting reduces resting blood pressure in overweight/obese adults. Nutr Metab Cardio-vasc Dis 24: 976-982.
10. Dempsey PC, Sacre JW, Larsen RN, Straznicky NE, Sethi P, et al. (2016) Interrupting prolonged sitting with brief bouts of light walking or simple resistance activities reduces rest-ing blood pressure and plasma noradrenaline in type 2 dia-betes. J Hypertens 34: 2376-2382.
11. Loprinzi PD (2017) Light-intensity physical activity and all-cause of mortality. Am J Health Promot 31: 340-342. 12. Ekelund U, Tarp J, Steene-Johannessen J, Hansen BH,
Jefferis B, et al. (2019) Dose-response associations be-tween accelerometry measured physical activity and sed-entary time and all cause mortality:systematic review and harmonised meta-analysis. BMJ 366: 14570-14580. 13. Bond DS, Thomas JG, Raynor HA, Moon J, Sieling J, et
al. (2014) B-Mobile - A smartphone-based intervention to reduce sedentary time in overweight/obese individuals: a within-subjects experimental trial. PLoS One 9: e100821. 14. Helmerhorst HJ, Brage S, Warren J, Besson H, Ekelund U
(2012) A systematic review of reliability and objective crite-rion-related validity of physical activity questionnaires. Int J Behav Nutr Phy Act 9: 103.
15. Guidoux R, Duclos M, Fleury G, Lacomme P, Lamaudière N, et al. (2017) The eMouveRecherche application com-petes with research devices to evaluate energy expendi-ture, physical activity and still time in free-living conditions. J Biomed Inform 69: 128-134.
16. Rousset S, Guidoux R, Paris L, Farigon N, Miolanne M, et al. (2017) A novel smartphone accelerometer application for low-intensity activity and energy expenditure estimations in overweight and obese adults. J Med Syst 41: 1-10. 17. Rousset S, Guidoux R, Paris L, Farigon N, Boirie Y, et al.
(2018) eMouveRecherche: the first scientific application to promote light-intensity activity for the prevention of chronic diseases. Biology, Engineering and Medicine 3: 1-6. 18. Schofield WN (1985) Predicting basal metabolic rate, new
standards and review of previous work. Hum Nutr Clin Nutr 39: 5-41.
19. Mun J, Kim Y, Farnsworth JL, Suh S, Kang M (2018) Asso-ciation between objectively measured sedentary behavior and a criterion measure of obesity among adults. Am J Hum Biol 30: 23080.
20. Bellettiere J, Winkler AH, Chastin SFM, Kerr J, Owen N, et al. (2017) Associations of sitting accumulation patterns with cardio-metabolic risk biomarkers in Australian adults. PLoS One 12: e0180119.
21. Healy GN, Winkler EA, Brakenridge CL, Reeves MM, Eakin EG (2015) Accelerometer-derived sedentary and physical activity time in overweight /obese adults with type 2 dia-betes: cross - sectional associations with cardiometabolic biomarkers. PLoS One 10: e0119140.
22. Kim Y, Welk GJ, Braun SI, Kang M (2015) Extracting ob-jective estimates of sedentary behavior from accelerometer data: measurement considerations for surveillance and re-search applications. PLoS One 10: e0118078.
23. Husu P, Suni J, Tokola K, Vaha-Ypya H, Valkeinen H, et al. (2019) Frequent sit-to-stand transitions and several short standing periods measured by hip-worn accelerometer are associated with smaller waist circumference among adults. J Sport Sci 37: 1840-1848.
sitting to standing and to engage in light-intensity ac-tivities, it is first necessary to have a light body. If not, people have difficulty standing up and prefer to main-tain comfortable, less tiring and painless sitting posi-tions as long as possible to avoid making strenuous ef-forts. This suggests that to increase and maintain the physical activity level of OW patients, it makes sense to begin with an adapted diet to promote weight loss. As a second step, physical training and the introduc-tion of a greater amount of light-intensity activity time on a daily basis should be proposed. Thus, it would be interesting to compare the effectiveness of interventions that simultaneously combine diet and physical training with interventions that successively propose a long change in diet quality in order to lose a substantial amount of weight, followed by physical activity training to maintain weight loss and to in-crease the duration of active periods and the number of breaks in sedentary behavior without discomfort.
Acknowledgements
The authors wish to thank the participants for their collaboration in this study and Gail Wagman for proof-reading this paper. The authors have no conflict of in-terest.
References
1. Bullock VE, Griffiths P, Sherar LB, Clemes SA (2017) Sit-ting time and obesity in a sample of adults from Europe and the USA. Ann Hum Biol 44: 230-236.
2. Reid N, Healy GN, Gianoudis J, Formica M, Gardiner PA, et al. (2018) Association of sitting time and breaks in sitting with muscle mass, strength, function, and inflammation in community-dwelling older adults. Osteoporos Int 29: 1341-1350.
3. Staiano AE, Martin CK, Champagne CM, Rood JC, Katzmarzyk PT (2018) Sedentary time, physical activity, and adiposity in a longitudinal cohort of nonobese young adults. Am J Clin Nutr 108: 946-952.
4. Du H, Bennett D, LI L, Whitlock G, Guo Y, et al. (2013) Physical activity and sedentary leisure time and their asso-ciation with BMI, waist circumference, and percentage body fat in 05 million adults: the China Kadoorie Biobank study. Am J Clin Nutr 97: 487-496.
5. Keevil VL, Cooper AJM, Wijndaele K, Luben R, Ware-ham NJ, et al. (2016) Objective Sedentary Time, Moder-ate-to-Vigorous Physical Activity, and Physical Capability in a British Cohort. Med Sci Sports Exerc 48: 421-429. 6. Pedersen BK, Saltin B (2015) Exercise as medicine -
ev-idence for prescribing exercise as therapy in 26 different chronic diseases. Scand J Med Sci Sports 25: 1-72. 7. Piercy KL, Troiano RP, Ballard RM, Carlson SA, Fulton JE,
et al. (2018) The Physical Activity Guidelines for Americans. JAMA 320: 2020-2028.
8. Ekelund U, Steene-Johannessen J, Brown WJ, Fagerland MW, Owen N, et al. (2016) Does physical activity attenuate, or even eliminate, the detrimental association of sitting time with mortality? A harmonised meta-analysis of data from more than 1 million men and women. Lancet 388: 1302-1310.
29. Gupta N, Heiden M, Aadahl M, Gorshoj M, Jorgensen MB, et al. (2016) What is the effect on obesity indicators from replacing prolonged sedentary time e with brief sedentary bouts, standing and different types of physical activity during working days? A cross sectional accelerometers-based study among blue collar workers. PLoS One 11: e0154935. 30. Lefai E, Blanc S, Momken I, Antoun E, Chery I, et al. (2017) Exercise training improves fat metabolism independent of total energy expenditure in sedentary overweight men, but does not restore lean metabolic phenotype. Int J Obes 41: 1728-1736.
31. Delany JP, Bray GA, Harsha DW, Volaufova J (2004) Ener-gy expenditure in African American and white boys and girls in a 2-y follow-up of the Baton Rouge Children’s study. Am J Clin Nutr 79: 268-273.
32. Uygur E, Ucok K, Genc A, Sener U, Uygur R, et al. (2013) Significant features of basal and maximal energy expendi-ture parameters in obese adults. Turk J Med Sci 43: 863-869.
24. Chastin SFM, Egerton T, Leask C, Stamatakis E (2015) Meta-analysis of the relationship between breaks in sed-entary behavior and cardiometabolic health. Obesity 23: 1800-1810.
25. Dunstan DW, Kingwell BA, Larsen R, Healy G, Cerin E, et al. (2012) Breaking up prolonged sitting reduces postpran-dial glucose and insulin responses. Diabetes Care 35: 976-983.
26. Nakagata T, Yamada Y, Hatamoto Y, Naito H (2019) Ener-gy expenditure of a single sit-to-stand movement with slow versus normal speed using the different frequency accumu-lation method. Medicina 55: 77.
27. Ekelund U, Brage S, Besson H, Sharp S, Wareham NJ (2008) Time spent being sedentary and weight gain in healthy adults: reverse or bidirectional causality? The Am J Clin Nutr 88: 612-617.
28. Bonn SE, Rimm EB, Matthews CE, Troiano RP, Bowles HR, et al. (2018) Associations of Sedentary Time with En-ergy Expenditure and Anthropometric Measures. Med Sci Sports Exerc 50: 2575-2583.