HAL Id: hal-03246033
https://hal.archives-ouvertes.fr/hal-03246033
Submitted on 3 Jun 2021
HAL is a multi-disciplinary open access archive for the deposit and dissemination of sci-entific research documents, whether they are pub-lished or not. The documents may come from teaching and research institutions in France or abroad, or from public or private research centers.
L’archive ouverte pluridisciplinaire HAL, est destinée au dépôt et à la diffusion de documents scientifiques de niveau recherche, publiés ou non, émanant des établissements d’enseignement et de recherche français ou étrangers, des laboratoires publics ou privés.
Comparative study of bulk and surface compositions of
plasma polymerized organosilicon thin films
Ghadi Dakroub, Thomas Duguet, Jerôme Esvan, Corinne Lacaze-Dufaure,
Stephanie Roualdes, V. Rouessac
To cite this version:
Ghadi Dakroub, Thomas Duguet, Jerôme Esvan, Corinne Lacaze-Dufaure, Stephanie Roualdes, et al.. Comparative study of bulk and surface compositions of plasma polymerized organosilicon thin films. Surfaces and Interfaces, Elsevier, In press, �10.1016/j.surfin.2021.101256�. �hal-03246033�
Comparative study of bulk and surface compositions
of plasma polymerized organosilicon thin films
Ghadi Dakroub1,2, Thomas Duguet1, Jérôme Esvan1, Corinne Lacaze-Dufaure1, Stéphanie Roualdes2, Vincent Rouessac2*.
1 CIRIMAT, Université de Toulouse, CNRS, INP- ENSIACET 4 allée Emile Monso -
BP44362, 31030 Toulouse cedex 4 - France.
2 Institut Européen de Membranes, IEM UMR 5635, Univ Montpellier, ENSCM, CNRS,
Montpellier, France
ABSTRACT: Plasma polymerized organosilicon thin films were deposited in a MW-PECVD using hexadimethylsiloxane (HMDSO) as a precursor. Thin films were synthetized with different plasma conditions ranging from soft (low plasma energy) to hard (high plasma energy) ones. Quantitative 29Si solid state NMR and FTIR spectroscopy were used to characterize the bulk
composition. X-ray photoelectron spectroscopy (XPS) coupled with Density functional theory (DFT) calculations were used to determine the surface chemical composition. The bulk and the surface of the plasma polymerized HMDSO (PP-HMDSO) showed a complex chemical composition. The four main environments M, D, T and Q were present in the films. An additional environment Si(CH2)(CH3)3 denoted S was detected in the PP-HMDSO films. The chemical
composition comparison showed a difference between the bulk and the surface of the films. Under soft plasma conditions, a high amount of SiOC3 termination was present in the bulk of the films.
While, the SiO2C2 chains were highly present on the surface. On the other hand, under hard plasma
conditions, the number of the SiOC3 termination increased on the surface and decreased in the
bulk. Under soft plasma conditions, the PP-HMDSO structure was close to PDMS, while under hard plasma conditions, the PDMS similarity was lost.
1. Introduction
Among the different precursors mentioned in the literature for plasma enhanced chemical vapor deposition (PECVD), a very wide attention has been given to the organosilicon monomers that allow the deposition of various polysiloxane films, ranging from polymer-like SiOxCyHz to
inorganic SiO2 –like materials.[1] The organic/inorganic balance of the layers depends on the
plasma composition[2],[3] and the polymerization process conditions, e.g. plasma power and
monomer flux.[4]
Many monomers can be used for the deposition of Si-containing films, among which the most widely used is hexamethyldisiloxane (HMDSO).[5],[6],[7] This monomer shows a great
interest because of its high deposition rate, good thermal and chemical stabilities[8], low cost and especially its noticeable safety compared to silanes[9]. HMDSO plasma-polymerized thin films are interesting for biomedical applications[10], optics[11], corrosion protective coatings[12], food and pharmaceutical packaging.[13] Also, they are used in microelectronic industry because of their low dielectric permittivity (low-k)[14], and in vapors and liquids separation, purification and detection.[15],[16] In the field of vapors detection, organosilicon membranes have shown a high
affinity towards volatile organic compounds (VOCs), and specifically BTEX (benzene, toluene, ethyl-benzene, xylene).[17] The sorption of gases at the surface as well as their diffusion within the bulk are the two main mechanisms that condition the performances of separation or detection of membranes. Therefore determining the bulk and the surface composition is necessary in order to understand the interaction between BTEX and PECVD organosilicon membranes.[18]
The bulk of the plasma polymerized HMDSO (PP-HMDSO) deposits contain a wide range of environments. Therefore, specific characterisation techniques are required to determine the PP-HMDSO bulk chemical composition, such as quantitative 29Si solid state NMR. The environments
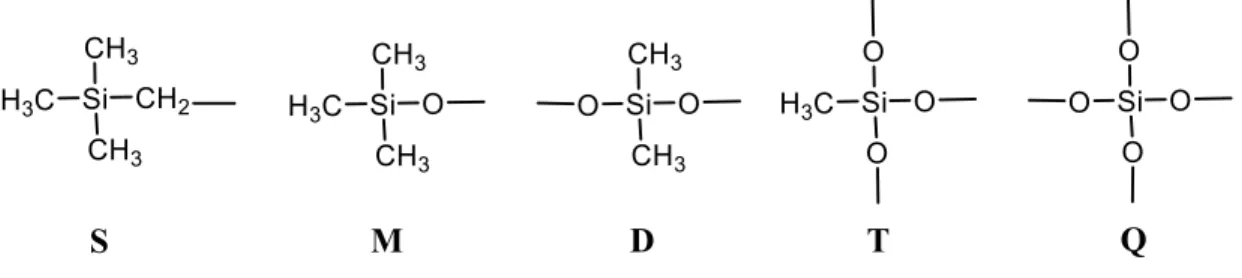
detected in siloxanes by 29Si solid state NMR are SiO(CH
3)3 , SiO2(CH3)2 , SiO3(CH3)and SiO4
denoted as M, D, T and Q respectively as shown in Figure 1. The corresponding chemical shifts in NMR range between +10 and -110 ppm. In addition, other configurations derived from M, D, T, and Q due to substitution of methyl groups by hydrogen or hydroxyl groups are found in the bulk structure. However, the quantitative NMR characterization of the PECVD deposits is limited due to the sample requirements for the measurement. 29Si solid state NMR require hundreds of
milligrams of powder and most PECVD reactors find difficulties to produce this amount under normal conditions. Besides, a long time of deposition to collect enough sample material can change the films chemistry.[19],[20],[4],[21] In complement, Fourier transform infrared spectroscopy is a
well-known characterization to determine the chemical bonds present in the whole thickness of the films.
Finally, X-ray photoelectron spectroscopy (XPS) can be very useful for the determination of the surface composition of the films (which can be as complex as the bulk), as long as a great care is taken for spectral decompositions. The curve-fitting of the Si2p core level shows that the PP-HMDSO thin films surface are composed of the M, D, T and Q environments described above in NMR studies. The electron core-level binding energy increases when a methyl group is replaced by an oxygen atom in these environments, following the M, D, T, Q sequence.[22] Unfortunately, the decomposition of Si2p is not straightforward and strongly limited with experimental work alone. In order to decompose the Si2p core level, Alexander et al. [23] used a simple method. First, they measured the positions of D and Q units using polydimethylsiloxane (PDMS) and silica (SiO2) standards. Secondly, the positions of M and T were estimated by considering that the
replacement of a methyl group with an oxygen atom shifts the component position by half of the distance between D and Q. In other words, the four components M, D, T and Q were separated by a constant binding energy shift. They also decided to fix an equal full width at half-maximum (FWHM) for the four environments.[3],[24] Other authors decomposed the Si2p peak by using the
M,D,T and Q components without mentioning the position of the peaks nor the full width at half maximum (FWHM).[25],[2] Roualdes et al. deposited SiOxCyHZ thin films using the
octamethyltrisiloxane precursor. They added a fifth component at 99.5 eV for films obtained in soft plasma conditions (low power and high monomer flux); this peak (S) could be attributed to SiC4 (SiC3 chain termination linked to a methylene bridge) as shown in Figure 1.[4] On the other
hand, O’Hare et al. performed a thorough investigation of the binding energy shifts between the four siloxy components (M, D, T, Q). First of all, a homopolymer PDMS standard was characterised by XPS to determine the position of environment D. They further analysed siloxane deposits composed of (D, T) units and (M, Q) units mixtures, with known composition determined by 29Si NMR. The use of these standards enables to identify the binding energy of each siloxy
species (M, D, T, Q). As a result, the difference in the binding energy between each siloxane component is not the same. Thus, the values of M-D, D-T and T-Q are 0.36 eV, 0.68 eV and 0.80 eV, respectively. Eventually, the binding energy increases non-linearly when an oxygen atom replaces a methyl group [22], in contradiction with previous studies.[3],[23],[26]
The simulation of XPS spectra by quantum calculations ensures a theoretical support for the experimental data in order to decompose the core levels. Duguet et al. used density functional theory (DFT) calculations to simulate O 1s and C 1s spectra of a poly epoxy polymer composed from diglycidylether of bisphenol A (DGEBA) and ethylene diamine (EDA) molecules. Thanks to the binding energy shifts calculated by DFT they decomposed the O 1s and the C 1s by two and five contributions respectively. As a result, they discriminated phenyl groups from CH3 bonds,
C-OH and a part of C-O-C bonds from other C-O-C bonds.[27] Gavrielides et al. worked on the same polymer, they simulated XPS spectra of the C 1s core level using Hartree-Fock calculations. The C 1s core level is decomposed experimentally into three environments i.e, C-C/C-H, C-N and C-O-H/C-O-C. The Hartree-Fock calculations provides the decomposition of the same C 1s core level by nine contributions using calculated binding energy shifts.[28] To our knowledge, there is a lack of attempts to decompose the Si 2p core level for polysiloxanes with S, M, D, T and Q environments using quantum calculations. Motozaki et al. calculated the core electron binding energies (CEBEs) of Si containing gas molecules by DFT calculations using the unrestricted generalized diffuse ionization (uGDI) method. Reasonable CEBEs values were obtained with an aged absolute deviation (ADD) value of 0.37. In addition, they calculated CEBEs of Si 2p, O 1s and C 1s for Si containing polymers such as PDMS by deMon-KS DFT calculations. They obtained reasonable differences between the calculated values and experimental ones.[29]
In this work, we will present our methodology that combines experiments, chemical characterization and quantum calculations at the atomic scale with the aim to understanding and comparing bulk and surface compositions of the organosilicons. Thin films are deposited by PECVD under various plasma conditions, using HMDSO as precursor. Then, the films are characterized by ellipsometry to determine their thicknesses, Fourier transform-infrared (FTIR) and 29Si Solid-state NMR spectroscopies to determine bulk composition. Finally, XPS combined
with density functional (DFT) calculations of theoretical chemical shifts lead to the fine determination of the surface composition.
2. Materials and methods
2.1. Films deposition:
HMDSO plasma polymerized thin films were elaborated in a microwave (MW-) PECVD reactor supplied by Boreal Plasmas (HEF Group). A schematic representation of the reactor is shown in Figure 2. The deposition reactor is a cylindrical chamber, with a limit pressure of 1.10-6
mbar. The ECR antennas[30] supply the plasma power in the chamber from a microwave generator (2.45 Hz, Sairem). The applicators are distributed on the top of the chamber, forming a rectangular lattice matrix (3 x 2). This distribution ensures the homogeneity of the discharge and the deposited films.[30]
Figure 2: MW- PECVD set-up scheme
The HMDSO precursor (Sigma-Aldrich, ≥ 98.5%) was injected into the chamber using a mass flow controller (Brooks) with no dilution or carrier gas. All depositions were performed at room temperature, while the plasma input power W and the monomer flux F were varied from 20 W to 140 W and from 1 sccm to 8 sccm, respectively. The W/F composite ratio represents the energetic character of the plasma. The films were synthesized at different W/F values ranging from
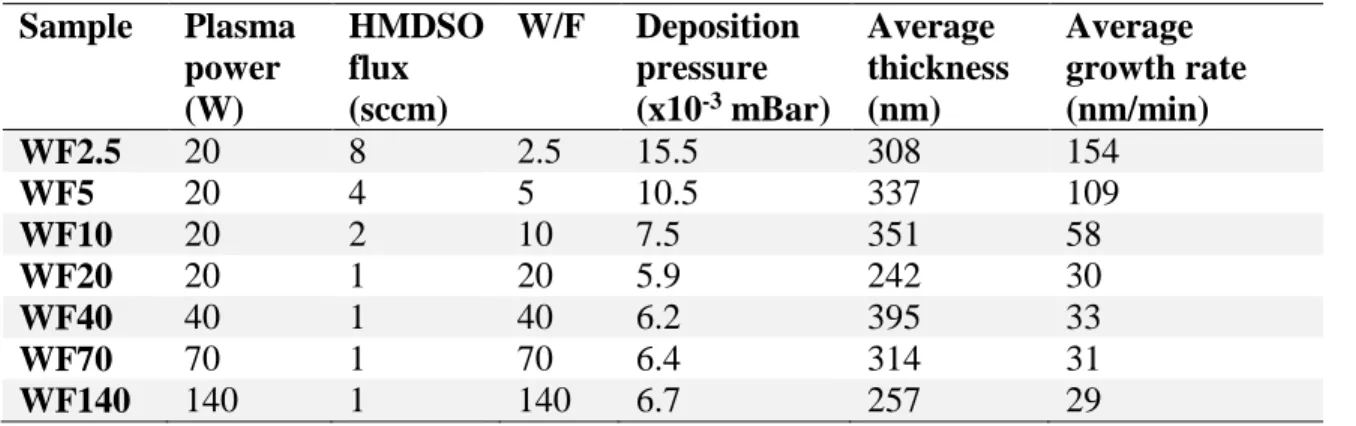
“soft” for the lowest W/F values, to “hard” for the highest. This parameter is often described as Yasuda parameter [31]. The deposition conditions of each sample are reported in Table 1. The sample names are “WFX”, X being the W/F ratio value.
Table 1: MW-PECVD thin films deposition parameters.
Sample Plasma power (W) HMDSO flux (sccm) W/F Deposition pressure (x10-3 mBar) Average thickness (nm) Average growth rate (nm/min) WF2.5 20 8 2.5 15.5 308 154 WF5 20 4 5 10.5 337 109 WF10 20 2 10 7.5 351 58 WF20 20 1 20 5.9 242 30 WF40 40 1 40 6.2 395 33 WF70 70 1 70 6.4 314 31 WF140 140 1 140 6.7 257 29
Errors on average thicknesses are typically +/- 3 nm, deducted from the standard deviation over three measurements. For the quantitative Solid-state 29Si NMR analyses, four samples were
prepared (WF2.5 to WF20). These films were deposited on glass substrates and the powder was collected by scrapping the films with a metallic spatula. The deposition times for the WF2.5, WF5, WF10 and WF20 samples were 7, 13, 13, 28 hours, respectively, carried out twice for WF5 and WF10 and three times for WF20. Approximately, 400 mg was collected for each parameter set and packed into a ZrO2 rotor with a diameter of 7.5 mm.
For all other analytic methods, films were deposited on a (100) p-type silicon wafer (Si-Mat) in all conditions reported in Table 1.
2.2. Characterization methods:
Thin films thicknesses were determined by spectroscopic ellipsometry (Semilab GES5E) at atmospheric pressure. The data were collected from 1.2 to 4.5 eV and fitted using a composition of Cauchy transparent dispersion law and a Lorentz absorption term towards the UV range. The results are retained when the fit quality exceeds 0.99 in the full spectral range.
The FTIR absorption spectra were collected between 400 and 4000 cm-1 (Nicolet NEXUS)
in transmission mode at room temperature. The background signal (silicon wafer) was subtracted from all the spectra.
Solid State 29Si NMR spectra were recorded on a 300 MHz Varian VNMRS300 spectrometer
("Wide Bore" magnet at 7.05 Tesla) using a Varian T3 MAS (Magic Angle Spinning) probe with 7.5 mm ZrO2 rotors. Spectra were acquired using the quantitative SP technique (Single Pulse) with
Magic Angle Spinning and 1H decoupling. A π/2 pulse was used with a duration of 6 μs, the recycle
delay was chosen to be 60 s and the spinning rate of all the samples was 5 kHz. Q8M8H (octakis(dimethylsiloxy)octasilsesquioxane) was used as a secondary reference (left peak at -2.25 ppm). The width of the spectral window was 50 kHz and the line broadening was 50 Hz. The NMR spectra were fitted using Gaussian/Lorentzian peaks with DMFIT software package.
The XPS analysis were carried out using a Thermo Scientific K-Alpha X-ray Photoelectron Spectrometer. In order to record the photoemission spectra, Al-Kα radiation (hν = 1486.6 eV) was used from a monochromatized source. The diameter of the spot on the sample surface was 400
μm. We fixed the pass energy at 30 eV for narrow scan and at 170 eV for survey scans. A Shirley background was systematically subtracted. In the end, the photoelectron peaks were analysed and fitted using a combination of Lorentzian and Gaussian peaks in Thermo Avantage software.
3. Calculation
Density Functional computations were performed to calculate the electron core-level binding energies (BE) of Si atoms that are present in the environments shown in Figure 1 .
Four PP-HMDSO molecules containing the S, M, D, T and Q environments were used as models of subparts of the material. These molecules are presented in Figures S1 to S4 (SI). All geometries were fully optimized in vacuum using conjugate gradients methods. The gradient corrected PBE functional[32] was chosen together with the def2TZVP basis set[33,34] and Grimme’s dispersion corrections were added.[35,36] We used the Gaussian 09 package.[37] All the stationary points were characterized as minima by a vibrational analysis and it was followed by a NBO[38] population analysis to determine the atomic charges.
The calculation of Si2p BE was done in a second step within the ΔKS (Kohn Sham) framework using the deMon2k code.[39] Thus, the BE (∆KS) of electrons of the Si 2p core levels was determined using equation (1):
𝐵𝐸(∆𝐾𝑆) = 𝐸𝑇𝑂𝑇𝐴𝐿 (𝐼𝑜𝑛) − 𝐸𝑇𝑂𝑇𝐴𝐿 (𝑁𝑒𝑢𝑡𝑟𝑎𝑙)
(1)
With ETOTAL (Neutral) and ETOTAL (Ion) the total energies of the neutral (initial state) and ionized
(final state) molecules, respectively. The ionized molecule has one missing electron on the 2p orbital of the Si atom of interest.
To get these total energies, single point energy calculations were performed using the PBE functional[32], GENA2 auxiliary functions[40], an all electron potential and an augmented basis set (AUG-CC-PVTZ)[41] on the Si atom of interest, and a relativistic basis and effective core potentials (RECP|SD)[42] on the others atoms, excluding H atoms (DZVP).
4. Results and discussions
4.1. HMDSO polymerized FTIR spectra:
Figure 3 shows the FTIR spectra of HMDSO plasma polymerized films deposited with W/F = 2.5, 40 and 140. Strong absorption bands are observed at 2960 cm-1, 2140 cm-1, 1257 cm-1,
1010-1090 cm-1, 840 cm-1 and 795 cm-1 and a weak absorption band at 1354 cm-1. The absorption bands
at 2960 cm-1 and at 2140 cm-1 correspond to CH
3 stretching and Si-H stretching vibrations,
respectively. The absorption band at 1257 cm-1 represents CH
3 symmetric bending SiMex (Me
used as abbreviation for the methyl bond CH3). The wide band representing Si–O–Si stretching
vibrations is composed of two bands present between 1010 cm-1 and 1090 cm-1. Also, it can be
assigned to Si-O-C asymmetric stretching. Furthermore, the Si–CH2–Si absorption band is usually
observed at 1080 cm-1 – 1040 cm-1, but for oxygen containing coatings this peak is masked by the
Si-O-Si band [43],[44]. The absorption band at 840 cm-1 can be attributed to CH
3 rocking vibrations
absorption band at 1354 cm-1 is assigned to CH
2 scissor vibration in Si–CH2–Si.[3],[45]-[46] All
peaks are summarized in Table 2.
Figure 3: FTIR spectra of pp-HMDSO films deposited at different W/F values.
We observe a decrease in the intensity of the bands present at 2960 cm-1, 1257 cm-1, and 840
cm-1 while increasing the W/F value from 2.5 W/sccm to 140 W/sccm. This modification results
from the decrease in the number of CH3 bonds. We assume that the significant amount of
hydrocarbons bonds present at small W/F values (soft plasma conditions) is due to the low monomer fragmentation. Whereas the decrease in the CH3 bands intensities and the simultaneous
increase of the Si-H absorption band intensity at 2140 cm-1 at higher W/F values (hard plasma
conditions), is due to the higher monomer fragmentation. This result is consistent with the work of Sonnenfeld et al [47] who explained the loss of carbon containing groups by the increase of monomer fragmentation at higher plasma specific energy.
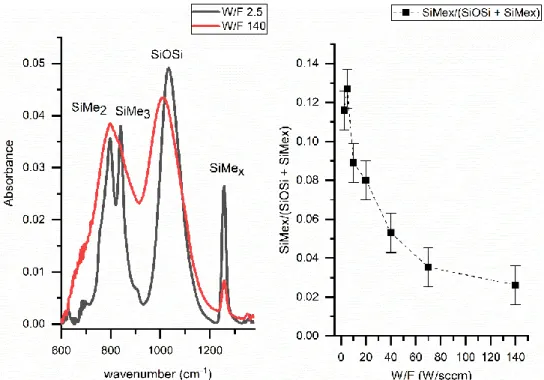
Figure 4: a) The FTIR spectra of WF2.5 and WF140 b) PDMS-like rate (SiMex /(SiOSi + SiMex)) of the films deposited at different W/F values.
Figure 4a shows a focused comparison of WF2.5 and WF140 infrared spectra, in the finer range 600-1400 cm-1. A broadening and a shift of the SiOSi peak are observed while depositing
under harder plasma conditions (140 W/sccm). This band modification is possibly due to the increase of the Si-O-C band intensity near 965 cm-1. Sonnenfeld et al assigned the absorption band
near 943 cm-1 in the FTIR spectra of a plasma polymerized TEOS to Si-O-C symmetric stretching
in Si-O-CH2. In fact, under hard plasma conditions, the high fragmentation induces the
introduction of carbon atoms in the Si-O-Si skeleton forming molecules containing Si-O-Si chains coupled with hydrocarbon branching. This molecules formation makes the skeleton chains more rigid explaining the shift of the SiOSi/SiOC band to lower wavenumber values (from 1032 cm-1 to
1010 cm-1). In addition, the presence of the Si-CH
2-Si bonds at higher W/F values is possible since
the FTIR spectra of the deposition from hexamethyldisilane reveal a broad band at 1020 cm-1 that
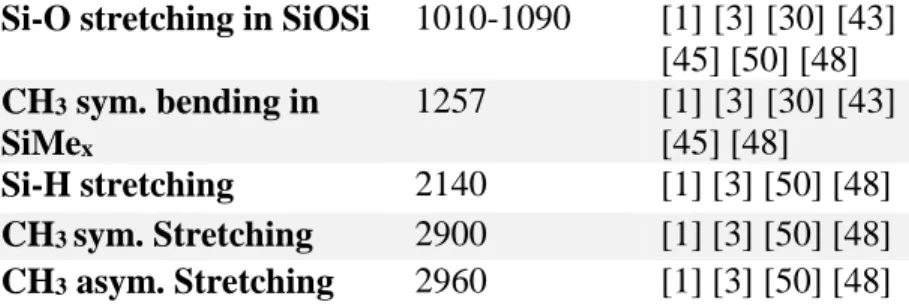
has been attributed to Si-CH2-Si bridge, previously.[48] Table 2: FTIR absorption bands of PP-HMDSO films
Chemical bond and vibration mode Band position (cm-1) References CH3 rocking in SiMe3 760 [1] [43] [49] CH3 rocking in SiMe2 795 [1][3] [30] [43] [50] [48] CH3 rocking in SiMe3 840 [1] [3] [30] [43] [50] [48]
Si-O stretching Si-OH /
Si-C stretching in SiMe2 902
[1] [43] [50]
Si-O stretching in SiOSi 1010-1090 [1] [3] [30] [43] [45] [50] [48] CH3 sym. bending in SiMex 1257 [1] [3] [30] [43] [45] [48] Si-H stretching 2140 [1] [3] [50] [48] CH3 sym. Stretching 2900 [1] [3] [50] [48] CH3 asym. Stretching 2960 [1] [3] [50] [48]
The SiMex /(SiOSi + SiMex) ratio , i.e. the area of the SiMex band divided by the sum of the
areas of SiOSi and SiMex bands, is defined as the PDMS-like rate, and shown in Figure 4b. The
areas of the peaks were calculated by peak decomposition of the infrared spectra using Labspec software. The uncertainty on the PDMS-like rate value, due to peak broadening or peaks superposition is taken as the standard deviation over three repeated syntheses of each sample. The decrease of the PDMS-like rate with increasing W/F proves that the character of the films synthesized under soft conditions is closer to PDMS than the films prepared under hard conditions. In fact, under hard conditions, the chemical and structural disorder due to the introduction of Si-O-C, Si-CH2-Si and Si-H bonds is responsible for the loss of the PDMS character.
4.2. 29Si NMR spectra:
In order to get a deeper knowledge of the bulk composition and structure, thin films were characterized by quantitative 29Si solid state NMR. The 29Si NMR spectra of the PP-HMDSO
deposited at 2.5 W/sccm and 20 W/sccm are shown in Figure 5. The spectra consist of 15 resonance lines listed in Table 3 that correspond to different environments distinguished by their oxidation state, i.e. M for SiO(CH3)3, D for SiO2(CH3)2, T for SiO3(CH3) and Q for SiO4. An additional
environment S appears around 0 ppm, it can be referred to SiC4 which is likely a SiC3 termination
bonded to CH2 bridge. Table 3 also shows the presence of different peaks grouped in the same
environment category; this is due to the change in the crosslinking degree or the substitution of methyl by hydrogen and hydroxyl groups.
Table 3: Positions and percentages of the environments in the PP-HMDSO deposited at different W/F value.
WF2.5 WF5 WF10 WF20 δ(29Si)/pp m Percentag e (%) δ(29Si)/pp m Percentag e (%) δ(29Si)/pp m Percentag e (%) δ(29Si)/pp m Percentag e (%) M1- Si(OSi)C3 8.9 27.4 9.0 20.3 11.4 14.7 13.7 5.4 M1- Si(OSi)C3 6.9 19.0 6.9 20.4 7.7 28.2 7.7 28.2 S – Si(CH2)C 3 -0.8 0.9 -0.4 2.1 0.0 3.3 0.6 4.3 D2 - Si(OSi)2C2 Low linearity -10.6 11.8 -8.6 10.4 -9.0 16.0 -8.0 15.6 D2 - Si(OSi)2C2 Intermediate linearity -18.9 10.0 -18.9 14.2 -18.9 14.7 -18.9 15.9 D2 - Si(OSi)2C2 High linearity -22.1 15.2 -22.1 10.2 -22.1 6.7 -22.1 7.0 D2(H) - Si(OSi)2CH -37.0 1.3 -36.7 2.2 -34.5 2.6 -34.8 3.5 T1 - Si(OSi)(OH)2 C -46.9 0.4 -46.7 0.6 -47.7 0.7 -46.1 0.4 T2 - Si(OSi)2(OH) H -56.0 3.9 -55.9 2.7 -55.2 2.9 -55.6 2.2 T3 - Si(OSi)3C -65.8 4.6 -65.7 3.5 -65.1 4.8 -64.9 3.3 T3(H) - Si(OSi)3 H -76.0 1.7 -76.5 1.6 -75.8 0.4 -76.5 1.3 Q1 - Si(OSi)(OH)3 -83.6 0.8 -82.2 0.1 -82 0.6 -85.7 1.2 Q2 - Si(OSi)2(OH)2 -88.3 0.5 -92.4 7.3 -92.9 3.0 -91.8 4.3 Q3 - Si(OSi)3OH -99.5 1.6 -97.5 0.3 -98.8 0.1 -98.2 4.5
Q4 - Si(OSi)4 -107.2 0.9 -104.5 4.1 -104.4 1.3 -106.3 2.9
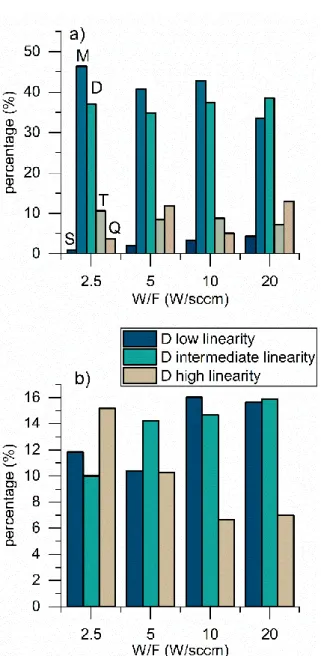
The variation of the environments percentages with the increase of W/F from 2.5 W/sccm to 20 W/sccm is shown in Table 3 and Figure 6a. The monotonic decrease of the M environment from 46% to 33%, reveals that the number of Si-(CH3)3 chain terminations is reduced with the
augmentation of W/F. On the other hand, the increase of the S component from 1% to 4% proves that the number of the Si-CH2 bonds is more important at higher W/F values. Also, the slight
growth of the D2(H) peak intensity observed in Figure 5 confirms the increase of the Si-H bonds in the PP-HMDSO deposits at greater W/F values. These variations validate that under soft plasma conditions, the monomer fragmentation is low causing the preservation of the Si-(CH3)3 bonds in
the bulk of the films. The increase of W/F values leads to the enhancement of the monomer fragmentation, giving rise to the Si-H and Si-CH2 bonds as previously demonstrated in the FTIR
section.
Three different D2 peaks are found that we presumably attribute to the more or less linear character of the D chains (high, intermediate, low). In fact, the linearity of the SiO2C2 chains is
linked to the fragmentation degree of the monomer. The SiO2C2 linear chains are flexible and
similar to the PDMS polymer chains, while the low and intermediate SiO2C2 chains are mostly
folded, which explains their low linearity and their dissimilarity with PDMS.
Figure 6b illustrates a remarkable drop of the percentage of the highly linear SiO2C2
component in addition to an important increase in the percentages of the chains with intermediate and low linearity while expanding W/F from 2.5 to 20 W/sccm. These evolutions demonstrate that PP-HMDSO films deposited under soft conditions are close to the conventional PDMS polymer. The low percentage of the T and Q environments compared to the M and D units indicates that the deposits character is highly organic. Indeed, these depositions were performed under soft conditions (W/F = 2.5 to 20 W/sccm) and without oxygen as dilution gas.
Figure 6: (a) NMR environments percentages of the films at different W/F (b) The percentages of the low linearity D (navy blue), intermediate linearity D (light blue) chains, and high linearity D (grey) chains at different W/F values.
4.3. X-ray photoelectron spectroscopy:
The BE of the Si 2p electrons, calculated in the ΔKS framework using equation (1) defined in the computational section above, are presented in Table 4, for the five environments S, M, D, T and Q. The m and m2 indices on some environments serves to differentiate them (see Table 4). Two additional environments were added in molecular models that corresponds to (CH3)2-Si-H2
and H2-Si-O2. The Si-O, Si-C, Si-H, C-C and C-H bonds lengths are in good agreement with the
experimental ones available in the literature (Table S1 SI).[51]-[52] In order to decompose the
peaks of the Si 2p experimental spectra, binding energy differences (∆BE∆KS) between the
environments are used. The S environment was considered as reference for all the BEs because of its lowest binding energy, therefore at this environment ∆BE∆KS = 0. The ∆BE∆KS calculated are
values obtained for M-S, D-M, T-D and Q-T in ref. [29] were 0.57, 0.36, 0.42 and 0.62 respectively. Thus, the ∆BE∆KS values calculated by DFT agree quite well with the ones found in
ref.[29].
The calculated charge of Si atoms (QSi) increases with the number of Si-O bonds, leading
to an increase in the binding energy of the Si 2p electrons. A good linear fit is obtained in the form of ∆BE∆KS = 0.26×QSi + 1.76 (r² = 0.85). Nevertheless, the charge of the two environments SiH2C2
and SiH2O2 does not follow this evolution. This is due to the neighbouring Si atoms that affect the
charge of the Si atom of interest in these environments. The calculated ∆BEs presented in column 6 Table 4 indicate that there is a non-linear increase in the binding energy when an oxygen replaces a methyl, in accordance with ref.[22]. These ∆BE∆KS are then used to decompose the experimental
XPS Si 2p core levels, as explained in the following.
Table 4: Si 2p BE, ∆BE (the reference is the S environment) values and Si NBO atomic charges determined from DFT calculations. Environment BE (∆KS) (eV) Standard deviation ∆BE∆KS (eV) ∆BE∆KS environment Charge QSi (e) Standard deviation S = SiC4 SiC4 107.74 0.00 1.81 SiC4 108.14 0.40 1.78 107.94 0.20 0.20 0.00 1.80 0.02 SiH2C2 SiH2C2 107.97 0.00 1.16 M = SiOC3 SiOC3 108.49 0.75 M-S = 0.80 1.97 SiOC3 108.49 0.76 1.98 SiOC3 m 108.61 0.87 2.01 SiOC3 108.65 0.91 1.98 SiOC3 108.67 0.94 1.98 SiOC3 m2 108.69 0.95 2.03 SiOC3 108.78 1.04 1.98 SiOC3 108.79 1.06 1.98 SiOC3 m 108.84 1.10 2.00 SiOC3 108.86 1.13 1.98 SiOC3 108.86 1.13 1.97 SiOC3 108.90 1.16 1.98 SiOC3 108.92 1.19 1.98 108.74 0.12 1.00 1.99 0.01 D = SiO2C2 SiO2C2 108.70 0.96 D-M = 0.45 2.20 SiO2C2 109.00 1.27 2.20 SiO2C2 109.10 1.37 2.16 SiO2C2 109.11 1.37 2.16 SiO2C2 109.15 1.41 2.16 SiO2C2 109.17 1.43 2.16 SiO2C2 m2 109.21 1.48 2.18 SiO2C2 109.21 1.48 2.16 SiO2C2 109.25 1.51 2.15 SiO2C2 109.25 1.51 2.16 SiO2C2 109.27 1.53 2.18 SiO2C2 109.27 1.53 2.16 SiO2C2 109.39 1.65 2.16 SiO2C2 m 109.54 1.80 2.20 109.19 0.13 1.45 2.17 0.02 SiO2H2 SiO2H2 109.57 0.00 1.63 T = SiO3C SiO3C 109.45 1.71 2.31 SiO3C 109.84 2.10 T-D = 0.56 2.30 SiO3C 109.97 2.23 2.30 109.75 0.20 2.01 2.30 0.00 Q = SiO4 SiO4 110.29 2.55 2.44 SiO4 110.37 2.63 2.43
110.33 0.04 2.59 Q-T = 0.58 2.43 0.00
Figure 7 shows the fitted Si 2p core levels for WF2.5, WF40 and WF140. All the Si 2p peaks were fitted with DFT S, M, D, T and Q components. The FWHM was fixed at 1.1 eV for all components. We used a PDMS conventional polymer as reference for the SiO2C2 (D) environment
and the calculated ∆BE∆KS to fix the BE of the components. A good fit to the Si 2p experimental
envelope was obtained except for the low-BE side of the peak. The high BE value of S as compared to the value found in Roualdes et al. [4] can originate from the choice of the shape of the component S (fixed like others), or to the lack of an additional unknown contribution.
Figure 7: The decomposed Si 2p core level of WF2.5, WF40, and WF140. Dotted line = experimental envelope, full line = calculated envelope.
The decomposition procedure of the Si 2p core levels is described hereafter. First, a PDMS homopolymer was used as a reference for the correct positioning of the SiO2C2 (D) environment.
In this sample, the PDMS O 1s core level exhibits a single oxidation state and is therefore used for charge correction. It is fixed at BE = 532.0 eV as advised by Beamson and Briggs.[53] The same charge correction value was used to adjust the binding energy of the pure D Si 2p envelope, resulting in BE (D) = 101.88 eV. In addition, Si 2p3/2 and Si 2p1/2 components were used to fit the
PDMS Si 2p core level with an equal FWHM, and an area ratio of 2:1. A good fit is obtained with an energy separation of 0.67 eV, in accordance with reference work.[22],[53] We then modelled
the synthetic peak that encompasses the Si 2p3/2 and Si 2p1/2 doublet (with asymmetry parameters),
the O 1s peak could not be used as a reference anymore because of the multiple environments of O atoms in unknown PP-HDMSO films, the position of the D component was fixed at 101.88 eV with regards to the maximum of the C 1s peak (fixed at 284.5 eV). Other components (S, M, T, and Q) positions are constrained by DFT calculated chemical shifts filled in the fitting procedure, and summarized in Table 4. Intensities were left free to fit. The positions of the S, M, D, T and Q components extracted from the decomposition procedure of the experimental spectra are shown in Table 5 and Figure 7.
Table 5: Binding energy of the various units present in Si 2p core level.
Environments Binding energy (eV) S ( SiC4) 100.6 M ( SiOC3) 101.4 D (SiO2C2) 101.9 T (SiO3C) 102.4 Q (SiO4) 103.0
Finally, the calculated Si 2p binding energies (BE) were used to generate the spectra shown in Figure 7 (full line = calculated envelope) together with the experimental spectrum (Dotted line = experimental envelope). The comparison of the curves shows a very good agreement between the calculated and experimental envelope.
The evolution of the environments percentages while increasing W/F is shown in Figure 8. The percentage of SiO2C2 (D) environment, which represents the conventional PDMS polymer,
decreases from 34.6 % to 21.4 % while increasing W/F. However, the M percentage evolves from 18.6 % to 28 % illustrating the augmentation of SiOC3 chain termination on the surface with
increasing W/F values. These variations confirm that under soft plasma conditions, the low fragmentation leads to the preservation of the SiO2C2 environments on the surface i.e. the
PP-HMDSO films are closer to PDMS. On the contrary, under hard plasma conditions, the high fragmentation results in a higher concentration of SiOC3 terminations on the surface, and the loss
of the PDMS structure. The SiOC3 component can be also assigned to -CH2-Si-(CH3)2- bonds.
These bonds formation is due to the introduction of carbon atoms in the SiOSi chains at hard plasma condition as shown in FTIR and RMN sections. In addition, Table 6 illustrates the evolution of the Si 2p, C 1s, and O 1s core levels FWHM while increasing W/F. The increase in the FWHM of the three core levels confirms the formation of new bonds on the surface such as CH2-Si-(CH3)2, Si-H, Si-O-C and Si-OH, leading to some disorder in the chains formation. In both
Figure 8: The percentages of S, M, D, T and Q components at different W/F values.
The high concentration of CH3 bonds and the low quantity of SiO4 units indicate that all the
deposits are organic. This can explain the low binding energy value of the SiO4 (Q) environment
compared to the binding energy of inorganic silica (103.2 eV for our reference, not shown). Besides, the SiO4 component can be referred to Si(OSi)x(OH)4-x environments. These hydroxyl
groups formation induces the loss of the inorganic Si(OSi)4 sites causing the shift of the binding
energy to lower values, and they are identified by RMN in the present study (see Q1-3 in Table 3).
Table 6: The evolution of the FWHM of Si 2p, C 1s, and O 1s core levels with W/F.
W/F (W/sccm) FWHM Si 2p C 1s O 1s 2.5 2.18 1.52 1.51 5 2.20 1.56 1.52 10 2.29 1.70 1.61 20 2.31 1.80 1.60 40 2.31 1.83 1.68 70 2.35 1.90 1.64 140 2.43 1.97 1.65
Figure 9: WCA measurements for PP-HMDSO thin films at different W/F values
Figure 9 shows the water contact angle (WCA) of all the PP-HMDSO thin films. The error on each value is deducted from the standard deviation over six repeated measurements. The WCA values for the PP-HMDSO films are higher than 90° except the film deposited at 140 W/sccm that reveals a lower WCA angle value (85.7°) but yet still close to 90°. Therefore, the hydrophobic character is dominant on all the PP-HMDSO film despite the WF140 deposit that shows relatively a low WCA value and can be considered as weakly hydrophobic. Indeed, as shown in the sections above all the deposits are considered organic due to the high amount of CH3 bonds and the low
quantity of SiO4 components present in the films. Despite the films hydrophobicity, the contact
angle value decreases while increasing W/F from 2.5 W/sccm to 140 W/sccm. This WCA change can be justified by the disorder occurred in the bonds formation while increasing W/F. In fact, the decrease of the Si-CH3 terminations amount and the formation of new bonds such as Si-H, Si-OH
and Si-O-C can reduce the WCA value. 4.5. Surface and Bulk comparison:
The FTIR, RMN and XPS analyses showed a difference in the composition between the bulk and the surface of the deposited films. At soft plasma conditions, the FTIR and RMN analyses showed an important amount of SiOC3 termination in the bulk of the prepared films. In addition,
the linear SiO2C2 chains that are close to chains found in conventional PDMS are present in high
concentration in the bulk. While the XPS analysis indicates that the number of SiO2C2 environment
is larger than the amount of SiOC3 component on the surface.
On the other hand, at high plasma conditions, the amount of SiOC3 units decreases while the
number of Si-H and Si-CH2-Si bonds increases in the bulk. In addition, the amount of the linear
SiO2C2 chains is lower at higher W/F values. XPS analyses showed a disorder in the bonds
formation in addition to an augmentation of the SiOC3 component and a decrease in the SiO2C2
unit on the surface.
As a conclusion, under soft plasma conditions, the low fragmentation of the monomer preserve the Si-(CH3)3 termination groups and promote the polymerization of linear SiO2C2 chains
in the bulk and on the surface, which is consistent with results of [46]. This structure elevates the flexibility of the chains and the formation of free volumes in the polymer network. Thus, this chemical composition gives the PP-HMDSO films a structure close to conventional PDMS. On the contrary, under hard plasma conditions, the high fragmentation of the monomer favours the
formation of random bonds leading to a cross-linked network, more rigid with little amount of free volumes. Therefore, a formation of Si-H, Si-O-C, Si-CH2-Si bonds and a change in the SiO2C2
structure are shown in the material bulk. Also, the growth of the material network induces an increase of the SiOC3 concentration on the surface.
5. Conclusion
We have presented an investigation of the PP-HMDSO thin films bulk and surface chemical compositions. The films were prepared in a MW-PECVD reactor under different plasma conditions ranging from “soft” (i.e. low HMDSO fragmentation) to “hard” (i.e. higher HMDSO fragmentation). Specific characterisation techniques were used to determine the bulk composition such as 29Si quantitative solid-state NMR and FTIR spectroscopy. A combination between X-ray
photoelectron spectroscopy (XPS) and DFT calculations was used to determine the surface chemical composition. The chemical composition comparison showed a difference between the bulk and the surface of the films. Under soft plasma conditions, a high amount of SiOC3
termination is present in the bulk of the films. In addition, the linear SiO2C2 chains that are close
to PDMS chains are present in high concentration in the bulk of the prepared films. While the concentration of the SiO2C2 chains is higher than the number of the SiOC3 component on the
surface. On the contrary, under hard plasma conditions, the concentration of the SiOC3 termination
decreases while the amount of Si-H and Si-CH2-Si bonds increases in the bulk. In addition, the
linear SiO2C2 chains decreases in the bulk at hard plasma conditions. On the surface, the number
of SiOC3 unit increases and the amount of the linear SiO2C2 chains decreases. The PP-HMDSO
deposited under soft conditions shows a high PDMS-like rate, while the PP-HMDSO prepared under hard plasma conditions shows a disorder in the bonds formation. The study of the bulk and surface chemical compositions of the PP-HMDSO thin films, contributes to the understanding of the sorption phenomena of VOC vapors (especially for BTEX), on organosilicon membranes that will be analyzed and presented in a future article.
Appendix A. Supporting Information
Images of the simulated molecules using Gabedit ref. 1 in SI.
Validation of the molecular simulation by comparing bond lengths with experimental data.
Corresponding Author
*Corresponding Author Email: vincent.rouessac@umontpellier.fr, Tel. +33. (0) 4 67 14 91 45
Acknowledgements
This work was granted access to the HPC resources of CALMIP supercomputing center under the allocation 2019- 2020 [p1526]. It was also supported by the French Carnot Institute
REFERENCES
[1] F. Benıtez, E. Martınez, J. Esteve, Improvement of hardness in plasma polymerized hexamethyldisiloxane coatings by silica-like surface modification, Thin Solid Films. 377 (2000) 109–114.
[2] K. Aumaille, C. Vallée, A. Granier, A. Goullet, F. Gaboriau, G. Turban, A comparative study of oxygen/organosilicon plasmas and thin SiOxCyHz films deposited in a helicon reactor, Thin Solid Films. 359 (2000) 188–196.
[3] D.S. Wavhal, J. Zhang, M.L. Steen, E.R. Fisher, Investigation of gas phase species and deposition of SiO2 films from HMDSO/O2 plasmas, Plasma Process. Polym. 3 (2006) 276– 287.
[4] S. Roualdes, R. Berjoan, J. Durand, 29Si NMR and Si2p XPS correlation in polysiloxane membranes prepared by plasma enhanced chemical vapor deposition, Sep. Purif. Technol. 25 (2001) 391–397.
[5] P. Bringmann, O. Rohr, F.J. Gammel, I. Jansen, Atmospheric pressure plasma deposition of adhesion promotion layers on aluminium, Plasma Process. Polym. 6 (2009) S496–S502. [6] C.E. Nwankire, G. Favaro, Q. Duong, D.P. Dowling, Enhancing the mechanical properties of
superhydrophobic atmospheric pressure plasma deposited siloxane coatings, Plasma Process. Polym. 8 (2011) 305–315.
[7] S. Kurosawa, B.-G. Choi, J.-W. Park, H. Aizawa, K.-B. Shim, K. Yamamoto, Synthesis and characterization of plasma-polymerized hexamethyldisiloxane films, Thin Solid Films. 506 (2006) 176–179.
[8] L. Zajíčková, V. Buršíková, Z. Kučerová, J. Franclova, P. Sťahel, V. Peřina, A. Mackova, Organosilicon thin films deposited by plasma enhanced CVD: Thermal changes of chemical structure and mechanical properties, J. Phys. Chem. Solids. 68 (2007) 1255–1259.
[9] J. Perrin, O. Leroy, M.C. Bordage, Cross‐Sections, Rate Constants and Transport Coefficients in Silane Plasma Chemistry, Contrib. to Plasma Phys. 36 (1996) 3–49.
[10] R. Förch, A.N. Chifen, A. Bousquet, H.L. Khor, M. Jungblut, L. Chu, Z. Zhang, I. Osey‐Mensah, E. Sinner, W. Knoll, Recent and expected roles of plasma‐polymerized films for biomedical applications, Chem. Vap. Depos. 13 (2007) 280–294.
[11] R.P. Mota, D. Galvão, S.F. Durrant, M.A.B. De Moraes, S. de Oliveira Dantas, M. Cantão, HMDSO plasma polymerization and thin film optical properties, Thin Solid Films. 270 (1995) 109–113.
[12] U. Lommatzsch, J. Ihde, Plasma polymerization of HMDSO with an atmospheric pressure plasma jet for corrosion protection of aluminum and low‐adhesion surfaces, Plasma Process. Polym. 6 (2009) 642–648.
[13] S.J. Kim, E. Song, K. Jo, T. Yun, M.-W. Moon, K.-R. Lee, Composite oxygen-barrier coating on a polypropylene food container, Thin Solid Films. 540 (2013) 112–117.
[14] Y.-H. Kim, S.-K. Lee, H.J. Kim, Low-k Si–O–C–H composite films prepared by plasma-enhanced chemical vapor deposition using bis-trimethylsilylmethane precursor, J. Vac. Sci. Technol. A Vacuum, Surfaces, Film. 18 (2000) 1216–1219.
[15] S. Roualdes, J. Sanchez, J. Durand, Gas diffusion and sorption properties of polysiloxane membranes prepared by PECVD, J. Memb. Sci. 198 (2002) 299–310.
material for hydrocarbon vapor selectivity, J. Memb. Sci. 230 (2004) 49–59.
[17] J. El Sabahy, J. Berthier, F. Ricoul, V. Jousseaume, Toward optimized SiOCH films for BTEX detection: Impact of chemical composition on toluene adsorption, Sensors Actuators B Chem. 258 (2018) 628–636.
[18] M. Lépinay, L. Broussous, C. Licitra, F. Bertin, V. Rouessac, A. Ayral, B. Coasne, Predicting adsorption on bare and modified silica surfaces, J. Phys. Chem. C. 119 (2015) 6009–6017. [19] C.J. Hall, T. Ponnusamy, P.J. Murphy, M. Lindberg, O.N. Antzutkin, H.J. Griesser, A solid-state nuclear magnetic resonance study of post-plasma reactions in organosilicone microwave plasma-enhanced chemical vapor deposition (PECVD) coatings, ACS Appl. Mater. Interfaces. 6 (2014) 8353–8362.
[20] J. Petersen, R. Bechara, J. Bardon, T. Fouquet, F. Ziarelli, L. Daheron, V. Ball, V. Toniazzo, M. Michel, A. Dinia, Atmospheric Plasma Deposition Process: A Versatile Tool for the Design of Tunable Siloxanes‐Based Plasma Polymer Films, Plasma Process. Polym. 8 (2011) 895–903.
[21] P.-Y. Mabboux, K.K. Gleason, Chemical bonding structure of low dielectric constant Si: O: C: H films characterized by solid-state NMR, J. Electrochem. Soc. 152 (2005) F7–F13. [22] L. O’Hare, B. Parbhoo, S.R. Leadley, Development of a methodology for XPS curve‐fitting
of the Si 2p core level of siloxane materials, Surf. Interface Anal. An Int. J. Devoted to Dev. Appl. Tech. Anal. Surfaces, Interfaces Thin Film. 36 (2004) 1427–1434.
[23] M.R. Alexander, R.D. Short, F.R. Jones, W. Michaeli, C.J. Blomfield, A study of HMDSO/O2 plasma deposits using a high-sensitivity and-energy resolution XPS instrument: curve fitting of the Si 2p core level, Appl. Surf. Sci. 137 (1999) 179–183.
[24] E. Kedroňová, L. Zajíčková, D. Hegemann, M. Klíma, M. Michlíček, A. Manakhov, Plasma enhanced CVD of organosilicon thin films on electrospun polymer nanofibers, Plasma Process. Polym. 12 (2015) 1231–1243.
[25] C. Chaiwong, P. Rachtanapun, S. Sarapirom, D. Boonyawan, Plasma polymerization of hexamethyldisiloxane: Investigation of the effect of carrier gas related to the film properties, Surf. Coatings Technol. 229 (2013) 12–17.
[26] M.R. Alexander, R.D. Short, F.R. Jones, M. Stollenwerk, J. Zabold, W. Michaeli, An X-ray photoelectron spectroscopic investigation into the chemical structure of deposits formed from hexamethyldisiloxane/oxygen plasmas, J. Mater. Sci. 31 (1996) 1879–1885.
[27] T. Duguet, C. Bessaguet, M. Aufray, J. Esvan, C. Charvillat, C. Vahlas, C. Lacaze-Dufaure, Toward a computational and experimental model of a poly-epoxy surface, Appl. Surf. Sci. 324 (2015) 605–611.
[28] A. Gavrielides, T. Duguet, J. Esvan, C. Lacaze-Dufaure, P.S. Bagus, A poly-epoxy surface explored by Hartree-Fock ΔSCF simulations of C1s XPS spectra, J. Chem. Phys. 145 (2016) 74703.
[29] W. Motozaki, T. Otsuka, K. Endo, D.P. Chong, Electron binding energies of Si 2p and S 2p for Si-and S-containing substances by DFT calculations using the model molecules, Polym. J. 36 (2004) 600–606.
[30] M. Haacké, R. Coustel, V. Rouessac, S. Roualdès, A. Julbe, Microwave PECVD silicon carbonitride thin films: A FTIR and ellipsoporosimetry study, Plasma Process. Polym. 13 (2016) 258–265.
293.
[32] J.P. Perdew, K. Burke, M. Ernzerhof, Generalized gradient approximation made simple, Phys. Rev. Lett. 77 (1996) 3865-3868.
[33] F. Weigend, R. Ahlrichs, Balanced basis sets of split valence, triple zeta valence and quadruple zeta valence quality for H to Rn: Design and assessment of accuracy, Phys. Chem. Chem. Phys. 7 (2005) 3297–3305.
[34] F. Weigend, Accurate Coulomb-fitting basis sets for H to Rn, Phys. Chem. Chem. Phys. 8 (2006) 1057–1065.
[35] S. Grimme, Semiempirical GGA‐type density functional constructed with a long‐range dispersion correction, J. Comput. Chem. 27 (2006) 1787–1799.
[36] S. Grimme, J. Antony, S. Ehrlich, H. Krieg, A consistent and accurate ab initio parametrization of density functional dispersion correction (DFT-D) for the 94 elements H-Pu, J. Chem. Phys. 132 (2010) 154104.
[37] M. Frisch, G.W. Trucks, H.B. Schlegel, G.E. Scuseria, M.A. Robb, J.R. Cheeseman, G. Scalmani, V. Barone, B. Mennucci, G.A. ea Petersson, Gaussian∼ 09 Revision D. 01, (2014). [38] E.D. Glendening, A.E. Reed, J.E. Carpenter, F. Weinhold, NBO Version 3.1, There Is No
Corresp. Rec. This Ref. Sch. (1998).
[39] G. Geudtner, P. Calaminici, J. Carmona‐Espíndola, J.M. del Campo, V.D. Domínguez‐Soria, R.F. Moreno, G.U. Gamboa, A. Goursot, A.M. Köster, J.U. Reveles, DeMon2k, Wiley Interdiscip. Rev. Comput. Mol. Sci. 2 (2012) 548–555.
[40] P. Calaminici, F. Janetzko, A.M. Köster, R. Mejia-Olvera, B. Zuniga-Gutierrez, Density functional theory optimized basis sets for gradient corrected functionals: 3 d transition metal systems, J. Chem. Phys. 126 (2007) 44108.
[41] T.H. Dunning Jr, Gaussian basis sets for use in correlated molecular calculations. I. The atoms boron through neon and hydrogen, J. Chem. Phys. 90 (1989) 1007–1023.
[42] R. Flores‐Moreno, R.J. Alvarez‐Mendez, A. Vela, A.M. Köster, Half‐numerical evaluation of pseudopotential integrals, J. Comput. Chem. 27 (2006) 1009–1019.
[43] Y. Liu, F. Elam, E. Zoethout, S. Starostin, R. Van de Sanden, H. De Vries, Atmospheric-pressure silica-like thin film deposition using 200 kHz/13.56 MHz dual frequency excitation, J. Phys. D. Appl. Phys. 52 (2019) 355201.
[44] T. Brenner, K. Vissing, New insight into organosilicon plasma‐enhanced chemical vapor deposition layers and their crosslinking behavior by calculating the degree of Si‐ networking, Plasma Process. Polym. (n.d.) e1900202.
[45] M.A. Gilliam, S.A. Farhat, G.E. Garner, B.P. Stubbs, B.B. Peterson, Characterization of the deposition behavior and changes in bonding structures of hexamethyldisiloxane and decamethylcyclopentasiloxane atmospheric plasma-deposited films, Plasma Process. Polym. 16 (2019) e1900024. https://doi.org/10.1002/ppap.201900024.
[46] R. Morent, N. De Geyter, S. Van Vlierberghe, P. Dubruel, C. Leys, E. Schacht, Organic– inorganic behaviour of HMDSO films plasma-polymerized at atmospheric pressure, Surf. Coatings Technol. 203 (2009) 1366–1372.
[47] A. Sonnenfeld, T.M. Tun, L. Zajíčková, K. V Kozlov, H.-E. Wagner, J.F. Behnke, R. Hippler, Deposition process based on organosilicon precursors in dielectric barrier discharges at atmospheric pressure—a comparison, Plasmas Polym. 6 (2001) 237–266.
hexamethyldisiloxane discharge in microwave multipolar plasma at different electrical powers, Plasma Process. Polym. 2 (2005) 45–52.
[49] G. Socrates, Infrared and Raman characteristic group frequencies: tables and charts, John Wiley & Sons, 2004.
[50] H. Nagasawa, T. Minamizawa, M. Kanezashi, T. Yoshioka, T. Tsuru, Microporous organosilica membranes for gas separation prepared via PECVD using different O/Si ratio precursors, J. Memb. Sci. 489 (2015) 11–19.
[51] M.G.M. Van der Vis, R.J.M. Konings, A. Oskam, T.L. Snoeck, The vibrational spectra of gaseous and liquid tetraethoxysilane, J. Mol. Struct. 274 (1992) 47–57.
[52] M.T. Tribble, N.L. Allinger, Conformational analysis—LXXXIII: Calculation of the structures and energies of silanes by the method of molecular mechanics, Tetrahedron. 28 (1972) 2147–2156.
[53] G. Beamson, D. Briggs, The scienta ESCA 300 database, High Resolut. XPS Org. Polym. (1992).