Université de Montréal
Étude électrophysiologique de l’impact de la couleur dans le déploiement attentionnel
par
Vincent Jetté Pomerleau
Département de Psychologie Faculté des arts et des sciences
Mémoire présenté à la faculté de Psychologie En vue de l’obtention du grade de maîtrise (M.Sc.)
En psychologie
Janvier, 2014
iii
Université de Montréal Faculté des Arts et des Sciences
Ce mémoire intitulé :
Étude électrophysiologique de l’impact de la couleur dans le déploiement attentionnel
Présenté par : Vincent Jetté Pomerleau
a été évalué par un jury composé des personnes suivantes :
Frédéric Gosselin, président-rapporteur Pierre Jolicoeur, directeur de recherche Marc Schoenwiesner, membre du jury
Résumé :
L’influence de la couleur dans les mécanismes perceptuels et attentionnels a été étudiée. Quatre couleurs (le rouge, le vert, le bleu et le jaune) ont été calibrées individuellement à travers la technique heterochromatic flicker photometry. Suivant cela, les participants ont déployé leur attention à une cible (un cercle de couleur avec une ligne orientée). Les données électrophysiologiques ont été enregistrées pendant que les sujets performaient la tâche de recherche visuelle, et les analyses ont été basées sur les potentiels évoqués (PÉs). Trois composantes des PÉs ont été examinées : la posterior contralateral positivity (Ppc); la N2pc, reflétant le déploiement de l’attention visuo-spatiale et la temporal and
contralateral positivity (Ptc). Des conditions dans lesquelles la cible était bleu ou rouge, lorsque comparées à des conditions avec une cible jaune ou verte suscitaient une N2pc plus précoce. Une amplitude plus élevée est aussi observée pour les cibles rouges pour les composantes Ppc et Ptc, reflétant une sélectivité pré-attentionelle. Ces résultats suggèrent de la prudence dans l’interprétation de données comparant des cibles de différentes couleurs dans des tâches de PÉs, et ce même lorsque les couleurs sont équiluminantes.
Mots-clés : Attention visuo-spatiale, potentiels évoqués, Clignement attentionnel, N2pc, Ppc, Ptc, heterochromatic flicker photometry
ii Abstract :
We investigated how target color affected behavioral and electrophysiological results in a visual search task. Perceptual and attentional mechanisms were tracked using the N2pc component of the event-related potential and other lateralized components. Four colors (red, green, blue, or yellow) were calibrated for each participant for luminance through heterochromatic flicker photometry and equated to the luminance of grey distractors. Each visual display contained 10 circles, 1 colored and 9 grey, each of which contained an oriented line segment. The task required deploying attention to the colored circle, which was either in the left or right visual hemifield. Three lateralized ERP components relative to the side of the lateral colored circle were examined: a posterior contralateral positivity (Ppc) prior to N2pc, the N2pc, reflecting the deployment of visual spatial attention, and a temporal and contralateral positivity (Ptc) following N2pc. Red or blue stimuli, as compared to green or yellow, had an earlier N2pc. Both the Ppc and Ptc had higher amplitudes to red stimuli, suggesting particular selectivity for red. The results suggest that attention may be deployed to red and blue more quickly than to other colors and suggests special caution when designing ERP experiments involving stimuli in different colors, even when all colors are equiluminant.
Keywords : Visual-spatial attention, event-related potentials, Attentional Blink, N2pc, Ppc, Ptc, heterochromatic flicker photometry
iii Table des matières
Table des tableaux... iv
Table des illustrations ... v
Liste des abréviations:... vi
Remerciements... vii
Introduction... 1
La N2pc... 3
La Ppc ... 5
La Ptc ... 5
Objectif particulier ou hypothèse... 6
Méthodologie ... 7
Calibration... 7
Tâche électrophysiologique –Expérience 1 ... 9
Tâches contrôles –Expériences 2a et 2b ... 11
Color specific differences in attentional deployment ... 13
for equiluminant pop-out colors: Evidence from lateralized potentials... 13
Colors and visual spatial attention ... 15
The N2pc... 18 The Ppc ... 19 The Ptc ... 20 Experiment 1... 22 Method ... 22 Experiment 1 results ... 28 Discussion- Experiment 1 ... 34 Experiment 2a and 2b ... 38 Method ... 39
Experience 2a and 2b results... 40
Discussion Experiment 2a and 2b... 41
General discussion ... 43 Conclusion ... 47 References... 48 Figure Captions... 57 Discussion ... 69 Conclusion ... 77 Références... 78
iv Table des tableaux
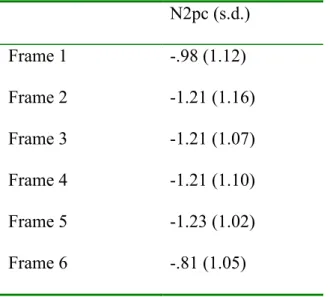
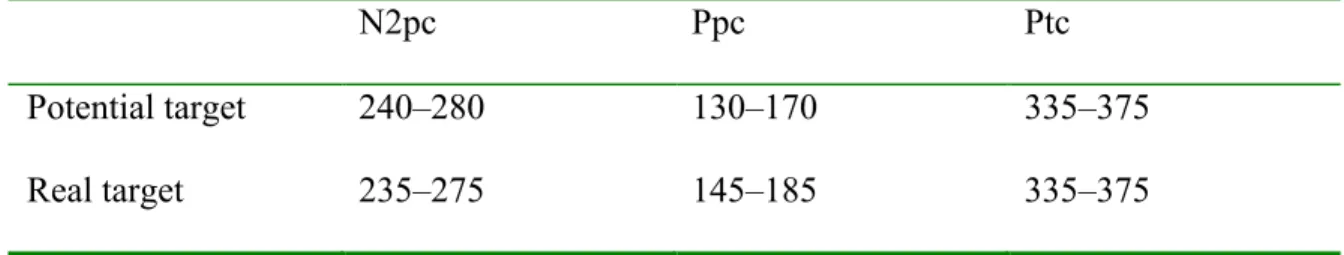
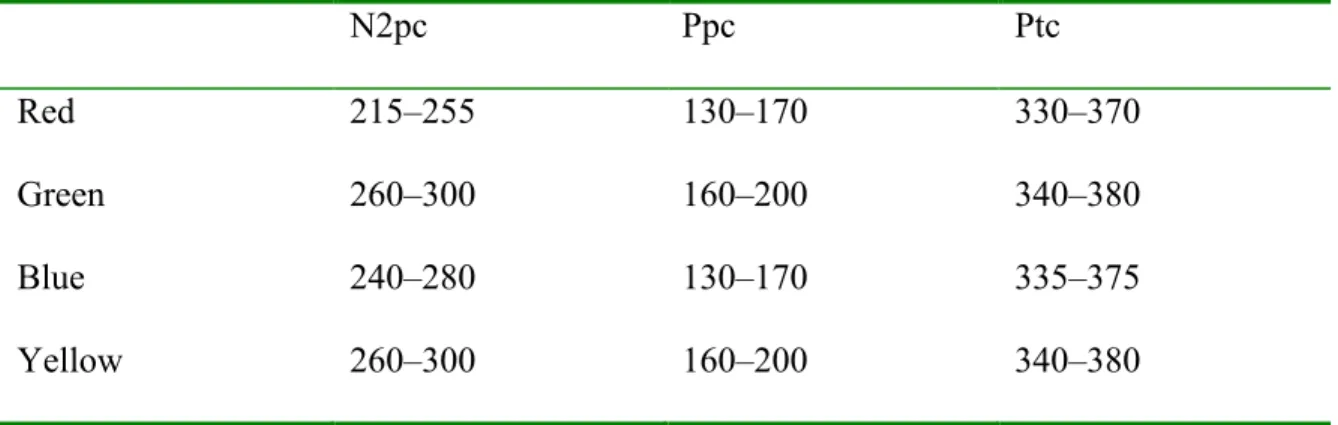
Table 1. Mean amplitude and standard deviation of the N2pc in microvolt (µV) for each frame position. ... 51 Table 2. Time windows for targets and potential targets (color singleton containing a non-target line orientation) for the N2pc, Ppc, and Ptc components, in milliseconds, post stimulus... 52 Table 3. Time windows for N2pc, Ppc, and Ptc in milliseconds, post stimulus, for each singleton color... 53 Table 4. Mean amplitude (µV) and standard deviation for the N2pc, Ppc, and Ptc, for each singleton color. ... 54 Table 5. Mean latency of the onset of the N2pc, in milliseconds (ms), and standard
deviation, for each singleton color... 55 Table 6. Mean response time (ms) and standard deviation for each control tasks, from Experiment 2... 56
v Table des illustrations
Figure 1 ... 59 Figure 2 ... 60 Figure 3a ... 61 Figure 3b ... 61 Figure 5 ... 63 Figure 6 ... 64 Figure 7 ... 65 Figure 8 ... 66 Figure 9 ... 67 Figure 10 ... 68
vi Liste des abréviations:
AB : Attentional blink
ANOVA : Analysis of variance CA : clignement attentionnel EEG : Electroencephalographam EEG : Électroencéphalographique ERP : Event-related potentials MFP : Multiframe procedure MS : millesecondes
MS : milliseconds
N2pc : Negative 200 posterior contralateral PÉ : Potentiels évoqués
Ppc : Positive posterior contralateral Ptc : Positive posterior contralateral RGB : Red green blue
RT : Response times RVB : Rouge vert bleu TR : Temps de réponse µV : microvolts
vii Remerciements
Pour le soutien financier, j’aimerais tout d’abord remercier mon directeur, la faculté des études supérieures, le Conseil de recherches en sciences naturelles et en génie du Canada (CRSNG) et le Fonds québécois en recherche naturelles et technologies.
Pour son support, les consultations, les réunions de laboratoire et les multiples corrections, j’aimerais grandement remercier mon directeur, le Docteur Pierre Jolicoeur. Par la même occasion, j’aimerais souligner l’importance de tous mes collaborateurs directs : Ulysse Fortier-Gauthier, Isabelle Corriveau, Roberto Dell’Acqua, Pia Amping et Christine Lefebvre; et indirects : Mercédès Aubin, Kristelle Alunni, Manon Maheux, Patrick Bermudez, Sébrina Aubin, Sophie Nolden, Stephan Grimault, Brandi Drisdelle et Avital Cherniawsky sans qui ce travail n’aurait pas pu être réalisé.
For handling my daily ups and downs, for being there all the time when I need it, and just for being the way he is, I wish to thank my love, Fernando. You supported me in many ways that you don’t even realize.
Pour leur support, je remercie ma famille, particulièrement ma mère, sans qui je ne me serais jamais rendu ici et mon frère, le meilleur papa du monde, qui bien avant ce travail m’a donné un titre indélébile, celui de parrain. Merci.
Pour avoir été là, j’aimerais remercier Arnaud Demoustier, confident, psychologue et âme sœur. Également, j’aimerais remercier tous mes amis, particulièrement, Alexandra, Stéphanie, Nicholas et Julien.
Introduction
Position du problème
Deux théories d’analyse de la couleur ont été en opposition durant plusieurs années. Historiquement, la première est la théorie trichromatique de Young-Helmotz. Celle-ci repose sur un système de 3 récepteurs de sensibilité spectrale différente : les cônes bleus, verts et rouges, couvrant l’ensemble du spectre des couleurs visibles (Baylor, Nunn, & Schnapf, 1987; Buchsbaum & Gottschalk, 1983). Pour palier ce qui semblait être des inconsistances dans la théorie trichromatique, une seconde théorie, celle des processus opposés a été élaborée (Buchsbaum & Gottschalk, 1983). Celle-ci fait appel à des récepteurs répondant de façon opposée à des longueurs d’onde différentes : les neurones opposés du noyau géniculé latéral. Ces neurones génèrent donc un influx seulement pour une des couleurs présente dans son champ récepteur. Les couleurs en opposition sont: le bleu et le jaune, le rouge et le vert ainsi que le blanc et le noir. On sait aujourd’hui que les deux théories sont exactes et reflètent des mécanismes en œuvre soit en périphérie (théorie trichromatique) ou plus centraux (théorie des processus opposés) (De Valois, Abramov, & Jacobs, 1966).
En psychologie cognitive, la couleur est connue pour être un indice efficace pour la sélection attentionnelle (Clark, 1969; Posner, 1980; Von Wright, 1972). Une telle sélection est pertinente pour éviter la perte d’informations, puisque les mécanismes attentionnels ou de mémoire ne peuvent que traiter ou contenir un nombre limité d’objets simultanément (Cowan, 2001; Sperling, 1960). De plus, la littérature suggère que les mécanismes de l’attention visuo-spatiale traitent les items de façon sérielle
2
(individuellement ou en petits groupes) à un moment dans le système visuel de façon à pouvoir les identifier plus en détail (Sperling, 1960; Treisman & Gelade, 1980).
La couleur est souvent utilisée dans des études en attention visuo-spatiale. Dans la plupart de ces études, la couleur permet d’identifier des stimuli en tant que cible ou distracteur. La prochaine section a pour but d’orienter le lecteur avec quelques études clés dans lesquels la couleur est un facteur expérimental important. Ce survol n’est pas une revue complète des thèmes de l’attention et de la couleur (à ce sujet, voire Carter, 1982; Treisman & Gelade, 1980; Wolfe, 1994).
Deux études récentes évaluent la contribution de la couleur à l’attention visuo-spatiale. La première étudie la contribution de la couleur au traitement du mouvement dans la sélection automatique de cibles (Tchernikov & Fallah, 2010). Les auteurs ont comparé des saccades oculaires à des agrégats de points de couleurs différentes. Les points contenus dans les agrégats étaient tous de même couleur et équiluminants (rouge, vert, jaune ou bleu). L’expérience 1 mesurait la rapidité et la direction des saccades selon les différentes couleurs, pour un seul agrégat, après qu’un point de fixation disparaisse. L’expérience 2 comparait les couleurs en observant la sélection automatique de cibles à travers un choix forcé entre deux agrégats de points de deux différentes couleurs allant dans des directions opposées. Ensemble, ces expériences démontrent une hiérarchie des couleurs dans laquelle un biais de sélection des saccades va du rouge (le plus élevé), au vert, au jaune et puis au bleu (le plus faible).
Un second article évalue les temps de réaction (TRs) à différentes cibles de couleurs désaturées (Lindsey et al., 2010). Des cibles désaturées étaient placées parmi des distracteurs saturés ou blancs. Pour minimiser les différences dans l’apparence des
3
couleurs, les auteurs ont choisi des cibles désaturées (30cd/m2) qui se trouvent au centre d’une droite entre les distracteurs saturés (12 cd/m2) et blancs (60cd/m2) dans l’espace de couleur CIE L*ab. Ces couleurs ont de plus été testées dans deux expériences contrôle, l’une impliquant un appariement hétérochromatique (heterochromatic matching) et une seconde, basée sur la différence maximale de ressemblance (Maximum Likelihood Difference Scaling). Les couleurs utilisées étaient : rouge, vert, bleu et orange, toutes désaturées. Les auteurs trouvent des TRs plus rapides pour les couleurs chaudes (rouge) et plus lents pour les couleurs plus froides (bleu-mauve). Les graphiques rapportent des TRs plus rapides pour le jaune que le vert, mais ces résultats ne sont pas discutés dans l’article.
Il ressort de ces études qu’il semble y avoir un biais attentionnel pour certaines couleurs par rapport à d’autres. Jusqu’à présent, seulement des TRs ont été rapportés. Dans ce projet, la technique des potentiels évoqués (PÉs) sera utilisée comme outil d’investigation dans le déploiement attentionnel à des cibles de différentes couleurs équiluminantes. Notre but premier sera ainsi de déterminer si des mécanismes neuronaux attentionnels pourraient refléter ce biais. Dans cette étude, les couleurs qui seront choisies seront le rouge, le vert, le bleu et le jaune et les composantes à l’étude seront la N2pc, la Ppc et la Ptc.
Contexte théorique La N2pc
La N2pc est une composante des PÉs observable en soustrayant l’activité électrique des électrodes ipsilatérales à l’activité électrique aux électrodes controlatérales
4
à l’hémichamp visuel d’un objet dans le focus attentionnel. La N2pc est enregistrée à des sites postérieurs du scalp, avec une activité maximale aux sites PO7/PO8. La latence de la N2pc est dans l’intervalle des composantes N2, entre 180 et 250 ms suivant la présentation du stimulus (Brisson & Jolicoeur, 2007; Luck & Hillyard, 1994; Robitaille & Jolicoeur, 2006). Luck and Hillyard (1994) soutiennent que la N2pc reflète un filtrage spatial des distracteurs, et Eimer (1996) ainsi que Mazza (Mazza, Turatto, & Caramazza, 2009a, 2009b) soutiennent qu’elle reflète plutôt une amplification de la réponse neuronale à la cible.
La couleur est souvent utilisée dans les expériences qui mesurent la N2pc (Eimer, 1996; Hickey, Di Lollo, & McDonald, 2009). Ces études ont des conditions dans lesquelles la cible est d’une couleur et les distracteurs d’une autre, tout en s’assurant d’avoir des stimuli équiluminants. Également, un nombre égal de participants ou d’essais avec une cible de chaque couleur est effectué avant de tout moyenner. L’effet direct des couleurs a été très peu étudié en tant que tel. Lorsqu’il l’est, les études abordent généralement des questions de recherche non reliées à la chromaticité (par exemple : l’effet du langage sur la détection/la disparité entre cible et distracteur). Il y a donc une quasi-absence de tests de latence et d’amplitude de la N2pc faits entre les différentes couleurs expérimentales (Liu et al., 2009; Regier & Kay, 2009).
Un article récent utilise la N2pc afin d’évaluer le rôle de la disparité physique de couleurs entre cibles et distracteurs (Zhao et al., 2011). Dans leur étude, les auteurs modulent la différence physique entre cible et distracteur en observant les effets sur la composante. Les auteurs comparent des conditions dans lesquelles la disparité du distracteur est élevée (distracteur bleu pâle/ cible bleu foncé) et une condition dans
5
laquelle elle est faible (distracteur bleu moyen/ cible bleu foncé) en manipulant les valeurs RVB (rouge vert bleu) des couleurs des stimuli. Tout au long de l’expérience, les stimuli utilisés sont équiluminants. Les participants doivent trouver la cible (une croix) qui est différente des autres, et décider si celle-ci a un trait inférieur égal ou non au trait supérieur. Un effet principal de disparité de couleur est rapporté, l’amplitude moyenne de la condition avec haute disparité est plus négative que la condition de faible disparité. Un effet marginal de latence est également rapporté, la N2pc reliée à la condition de faible disparité étant plus retardée que N2pc de la condition de disparité élevée.
La Ppc
La posterior contralateral positivity (Ppc) est une composante latéralisée, apparaissant avant la N2pc, entre150 à 200 ms post stimulus. L’amplitude moyenne de la Ppc et sa latence ne dépendent pas de l’intervalle de temps entre les stimuli et est suscitée autant par des distracteurs que des cibles (Corriveau et al., 2012). La composante semble refléter la représentation d’un champ visuel débalancé, lorsque par exemple un item saillant est présenté d’un seul côté de l’hémichamp visuel.
La Ptc
La Ptc, pour positive temporal contralateral est une composante observable controlatéralement à un item dans le focus attentionnel. La Ptc est présente entre 290 et 340 ms post-stimulus. Certains auteurs affirment que la composante reflète une interférence locale résultant de la proximité spatiale entre cibles et distracteurs (Hilimire, Mounts, Parks, & Corballis, 2009). L’amplitude de la composante augmente généralement à mesure que la distance cible-distracteur diminue (Hilimire, et al., 2009). Cette plus grande amplitude reflète probablement une inhibition après le déploiement
6
attentionnel dans le but d’isoler une cible une fois celle-ci identifiée (Hilimire, Mounts, Parks, & Corballis, 2011). La composante ne varie pas selon la saillance entre la cible et les distracteurs (tel que manipulée par la saturation des couleurs des deux items) (Hilimire, Mounts, Parks, & Corballis, 2010).
Objectif particulier ou hypothèse
Cette étude vise à clarifier le rôle de la couleur dans le déploiement attentionnel par des mesures électrophysiologiques. Ceci permettra de mieux comprendre les résultats dans la littérature ainsi que de suggérer des mécanismes cognitifs impliqués. En combinant les résultats expérimentaux comportementaux et électrophysiologiques, deux hypothèses peuvent être émises. Premièrement, la N2pc, devrait refléter une hiérarchie chromatique dans le déploiement attentionnel à des cibles de différentes couleurs. Cette hiérarchie pourra être observée sur la N2pc par une amplitude plus négative et/ou des latences différentes en réaction à différentes couleurs (Lindsey, et al., 2010; Tchernikov & Fallah, 2010; Zhao, et al., 2011). La hiérarchie attendue est la suivante : rouge, vert, jaune, bleu. Très peu d’études évaluent le rôle ou même l’existence des composantes Ppc et Ptc. Les expériences précédentes avec la Ppc indique que celle-ci reflète la représentation d’un champ visuel débalancé (Corriveau, et al., 2012). Puisqu’un biais attentionnel devrait créer un tel débalancement, une Ppc plus positive pour les couleurs générant une réponse attentionnelle plus forte, comme le rouge, est attendue. La Ptc, représentant un processus d’inhibition des distracteurs physiquement proches dans la représentation visuelle devrait avoir aussi une plus grande amplitude pour les couleurs
7
avec plus de saillance comme le rouge. Ceci permettrait une meilleure inhibition des couleurs les plus saillantes.
Dans le but de maximiser une perception de couleur équiluminantes pour chaque participant, il est nécessaire de calibrer individuellement les couleurs pour chaque sujet. Les résultats obtenus devront aussi écarter la possibilité de variables médiatrices, comme la discriminabilité. Cette dernière sera évaluée à travers deux expériences contrôle.
Méthodologie Calibration Stimuli
Les stimuli pour la tâche de calibration consistent en 10 cercles pleins (ou disque) contenant chacun des teintes différentes de la même couleur, tel qu’illustrés dans la Figure 2a. Chaque cercle a un diamètre de 1.25 degré d’angle visuel. Les 10 cercles sont tous soit rouges, verts, jaunes ou bleus dépendant du bloc expérimental. Ces cercles sont disposés autour d’une croix, pour former un grand cercle de 3 degrés d’angle visuel. La couleur de chacun des cercles est ajustée par une adaptation d’une procédure nommée heterochromatic flicker photometry.
Procédure
La technique heterochromatic flicker photometry consiste en une alternance de deux sources de couleur différentes en une même position spatiale et permet de contrôler pour les différences individuelles de luminance entre différentes couleurs (Bone & Landrum, 2004; Walsh, 1953). Les sujets doivent minimiser leur perception de clignotement en modifiant les valeurs de luminance d’une des deux couleurs alternantes.
8
La fréquence de l’alternance doit être assez basse pour percevoir un clignotement, mais assez élevée pour percevoir une fusion des deux couleurs (la fréquence qui sera utilisée sera de 15 Hertz). La calibration se termine lorsque la perception de clignotement est minimisée.
La technique générale a été modifiée de deux façons majeures (figures 2ab). Premièrement, des cercles en alternance seront seulement présentés en périphérie du champ visuel. Cette mesure permet d’avoir des stimuli présentés à la même excentricité que dans l’expérience électrophysiologique (expérience 1) et les expériences contrôles (expérience 2a et 2b). Les participants doivent initialement garder leur attention au point de fixation, puis, advenant une impossibilité de décider lequel des cercles affichera le moins de clignotement, fixer directement les cercles. La seconde modification consiste en une présentation de plusieurs cercles simultanément et en faisant varier la valeur de luminance des cercles. La technique classique implique que tous les cercles aient la même teinte. Dans la technique modifiée, chaque cercle prend une teinte unique (figure 2a). Dépendant de la couleur du cercle, une différente valeur RVB sera présentée dans chaque cercle. Ainsi, en partant aléatoirement de l’un des dix cercles, une valeur précise est ajoutée de façon cumulative à la luminance de chaque cercle de façon horaire à quatre reprises. Du même cercle initial, mais de façon antihoraire, la même valeur sera soustraite à la valeur initiale à 5 reprises, créant ainsi dix cercles dont la luminance différe de façon graduelle de cercle en cercle. La valeur ajoutée ou soustraite dépend de la couleur et de l’étape d’ajustement. De façon générale, à mesure que la calibration progresse pour une couleur donnée, les saut de valeur ajoutée ou soustraite de luminance diminue, passant de 20 à 10 puis 5. Ainsi, pour la condition où les cercles seront tous rouges, une valeur de R
9
sera différente dans chaque cercle, mais les valeurs de V et de B sont les mêmes. Une procédure similaire sera appliquée pour la valeur V dans la condition verte, la valeur B dans la condition bleue et les valeurs V et B dans la condition jaune. Après chaque réponse, les écarts entre les valeurs RVB entre les cercles diminuent, jusqu’à ce que seulement des différences minimes subsistent. Les différences entre chaque stimulus de couleur et le gris seront ainsi réduites au maximum. Chaque couleur est calibrée trois fois à travers quatre choix multiples forcés dans lesquels le sujet doit à chaque fois choisir parmi les dix cercles lequel présente la perception de clignotement la plus réduite.
Tâche électrophysiologique –Expérience 1 Stimuli
La présentation visuelle de la tâche électrophysiologique est similaire à celle de la tâche de calibration. Dix cercles sont présentés avec la même excentricité (figure 1). La principale différence par rapport à la calibration est la présence de trois types de stimuli : les stimuli de fond, les cibles et les leurres. Le stimulus de fond est un cercle formé d’une ligne grise et contient une barre grise sur fond noir avec 4 orientations possibles : verticale, horizontale, oblique vers la gauche ou la droite. Les couleurs prises par les cibles et les leurres sont les valeurs finales obtenues par la calibration et sont donc équiluminantes entre elles et au gris des stimuli de fond.
Procédure
Suivant la calibration, et avant le début de l’expérience, une barre avec une orientation spécifique (horizontale ou verticale, également divisée entre les sujets) est
10
présentée à chaque participant. Cette barre permet la distinction entre deux types de stimuli, les cibles (cercles colorés contenant la barre d’orientation cible) et les leurres (cercles colorés avec une barre orientée non-cible). Des stimuli de fond occupent l’espace non pris par une cible ou un leurre. Chaque tableau de recherche contient soit une cible, soit un leurre, ainsi que 9 stimuli de fond.
Les participants commencent chaque essai en appuyant sur la barre d’espacement. Par la suite, une croix de fixation est présentée pendant 500 ms avant le début d’une série de présentations visuelles. Un tableau de recherche contenant les dix cercles décrits plus-haut est ensuite présentée pendant 200 ms, puis est suivi d’une croix de fixation pendant 600±100 ms. La tâche est une recherche visuelle. Les participants ont à trouver et compter le nombre de cibles (de 0 à 3) dans une succession de 6 tableaux de recherche. Après la présentation des six tableaux de recherche et croix de fixation, les participants indiquent par les lettres ‘v’, ‘b’, ‘n’ ou ‘m’ du clavier s’ils ont vu 0, 1, 2 ou 3 cibles. Cette procédure permet de multiples déploiements attentionnels avant une réponse se nomme MFP, de l’anglais Multiframe Procedure. Cette technique permet une diminution plus grande du bruit autour des composantes sans augmenter grandement le temps de l’acquisition des données. Une rétroaction par rapport au nombre de cibles indiquées est affichée pendant 500 ms. L’expérience contient 5 blocs de 80 essais pour un total de 400 essais de 6 déploiements attentionnels. Chaque participant effectue donc 2400 déploiements attentionnels.
11 Tâches contrôles –Expériences 2a et 2b
Certaines limitations nuisent aux conclusions de l’étude et demandent un contrôle supplémentaire. En effet, une possibilité de notre calibration est la création de couleurs qui ne sont pas toutes également discriminable du gris. Pour vérifier cette possibilité, deux expériences comportementales contrôles ont été crées. Ces tests évaluent la capacité à discriminer chaque couleur créée par la calibration par rapport au gris.
Stimuli
La présentation visuelle des expériences contrôle diffère des précédentes (Figure 10 ab (première tâche) 10 cd (seconde tâche)). Dans les deux expériences, seulement deux cercles au lieu de dix sont présentés. Les propriétés visuelles des stimuli (taille et distance du point de fixation) sont par contre les mêmes1. La principale différence entre la première et la seconde tâche est que les cercles sont vides dans la première et pleins dans la seconde. Pour les deux tâches, chaque cercle peut être une de 5 couleurs différentes, soit le gris ou l’une des 4 couleurs obtenues par la tâche de calibration.
Deux conditions de présentations visuelles différentes peuvent être affichées. Pour la condition pareille, les cercles seront de la même couleur, soit tous les deux gris, soit tous les deux d’une couleur obtenue par la calibration (figure 10a et 10c). Pour la condition différente, l’un des cercles sera gris et l’autre de l’une des quatre autres couleurs (figure 10b et 10d). Deux cercles de couleurs différentes ne sont pas présentés simultanément, puisque cela n’est pas similaire aux conditions de l’expérience en électrophysiologie. Bien que les deux conditions (pareille, différente) soient nécessaires
1 Considérant la distribution différente des cônes dépendant de l’excentricité, ce dernier
point est essentiel afin de calibrer et tester les couleurs sur une population similaire de cônes.
12
pour avoir une variabilité dans les réponses, la condition vitale pour cette expérience est la condition différente, qui évaluera la discriminabilité des couleurs par rapport au gris.
Procédure
Une croix de fixation est présentée pendant 500 ms à chaque essai. Après la croix, deux cercles sont présentés pendant 200 ms. Après cette présentation, les participants appuient sur “v” si les deux cercles présentés ont la même couleur, ou “b” si les deux cercles diffèrent. L’expérience a 455 essais, dont 70 compareront un cercle gris à un cercle de couleur pour un total de 280 comparaisons couleur-gris.
13
Color specific differences in attentional deployment
for equiluminant pop-out colors: Evidence from lateralized potentials.
Vincent Jetté Pomerleau1, Ulysse Fortier-Gauthier1, Isabelle Corriveau1, Roberto Dell’Acqua2, & Pierre Jolicœur1
1 Université de Montréal, Montréal, Québec, Canada 2 University of Padova, Padova, Italy
RUNNING HEAD: Color specific differences in attentional deployment
Corresponding author: Pierre Jolicœur Département de Psychologie Université de Montréal C.P. 6128, succursale Centre-ville Montréal QC H3C 3J7, Canada Fax: (+1) 514-343-2285 Phone: (+1) 514-343-6511
14
AB: We investigated how target color affected behavioral and electrophysiological results in a visual search task. Perceptual and attentional mechanisms were tracked using the N2pc component of the event-related potential and other lateralized components. Four colors (red, green, blue, or yellow) were calibrated for each participant for luminance through heterochromatic flicker photometry and equated to the luminance of grey
distractors. Each visual display contained 10 circles, 1 colored and 9 grey, each of which contained an oriented line segment. The task required deploying attention to the colored circle, which was either in the left or right visual hemifield. Three lateralized ERP components relative to the side of the lateral colored circle were examined: a posterior contralateral positivity (Ppc) prior to N2pc, the N2pc, reflecting the deployment of visual spatial attention, and a temporal and contralateral positivity (Ptc) following N2pc. Red or blue stimuli, as compared to green or yellow, had an earlier N2pc. Both the Ppc and Ptc had higher amplitudes to red stimuli, suggesting particular selectivity for red. The results suggest that attention may be deployed to red and blue more quickly than to other colors and suggests special caution when designing ERP experiments involving stimuli in different colors, even when all colors are equiluminant.
15
Color is an effective cue for attentional selection and as such is often used in experiments probing attentional mechanisms (Bacon & Egeth, 1994; Clark, 1969; Jolicoeur, Brisson, & Robitaille, 2008; Posner, 1980; Von Wright, 1972; Woodman & Luck, 2003). Attentional selection enables us to concentrate our limited attentional resources on a subset of the visual information reaching the visual cortex. Selection is required to avoid the loss of relevant information at later stages of processing because higher-level visual areas can only process and/or store a finite number of relevant objects (Cowan, 2000; Dell'Acqua, Dux, Wyble, & Jolicoeur, 2012). Visual spatial attention mechanisms are believed to process visual items serially (whether individually or in small groups) at some point in the visual processing stream in order to be identified in more detail and to control further processing (Sperling, 1960; Treisman & Gelade, 1980).
Over the years, a lot of effort has been put in determining the physiological basis of color perception. One of the first major theories was the Young-Helmotz, or trichromatic theory. It is based on a 3 receptors system, each with its own spectral sensitivity: the short, middle and long wavelengths cones, covering the totality of the visible colors (Baylor, et al., 1987; Buchsbaum & Gottschalk, 1983). A second theory that was put forward was the opponent processes theory (Buchsbaum & Gottschalk, 1983). According to this theory, receptors with opposing responses are activated by different wavelength. These neurons respond only for one of two color present in its receptive field. The colors in opposition are : red and green, blue and yellow and black and white. It is now well known that both mechanisms reflect different processes, one being peripheral, to the retina (trichromatic theory), and the other, more central, in the lateral geniculate nucleus (opponent processes theory)(De Valois, et al., 1966).
16 Colors and visual spatial attention
Usually, colors are used as a discriminative tool for segregating visual targets from distractors. This section provides a brief overview of the results of a few key studies in which chromaticity was shown to have an experimental effect in attentional tasks. Additional discussion can be found in a number of more detailed studies (for which we suggest key studies e.g. Carter, 1982; Treisman & Gelade, 1980; Wolfe, 1994).
Two recent papers evaluate the contributions of color to visual spatial attention (see also Ansorge & Becker, 2013; Lennert, Cipriani, Jolicoeur, Cheyne, & Martinez-Trujillo, 2011, for additional evidence). The first study addresses the contribution of color to motion processing in automatic target selection (Tchernikov & Fallah, 2010). The authors measured smooth pursuit eye movements that occur spontaneously immediately following a saccade to a circular region containing dots moving coherently either left or right. The dots were red, green, blue, or yellow (with luminance equated across colors). In two experiments, pursuit movements were initiated earlier for red dots. In experiment 1, this was evaluated with one color at a time. The participant’s task was to move their eyes in the general direction of the colored stimulus after the disappearance of a white fixation cross. In experiment 2, different colors were put in opposition and red tended to win over other colors (if two sets of dots moved in the region in different directions, the spontaneous pursuit movements were in the same direction as the moving red dots). Overall, a hierarchy of colors was found, from red (strongest), to green, to yellow, to blue (weakest).
A second paper also evaluated reaction times (RTs) to targets of different desaturated colors (Lindsey, et al., 2010). In this study, desaturated color targets (pink, green, blue, and orange) were placed in a visual display among white and saturated
17
distractors. Participants had to indicate the presence or absence of a target on every trial. To minimize the magnitude of difference in color appearance, the authors chose desaturated targets (30cd/m2) that laid at the midpoint of a line segment between saturated distractor (12 cd/m2), and white distractor (60cd/m2) in CIE L*ab color space. Those colors were furthermore tested through two auxiliary experiments, the first involving direct heterochromatic matching, and the second based on Maximum Likelihood Difference Scaling. The authors found faster RTs for desaturated red than desaturated orange and green, and slower RTs for desaturated blue (red <orange<green<blue).
What can be retained from these studies is that there seems to be an attentional bias for some colors over others, favoring their selection by attention and hastening our response when they are target. So far, mostly RTs have been reported, but RTs effects are often coupled to observable electrophysiological effects (Brisson, Robitaille, & Jolicoeur, 2007; Mazza, et al., 2009a). Here we used event-related potentials (ERPs) as a way to monitor, millisecond-to-millisecond, the deployment of attention to colored targets. Our goal was to determine if, like visual search or spontaneous capture of smooth pursuit eye movements, the mechanisms that guide and engage attention reflected by the N2pc component of the ERP would show systematic variations as a function of stimulus color. We chose colors (red, green, blue, yellow) that are frequently used in visual search task (with and without electrophysiology) involving color. Our main interest was in the lateralized electrophysiological components known for their link to visual attention, namely the N2pc. However, we were also interested in two other lateralized components,
18
one just before the N2pc, the Ppc (positivity posterior contralateral), and the other just after the N2pc, the Ptc (positivity temporal contralateral).
The N2pc
The N2pc is a lateralized ERP component that can be calculated by subtracting the electrical potentials measured at electrodes sites ipsilateral to a lateral attended object from the electrical potentials measured at electrode sites contralateral to that object. The N2pc is observed over the posterior scalp, with peak amplitude typically observed at or near electrodes PO7/PO8. As the name suggests, the latency of the N2pc is in the N2 time range, which is 180–280 ms following the onset of an attended stimulus (Brisson & Jolicoeur, 2007; Luck & Hillyard, 1994; Robitaille & Jolicoeur, 2006). Luck and Hillyard (1994) argued that the N2pc reflects spatial filtering of distractors, whereas Eimer (1996) and, more recently, Mazza and her colleagues (2009a, 2009b) argued that the N2pc reflects target enhancement.
It is no surprise that, much like in behavioral attentional studies; color is often used in ERP experiments involving the N2pc (Eimer, 1996; Hickey, et al., 2009). Studies usually report conditions in which the target and distractor are equiluminant to equate bottom-up effective intensity. Then, after making sure that an equal number of participants/trials are performed with each color, different color trials are averaged together. Typically, the direct effect of colors on the N2pc is not discussed, with possible differences assumed to have been equated across conditions. This approach is technically sound when there are no color-specific interactions, but has downplayed what appear to be quite substantial effects that are interesting in their own right. When experimenters do study the effect of colors on the N2pc, it is often with search questions unrelated to
19
chromaticity (e.g., effect of language on detection/disparity between target and distractor). This results in a near absence of reports of N2pc latency or amplitude effects between colors (Liu, et al., 2009; Regier & Kay, 2009).
One pertinent paper regarding our research question evaluated the role of physical disparity between target and distractor items (Zhao, et al., 2011). In their study, the authors modulated the physical difference (through color in one condition) between target and distractors while observing the effect on the N2pc. They compared conditions in which the disparity from the distractor was high (distractor light blue, target dark blue) and a condition in which it was low (distractor medium blue, target dark blue), by manipulating the RGB values of the colors while maintaining them equiluminant. Participants were asked to find the stimulus (a cross) that differed in color and to decide whether the top or the lower segment of the vertical bar of the target was longer. A main effect of color disparity was found, with the mean amplitude of the N2pc in the high color disparity condition being larger (more negative) than the low-disparity condition. A marginal effect of latency was also found, with the N2pc related to low disparity being later than the high-disparity N2pc. Both ERP results dovetailed with the behavioral data in which the high disparity condition had faster RTs than the low disparity condition.
The Ppc
Rarely discussed, the posterior contralateral positivity (Ppc) is a lateralized component earlier than the N2pc, roughly from 150 to 200 ms post stimulus. In a study by Corriveau et al. (2012), neither the mean amplitude of the Ppc nor its latency depend on the lateral item status as target or distractor. This early-lateralized response appeared
20
to reflect an attention driven spatial “attend-to-me” signal that arises in the waveforms of an unbalanced visual display containing a salient stimulus only on one side.
The Ptc
The Ptc is a positive component that can be observed over the contralateral hemisphere of the attended item. The Ptc was observed between 290 and 340 ms post stimulus in previous experiments. The label “temporal” follows the suggestion of Hilimire, Mounts, Parks, and Corballis (2009). However, while our component has the same approximate latency, and also follows the N2pc, it does not seem as anterior as the one reported by Hilimire et al., and thus it could reflect a different underlying process. Hilimire et al. (2009) suggested the Ptc might reflect local attentional competition resulting from the spatial proximity between a target and a salient distractor. The amplitude of the component generally becomes larger (more positive) as the physical separation between the target and a salient distractor decreases (Hilimire, et al., 2009). This modulation of Ptc amplitude could reflect distractor inhibition after initial attentional deployment (the N2pc), in order to isolate a target once it has been identified (Hilimire, et al., 2011). Their component did not vary with target-distractor saliency difference (manipulated through color saturation of the target or the salient distractor), in apparent contrast with ours (Hilimire, et al., 2010).
From previous ERP and behavioral experiments, we expected to see a difference in the N2pc amplitude and latency for colors that allow a better attentional deployment, possibly resulting in a color hierarchy (Tchernikov & Fallah, 2010; Zhao, et al., 2011). More precisely, we anticipated a shorter N2pc latency to red targets, based on the Tchernikov and Fallah (2010) results. However, Lindsey et al. (2010) only found an
21
advantage for desaturated reds, and so the typical red stimuli used in most attention selection experiments may not be subject to the special effect for desaturated red. Predictions for other colors are even more difficult to make, given paucity of results and inconsistent results across studies.
Very few experiments explored the role or even the existence of the Ppc and Ptc. Previous experiments dealing with the Ppc component indicate that it reflects the representation of an unbalanced visual display (Corriveau, et al., 2012). Since color attentional bias should create an unbalanced display, we would expect a more positive Ppc for colors with a stronger attentional response, namely the red target compared to other targets. The Ptc reportedly representing inhibitory processing of close distractors could amplify in amplitude for colors with increased salience like red, since more inhibition should be required for more salient targets.
In most of our recent work we equated the luminance of colors using a specialized instrument (Minolta CS100 chromameter). We wondered, however, if individual differences luminance responses could produce small but systematic luminance differences that would bias attention to one or another of the colors. In order to minimize possible individual differences, we used a psychophysical luminance calibration procedure to equate luminance of the colors for each individual.
Furthermore, in order to determine if some colors were more or less discriminable from the background grey distractor stimuli used in all displays, we conducted two control experiments. These control experiments consisted in visual discrimination tasks that should not yield significant differences between colors if all colors are equally discriminable from the distractors. Given the color singletons to which attention was to
22
be deployed were presented only with other grey stimuli, and the color differences across color stimuli and grey were large, one would expect to find a pop-out pattern of rapid and effortless search.
Experiment 1
The purpose of Experiment 1 was to determine if different colors would elicit different lateralized ERPs, and most particularly different N2pc waves, under conditions in which each color was presented on a neutral background of grey distractors. These are conditions that should minimize differences across colors, because colors were never in direct competition for selection with each other. They just had to be found among the neutral grey distractors. This is illustrated in Figure 1.
Insert Figure 1 about here
Method
Sixteen paid volunteers participated in Experiment 1. Three participants were rejected, two because of HEOG activity exceeding 25 µV on a 200 ms interval on more than 50% of trials, suggesting an eye movement towards the lateral target (see below) and one for an accuracy that was at or near chance (25%) in more than one condition. The remaining ERP participants (9 males and 4 females) had a mean age of 23.2 years (S.E. = 2.8, range 19–29). All 13 participants were neurologically normal undergraduates at the Université de Montréal and had normal color vision, and either normal or corrected-to-normal visual acuity.
23 Luminance calibration methodology
Stimuli
Stimuli for the calibration experiment consisted in two types of frames, each displaying simultaneously 10 numbered disks, as illustrated in Figure 2. The disks could be red, green, blue or yellow, depending of the trial block. Each disk of Figure 2a showed different shades of the same color, while all disks of Figure 2b were displayed with the same reference grey. Each disk had a diameter of 1.25° of visual angle and was placed 3° from a central fixation point, thus forming a circle of disks. Participants individually set luminance values through a variant of the heterochromatic flicker photometry technique, described next.
Insert Figure 2 about here
Procedure
In order to control for subtle individual differences in color perception, we used a variant of the heterochromatic flicker photometry technique (Bone & Landrum, 2004; Walsh, 1953). The heterochromatic flicker photometry technique uses the alternation of two colored stimuli at the same spatial position (we alternately presented the numbered disk presented on Figure 2a and 2b). Participants had to minimize their perception of flicker through luminance adjustment of one of the two colors while colors alternated. The rate (or frequency) of the alternation needs to be high enough in order to obtain a flicker but not so high that color fuse (we used a frequency of 15 Hz). Equal luminance between colors is obtained when the perception of flicker is minimized.
We modified the usual heterochromatic flicker photometry technique in two ways (see Figure 2). First, we only presented disks containing flickering colors to the periphery
24
of the visual field. That allowed the presentation of stimuli at the same eccentricity as in the ERP and control experiments. Participants were instructed to pay attention to the disks while looking at a central fixation point. Only after doing this could participants directly look at the disks to make a final decision. The second modification from the original technique was in the luminance value of each circle. In our modified technique, each disk presented in periphery had a slightly different luminance (see Figure 2a), while only a single color is presented in the usual technique. Depending on the color of the circle (red, green, blue, or yellow), a different RGB value was displayed within each disk. From a random disk position, a precise value was added in a clockwise manner four times, and from the same random disk, the same value was subtracted five times in an anticlockwise manner. If disks were all red, then a different value of red was present in every disk while the green and blue component values stayed the same. The same applied for the green and the blue colors, while for the yellow, both red and green component values were modified with a common value and the blue component stayed constant.
The task of the participant was to choose which of the 10 numbered disks showed the least flicker. Participant’s answer was recorded through the numeric keypad of a standard keyboard, key 1 corresponding to disk 1 and key 0 to disk 10. After each response, the RGB differences between circles were adjusted to represent a smaller range of RGB colors starting with stimulus chosen on the previous response, until only small (single-step: first 20, then 10, then 5) difference remained between each disks. By doing so, we selected the RGB values providing the least individual luminance difference perception for each color. Each one of the four colors was calibrated 3 times through 4
25
forced choice flickering frames. The mean of each RGB component for the 3 calibrations was used as the calibrated color.
Experiment 1 task Stimuli
The visual display of a frame was very similar to the frames used in the calibration procedure, as illustrated in Figure 1. Ten circles were displayed, at the same distance from a fixation point as the calibration procedure. The only difference from the calibration frames was the existence of three types of stimuli: distractors, targets, and decoys. Distractors consisted of circles formed with a thin grey line, and containing a grey oriented line on a black background. Oriented lines could either be horizontal, vertical, or at ± 45° from vertical. Targets and decoys were also circles containing an oriented line, but instead of being grey, they were displayed in color. All colors including the grey were obtained from the calibration procedure and were therefore equiluminant.
Procedure
In the search task that followed the calibration procedure, targets were defined as any colored circle containing either a vertical line (half of the participants) or a horizontal line (the other half). Every visual search display contained a colored circle (a color singleton among grey distractors) containing a line that was either in the target or non-target orientation (one of the other three orientations). Each of the grey distractor circles also contained a line in one of the four possible orientations, chosen at random independently for each display.
26
Participants initiated every trial by pressing the spacebar. A fixation cross was displayed for 500 ms before the beginning of the trial. Six search displays, henceforth called frames, were then presented, one after the other. Each frame was visible for 200 ms followed by a fixation cross for 600±100 ms. Participants had to count the number of targets (from 0 to 3) in the sequence of six frames and report the count by button press at the end of the sequence. The letters ‘v’, ‘b’, ‘n’ or ‘m’ were used to respond 0, 1, 2, or 3 targets, using the middle and index fingers of the left hand (0, 1) or the right hand (2, 3). Participants had 4 seconds to enter their overt response after each set of 6 frames in a method we call the multiframe procedure (MFP). Feedback was displayed for 500 ms. The experiment consisted of 5 blocks of 80 trials for a total of 400 trials. Each trial consisted in six visual search frames, yielding 2400 attentional episodes.
Electrophysiological recording
A BioSemi ActiveTwo system (BioSemi Inc., Amsterdam, The Netherlands) was used for the recording of the EEG signal with 64 active Ag/AgCl electrodes mounted on an elastic cap and rereferenced to the algebraic mean of right and left mastoid signals. Electrodes were placed on the participant’s scalp according to the international 10/10 system (Chatrian, 1985; Chatrian, Lettich, & Nelson, 1988). Two electrooculograms were calculated to identify lateral eye movements and blinks through the comparison of pairs of electrodes. The horizontal electrooculogram (HEOG), calculated as the difference between the left and right external canthi electrodes, was used to detect horizontal eye movements. The vertical electrooculogram (VEOG) was calculated as the difference
27
between electrode Fp1 and another electrode placed below the left eye and used to detect blinks.
The EEG was recorded at a sampling rate of 512 Hz, with an antialiasing lowpass filter of 134 Hz was applied during the recordings. An offline bandpass filter 0.05–30 Hz was also applied on the EEG signal. For one participant, that filter was replaced by an offline bandpass filter of 0.05–20 Hz to reduce the signal contamination by alpha activity2.
Trials with an HEOG difference larger than 25 µV on a 200 ms interval suggested lateral eye movements and were rejected. Trials with a variation of VEOG larger than 50 µV over a 200 ms interval were flagged as blinks and were removed. All trials with artifactual data, identified as a variation of more than 100 µV for any electrode, were also removed.
We averaged HEOG for left-target and right-target trials from 200 to 700 ms post stimuli presentation and used only the data of participants with residual EOG activity less than less than 3.5 mV, 3 mV being slightly too restrictive for two participant in two different conditions. Mean HEOG exceeding 3mV reached that amplitude after 350 ms, and therefore could not affect our N2pc measures, which peaked between 250 and 300 ms (see Figure 3a and 3b). Concerning VEOG, participants with an average difference exceeding 6 µV were also excluded. Overall, no participants were excluded for vertical eye movement and 2 were excluded for horizontal eye movement.
Insert Figure 3a and 3b about here
2 The different filter between one participant and the rest did not introduce any side
effect. The more susceptible result to change (the jackknife) showed similar results F’ (3, 36) = 10.31, p < .0001). The Tukey test also showed the same color hierarchy (see page 27). Behavioral performance for this participant was comparable to that of other
28 Experiment 1 results
Calibration task results
The heterochromatic flicker photometry technique allows the selection of stimuli colors that are all equal in luminance (Walsh, 1953). Despite Walsh’s previous results regarding luminance, we measured the luminance for the stimuli of experiment 1, using a Minolta meter, and then tested for significant differences across the 4 luminance means, using a one-way ANOVA. No significant differences were observed (F (3, 36) = 1,31, p > .28). This confirmed the expected absence of luminance differences between colors for this particular experiment.
Main experiment Behavioral results
In our multiple frame procedure (MFP), participants were required to report a target count after each set of six frames. Participants had an average success rate of 90.67 ± 0.07%, with a range of 75% to 99%. No differences were found depending on target orientation (horizontal, n=6, or vertical, n=7, t(11) = 0.21, p > .80).
ERP results
All subsequent analyses were made on electrodes PO7 and PO8. Time windows are presented in Table 2 and 3.
29
In order to confirm the stability of attentional deployment across different frame positions in the sequence of frames, we assessed the presence of the N2pc on each MFP frame (1 to 6). The event-related lateralizations (ERLs) for each frame position are shown in Figure 4, amplitudes in Table 1. A repeated measure ANOVA with Frame Position as main factor revealed no significant differences between amplitudes, F(5, 60) = 1,14, p >.35. In fact, t-tests revealed a negativity between 245 and 285 ms significantly different from 0 in all six frames (Frame 1: t(12) = -3.15, p < .01; Frame 2: t(12) = -3.76, p < .005; Frame 3: t(12) = -4.10, p < .005; Frame 4: t(12) = -3.94, p < .005; Frame 5: t(12) = -4.35, p < .005; Frame 6: t(12) = -2.76, p < .05).
Insert Figure 4 about here
Targets and decoys
We assumed that attention would be first deployed to the colored singleton circle, and that subsequently, the orientation of the line in that circle would be evaluated to determine if the display contained a target or a decoy. To know whether or not the electrophysiological activity arising from target and decoys are comparable (and therefore can be averaged for further analyses), components were compared on their amplitude. In order to evaluate this, two time windows were chosen independently for both targets and decoys in order to best fit the individual conditions components (see Figure 5). Paired-sample t-tests comparing the target and decoy mean amplitude across their respective Ppc, N2pc, and Ptc (the time range of each component is indicated in Table 2) found no significant differences; Ppc: t(12) = 1.22, p > .24; N2pc: t(12) = -1.62, p > .13; Ptc: t(12) = -1.18, p > .25. The same results were also obtained when a common
30
window was chosen for both the target and decoy conditions of the N2pc and Ppc (Ppc: t(12) = 1.31, p > .21; N2pc: t(12) = -2.04, p >.06) confirming that for the purpose of this experiment both conditions were equivalent3. For subsequent analyses, these two different types of trials were merged together and are called targets from the point of view of attentional deployment.
Insert Figure 5 about here
Electrophysiology – N2pc
Figure 3a presents grand-averaged event-related lateralizations (ERLs) obtained by subtracting the ispilateral ERP waveform from the contralateral ERP waveform for each singleton color. These averages were time-locked to the onset of the visual search display presentation and included a 200-ms pre-stimulus baseline and extended 700 ms after onset.
Analyses of mean amplitudes were performed on the average voltage in a window starting 20 ms before and extending to 20 ms after the grand average waveform peak for each conditions of the N2pc. The time window boundaries can be found in Table 3 and the mean amplitudes, in Table 4. A repeated measure ANOVA for the Color factor (red, green, blue, or yellow) showed no amplitude main effect, F(3, 36) = 1.23, p > .31. All N2pc components had an amplitude significantly different from zero (one-sample t-tests
3 We intended here to openly expose the verification that both waveforms were
actually identical. We chose both a common window and a maximum difference window (to maximize a difference between conditions), in order to demonstrate that even without presuming a common window for the ERP components we still failed to get a significant difference between target and decoys. Since both items reflected the same activity, trials where attentional deployment was to a target or to a decoy were averaged together in subsequent analysis.
31
versus 0, red: t (12) = -4.10, p < .005; green: t (12) = -4.48, p < .005; blue: t (12) = -3.88, p < .005; yellow: t (12) = -3.69, p < .005)4.
We examined the latency of the onset of lateralized activity across color conditions. These analyses used repeated-measures ANOVAs combined with the jackknife method (Kiesel, Miller, Jolicoeur, & Brisson, 2008; Miller, Patterson, & Ulrich, 1998). The use of the repeated measure ANOVA with the jackknife required some corrections to the F value. These corrections compensated for the artificial deflation of the error variance associated with sets of jackknife waveforms (F’ = F / (n-1) 2) (Ulrich & Miller, 2001). Latency was estimated as the time at which the waveform first reached amplitude of -0.75 microvolt. The N2pc showed significant latencies differences depending on the color of the singleton, as shown in Figure 3a, F’ (3, 36) = 11.57, p < .00015. Tukey’s post-hoc test revealed that conditions in which a potential target was red or blue had an earlier N2pc compared to conditions in which the potential target was green or yellow; while the red and blue N2pc did not differ in latency (R<GY; B<GY;R~B;G~Y). The estimated mean latency for each singleton color can be found in Table 5. Tukey’s post-hoc test also required some correction (H’ = H∗(n-1)) for jackknife measurements (Ulrich & Miller, 2001).
Condition specific voltage maps shown in Figure 6 were produced to examine the scalp distribution of lateralized activity for the N2pc in each color conditions. The
4 That result was explored further because of the apparent amplitude differences
visible by eye in Figure 3a. A subsequent paired t-test evaluated the presence of a difference between the red-blue average and green-yellow average, but still revealed no significant difference, t (12) = -1.65, p >.12.
32
distributions were quite similar, overall, all showing a typical N2pc-like peak near PO7-PO8, as expected from previous research (e.g., Jolicoeur, et al., 2008)
Insert Figure 6 about here
Electrophysiology – Ppc
We also performed analyses on the mean amplitude of the Ppc depending on the color of the singleton for windows shown in Table 3. The waveforms are in Figure 3a and mean amplitudes are in Table 4. These results were submitted to a repeated measure ANOVA with singleton color as a within-subjects factor. The mean amplitudes were different, F(3, 36) = 6.08, p < .005), and Tukey’s post hoc tests showed significant differences with the Ppc for red more positive than for blue or green, and the red-yellow difference missing significance.
The red and yellow Ppc waves were confirmed to be present by t-tests against zero, while the two others were not (red: t(12) = 3.94, p < .005; green: t(12) = 1.13, p >.55; blue: t(12) = 1.42, p > .15; yellow: t(12) = 2.52, p <.05). In Figure 7 we show the voltage distribution map of the Ppc for red and yellow singletons. The distribution is posterior and resembles a polarity-inverted N2pc, although somewhat more inferior and lateral than N2pc. Although the red and yellow Ppcs did not significantly differ at PO7-PO8, our activation maps suggest a more positive red Ppc due to the similar larger amplitude trend found on the surrounding electrodes. That hypothesis was confirmed through a paired sample t-test comparing the red and yellow Ppcs from a pooling of electrodes PO3-PO7 and electrodes PO4-PO8 (t(12) = 3.87, p <.005).
For the subsequent analyses, we measured the Ppc latency at a threshold set at 50% of the average waveform maximum amplitude between 120 and 200 ms. We found
33
the color factor to be significant (F’ (3, 36) = 5.89, p < .005). Tukey’s post-hoc tests revealed that the blue Ppc reached its 50% threshold significantly before the green and yellow Ppcs, but not before the red Ppc (B~R; B<GY; R~G~Y; Mean R: 130.1 ms; G: 149.2 ms; B: 112.4 ms; Y: 158.6 ms). In order to verify the presence of a pattern similar to the N2pc, we grouped together the red and blue (RB) as well as the green and yellow (GY) Ppc waves. Comparing these two averaged components, we observed that RB reached its 50% threshold significantly earlier than the GY component (F’ (1, 12) = 15,56, p < .005); (Mean RB: 121.2 ms; GY: 153.8 ms).
Insert Figure 7 about here
Electrophysiology – Ptc
The Ptc component can be seen in the waveforms in Figure 3a as a greater positivity contralateral to the color singleton, mainly for red singletons. The mean amplitude of the Ptc for each participant and condition in a window of 20 ms around peak amplitude for the component (see Table 3 for time ranges) were submitted to a repeated measure ANOVA with Color as a within-subjects factor that revealed a significant main effect, F(3, 36) = 8.64, p < .001. Tukey’s post hoc tests showed significant differences between the red and all other colors, the red being more positive (see Table 4 for mean voltages). Although windows of analysis were set to assess the highest visible peak of each color Ptc component, only the red Ptc differed from zero (one-sample t-tests versus 0, red: (t(12) = 3.94, p < .005; green: t(12) = -0.42, p > .65; blue: t(12) = 0.57, p > .55; yellow: t(12) = -0.13, p > .85). A voltage distribution map of the red Ptc can be seen in
34
Figure 8. The voltage distribution map of the Ptc is similar to the Ppc in position and polarity.
Insert Figure 8 about here Discussion- Experiment 1
Through ERPs we evaluated how different colors influenced lateralized event-related potentials (ERLs) that reflect preattentional and attentional processes, particularly attentional deployment. We designed a visual search task in which a single colored item, a singleton target or decoy was shown in red, green, blue, or yellow among grey items (distractors). Singletons and grey distractors all had the same luminance (which was equated psychophysically for each participant). The experimental design left only attention and color-specific differences as probable causes of the observed effects.
There were two main findings in experiment 1. Firstly, we observed that red or blue singletons triggered an earlier N2pc compared to green or yellow singletons (red ~ blue < green ~ yellow). Secondly, significantly higher amplitudes for the red Ppc and Ptc suggest a stronger attentional signal by the red target singleton.
Our first results regarding the N2pc latency confirms and extends earlier findings (Fortier-Gauthier, Dell'acqua, & Jolicoeur, 2013), in showing that the N2pc has an earlier onset latency for red than for green singletons, which we here extended here to show a significantly earlier response to blue than to yellow. The color attentional hierarchy we obtained differs from previous behavioral results (Lindsey, et al., 2010; Tchernikov & Fallah, 2010). Even considering the small differences in methodology, the shorter N2pc latency for a blue target singleton differs from previous results. Interestingly, the grouped Ppc waves show the same color hierarchy showed with the N2pc. These results were not
35
as robust as for the N2pc results probably because of the smaller amplitude of the Ppc component. However, from these results, we can postulate a mechanism differentially sensitive to variations in stimulus color that responds prior to the onset of the N2pc.
A few hypotheses could explain our color hierarchy. First, it could be that some colors may be easier to discriminate from grey. That possibility is evaluated later in Experiment 2a and 2b. Second, regarding solely the results to blue targets, we could hypothesize that a non equiluminant blue target could explain its shorter latency. Previous results showed that the bleaching of S-cones (or “blue” cones) does not affect in a large way results of tasks such as the heterochromatic flicker photometry results (Cavanagh, MacLeod, & Anstis, 1987). Knowing this, one could propose that our calibration task, a modified version of the heterochromatic flicker photometry, did not yield equiluminant colors. That proposal can be discounted for two reasons. Firstly, resulting luminance values, after adjustment, were measured with an instrument and the measured values were submitted to statistical analysis. The observed luminances were not statistically different across colors. Secondly, the results of Cavanagh and his collaborators (1987) showed that the contribution of blue cone activity to the luminance channel is considerably weaker than for the two other cone populations. This reduces the likelihood that luminance differences across blue singletons and green or yellow singletons was the main cause of the attentional differences across colors, particularly given that the luminances differences were small, at best (given the results of the flicker photometry and physical photometry).
Another hypothesis for our color hierarchy could be derived based on earlier result on linear separability between colors in color space (Bauer, Jolicoeur, & Cowan,