Publisher’s version / Version de l'éditeur:
Desalination, 101, 2, pp. 155-167, 1995
READ THESE TERMS AND CONDITIONS CAREFULLY BEFORE USING THIS WEBSITE.
https://nrc-publications.canada.ca/eng/copyright
Vous avez des questions? Nous pouvons vous aider. Pour communiquer directement avec un auteur, consultez la
première page de la revue dans laquelle son article a été publié afin de trouver ses coordonnées. Si vous n’arrivez
pas à les repérer, communiquez avec nous à [email protected].
Questions? Contact the NRC Publications Archive team at
[email protected]. If you wish to email the authors directly, please see the
first page of the publication for their contact information.
NRC Publications Archive
Archives des publications du CNRC
This publication could be one of several versions: author’s original, accepted manuscript or the publisher’s version. /
La version de cette publication peut être l’une des suivantes : la version prépublication de l’auteur, la version
acceptée du manuscrit ou la version de l’éditeur.
For the publisher’s version, please access the DOI link below./ Pour consulter la version de l’éditeur, utilisez le lien
DOI ci-dessous.
https://doi.org/10.1016/0011-9164(95)00018-W
Access and use of this website and the material on it are subject to the Terms and Conditions set forth at
Effect of adsorptive fouling on membrane performance: case study
with a pulp mill effluent
Dal-Cin, M. M.; Striez, C. N.; Tweddle, T. A.; Capes, C. E.; McLellan, F.;
Buisson, H.
https://publications-cnrc.canada.ca/fra/droits
L’accès à ce site Web et l’utilisation de son contenu sont assujettis aux conditions présentées dans le site
LISEZ CES CONDITIONS ATTENTIVEMENT AVANT D’UTILISER CE SITE WEB.
NRC Publications Record / Notice d'Archives des publications de CNRC:
https://nrc-publications.canada.ca/eng/view/object/?id=85a8a600-ccec-48e5-83f3-ce5e49bc1352
https://publications-cnrc.canada.ca/fra/voir/objet/?id=85a8a600-ccec-48e5-83f3-ce5e49bc1352
E L S E V I E R Desalination 101 (1995) 155-167
DESALINATION
Effect of adsorptive fouling on membrane performance:
Case
with a pulp mill effluent*
• ~ " a * *
M . M . u a l - ~ m , C . N . S t r i e z a, T . A . T w e d d l e a, C . E . C a p e s a, F . M c L e l l a n b, H . B u i s s o n c
aNational Research Council of Canada, Institute for Environmental Research and Technology, Ottawa, Canada bAbitibi-Price, Sheridan Park Technology Center, Mississauga, Ontario, Canada
CWastewater Technology Center, Burlington, Ontario, Canada
Received 5 June 1994; accepted 8 September 1994
Abstract
The compatibility of a wide range of membrane materials with a pulp mill effluent was evaluated with respect to adsorptive fouling. Membranes were initially evaluated by their pure water permeability and separation characteristics with a polyethylene glycol test solute. These membrane coupons were contacted with a pulp mill effluent sample at 50°C in the absence of a transmembrane pressure for 3 h and then recharacter- ized. The change in the separation and permeation was interpreted as changes in the average pore size and the ratio of the number of pores to the effective pore length (n/AxA) of the membrane. A decreasing pore size indicated the formation of an adsorbed fouling layer. An increased n/AxA ratio suggested that adsorption occurred on the membrane surface rather than in the pores.
Keywords: Fouling; Adsorption; Ultrafiltration; Pulp mill waste
1 . I n t r o d u c t i o n
This work was part o f a comprehensive study on the fouling o f membranes during
*Issued as NRCC No. 37572. **Corresponding author.
ultrafiltration (UF) o f a pulp mill effluent. Membrane fouling is currently a major limiting factor to the full-scale application o f membrane technology in many areas. In the resource sec- tor membrane technology has a potential role in alleviating pollution problems. In particular, the pulp and paper industry has been under increasing legislation regarding emissions. The
001 !-9164/95/$09.50 © 1995 Elsevier Science B.V. All rights reserved
156 M.M. Dal-Cin et al. / Desalination 101 (1995) 155-167
viability o f membrane technology in this sector is directly lil~ked to the cost o f implementation in comparison to other competing technologies such as biological treatment. This is particular- ly important when considering pollution con- trol, as there is little or no recovered costs as in the biotechnology, pharmaceutical or food industries. These have high value products that can offset the cost o f membrane systems. There is a need to advance the understanding and control o f membrane fouling during UF in order to improve the competitiveness of mem- brane processes. This can help to minimize the cost o f implementation and increase the accep- tance o f membrane technology on an industrial scale.
In this paper, one particular aspect o f mem- brane flux decline is systematically studied. A wide variety o f membrane materials and pore sizes was characterized by their permeability and separation characteristics. Membranes were exposed to a plug screw feeder pressate (PSFP) from a semi-chemical mechanical pulp (SCMP) mill and then recharacterized to quan- tify changes in the membrane's morphology. A steric transport model was used to estimate the membrane's pore size. This pore size was used to evaluate the ratio o f the number of pores to the effective pore length per unit area (n/AxA)
o f the membrane. Changes in these two param- eters were used to interpret the mechanism of adsorptive fouling.
2. Flux models
Flux losses during UF occur through vari- ous mechanisms including: adsorption, steric hindrance, pore plugging and concentration polarization or gel layer formation [1,2]. These contributions have been modelled phenomeno- logically using series resistance (SR) models [3] or combined osmotic pressure-adsorption (OPA) models [1]. Flux models may have the general form
P R = ( A p - olr) (1)
/~ (R m + R a + Rpp + Rh)
where P R is the product rate, AP the trans- membrane pressure drop, ~r the osmotic pres- sure o f the feed solution at the membrane- solution interface, tr the reflection coefficient and tt the permeate viscosity. R m, Ra, Rpp and R h are the resistances to permeate flow due to the membrane, adsorptive fouling, pore plug- ging and concentration polarization or gel layer formation, L'espectively.
Tile purely resistance models do not make use of the osmotic pressure term, accounting for this effect with R h. Alternatively, osmotic pressure models will use the aTr term to ac- count for the reduced driving force and may represent the effects o f other fouling mecha- nisms with the individual components or an overall fouling term, Rf. Regardless o f the model used, the adsorptive fouling component has been recognized as a significant factor in flux decline [4-6].
The effect of adsorptive fouling can be estimated by comparing pure water permeabili- ties ( P W P s ) before and after contacting experi- ments. Increased adsorptive fouling during permeation is a distinct possibility. This would result from more o f the membrane's internal pore structure being exposed to foulants and higher concentrations at the membrane surface due to polarization. However, permeation experiments would confound the flux loss due to adsorptive fouling and pore plugging. Sepa- rate contacting and permeation experiments would therefore allow estimating both R a and Rpp as separate resistances and is the subject o f further work continuing fouling studies with PSFP.
The pore restriction model has also been used to model adsorptive fouling [7-9]. This model predicts a narrowing of pore sizes due to adsorption of solutes on the membrane surface and pore walls. The flux decline has a fourth-
M.M. Dal-Cin et al. / Desalination 101 (1995) 155-167
order dependence on the pore radius as de- scribed by Hagen-Pouiseille flow. An estimate o f an adsorbed layer o f uniform thickness (la)
can be obtained from the initial pore size (ri)
and the relative flux, R F , o f the new and fouled membrane:
[
,
la=ri
1-1~--~.j j=ri(l
Eq. (1) can be rearranged to obtain
1 - R F °.25 = __la (3)
ri
which predicts a straight line with a slope o f ! a
when ( 1 - R F °'25) is plotted as a function o f
l / r i.
Dejmek and Nilsson [9] evaluated adsorp- tion of several proteins on polysulfone mem- branes to distinguish whether adsorptive foul- ing was occurring on the surface or on pore walls. They used the hypothesis that surface adsorption would result in an adsorptive resis- tance which was independent o f the initial flux, while pore restriction would depend on P W P i
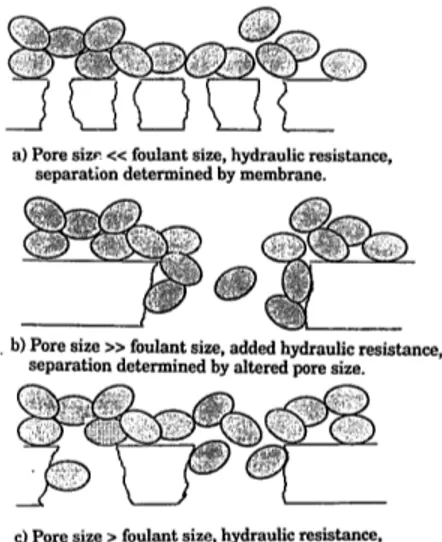
as predicted by Eq. (2). They concluded that pore restriction best described their results. However, the pore restriction model is not appropriate for use in all cases o f adsorptive fouling, and its shortcomings have been de- scribed by Persson et al. [10]. The validity o f the pore restriction model depends on the relative sizes between the solute(s) and pores. Meireles et al. [4] and Belfort et al. [11] clear- ly demonstrated the different eases which may be encountered (Fig. 1) during UF o f protein solutions. This analysis can also be applied to the case o f purely adsorptive fouling. Brink et al. [12] have described the adsorption o f sur- factants on membranes in a similar manner.
When the pore size is considerably smaller than the foulant (Fig. la), the pore size of the
157
Q
a) Pore siz~ << foulant size, hydraulic resistance, separat'ion determined by membrane.
• b) Pore size >> foulant size, added hydraulic resistance, separation determined by altered pore size.
e) Pore size > foulant size, hydraulic resistance, separation determined by fouling layer.
Fig. 1. Schematic representation of adsorption mecha- nisms on/in the membrane pore structure showing the effect of the relative sizes of the foulant and pore.
membrane remains unchanged. Since the foul- ants are much larger than the pores, the spaces between the foulants will be larger than the pores. The formation o f the adsorbed layer adds a hydraulic resistance resulting in flux losses. At the opposite extreme, when the pore size is much larger than the foulant (Fig. lb), the foulant enters the pore, adsorbing on the pore walls and reducing the effective pore size. Fluxes decrease - - as would be expected - - due to the reduced flow area and represent the situation for which the pore restriction model is best suited. At some intermediate pore sizes (Fig. lc), the foulants mask the membrane's pores and establish new separation characteris- tics determined by the size o f the foulants, as was shown by Meireles et al. [4]. Once again, the hydraulic resistance increases, resulting in flux reductions.
158 M.M. Dal-Cin et al. / Desalination 101 (1995) 155-167
In the intermediate case, the new effective molecular weight cut-off (MWCO) of the m e m - brane was shown to be a function o f the size of the adsorbed foulant. The pore size was deter- mined by the intermolecular spaces and in- creased with increasing foulant size. The pore size distribution was also considerably narrow- er. This would be expected as the foulants were virtually monodispersed, resulting in similar intermolecular openings.
3. M a t e r i a l s
The feed material used for the adsorption study was the PSFP from an SCMP mill. This effluent is a complex mixture of resin and fatty acids (RFAs), soluble and insoluble lignins, simple organic acids, sugars, fine wood fibres and polysaccharides. The composition of PSFP is summarized in Tables 1 and 2. Samples were: collected during regular operation of the pulp mill, screened with a 400-mesh sieve and re- frigerated at 2 ° C until used.
A wide range o f m e m b r a n e materials and pore sizes was evaluated to determine their adsorptive fouling characteristics. Membranes were obtained f r o m c o m m e r c m l manufacturers or produced with an automated casting machine in our laboratories. The m e m b r a n e materials tested are summarized in Table 3; individual m e m b r a n e s will be highlighted in later discus- sions.
Membranes were characterized using 6000 Da polyethylene glycol (6 K PEG) as a test solute. The PEG was used as purchased from Fluka with a claimed molecular weight distributionof500G-- ;000 Da.Characterization solutions were prepared with a concentration of 260 ppm PEG in rew, rse osmosis (RO) water.
4. E x p e r i m e n t a l
Membranes were characterized at 3.4 bar (50 psi), a cross-flow velocity o f 0.8 m/s at 25°C using thin channel test ceils with an effective surface area o f 1 4 . 5 x 1 0 - 4 m 2 as described by Hazlett et al. [13]. The cross-flew velocity corresponds to a Reynolds n u m b e r o f - 8 0 0 . The geometry o f the c~,li causes the feed to impinge normal to the plane f f the membrane. This flow pattern and the short travel path promote mixing at the m e m b r a n e surface beyond that suggested by the Reynolds number. The low test solute concentration and cell design minimize concentration polarization which would bias estimates o f the pore size.
Membrane coupons were first characterized by their P W P after 5 h permeation with RO feed water. This ensured complete removal of any residual solvents and/or storage media.
Table 2
Composition of unfiltered PSFP
Table l
Molecular weight distribution of PSFP
Molecular weight Dissolved Total organic solids, wt% carbon, wt% < 1 K 52 42 1 K < mw < 3K 18 20 3 K < mw < 30K 1 t' 30K < mw < 100K 3 38 > 100 g 26 pH 5.7 Electrical conductivity, ttfl 5,100 Dissolved solids, mg/I 12,600 Suspended solids, mg/i 1,700 Total organic carbon, ~ng/l 5,670 Biological oxygen demand, mg/i 5,250 Resin and fatty acids, rag/! 432 Lignin sol, mg/i 2,400 Lignin insol, mg/! 1,900 Volatile acids, rag/! 920 Sugars, mg/i 2,680
M.M. Dal-Cin et al. /Desalination 101 (1995) 155-167
Table 3
Average RF of various membrane materials after contacting PSFP for 3h at 50°C
-159
Material No. of samples RF
Average (%) SD (%) Minimum (%) Maximum (%) Teflon 1 274 TFCs 9 130 75 21 237 Reg cell 11 99 l I 82 113 Modified PVDF 8 97 39 42 146 Olefin 1 95 CA 9 91 35 36 149 Sulfonated PS 1 39 PVDF 8 78 28 38 119 PAN 6 70 23 43 106 PAl 9 58 29 12 93 CTA 7 53 31 12 88 Acrylic 2 49 22 33 64. PS 20 41 33 7 134 PEI 8 30 11 13 44 Modified PS 8 29 24 6 68 PES 10 22 12 8 48 PA 4 21 15 9 41
Separations were evaluated using 6 K PEG and RO water was then recirculated until the PEG concentration was reduced to < 2 ppm. Mem- brane coupons were removed from the test cells and contz, cted with the effluent on both surfaces at 50°¢! for 3 h with gentle stirring at 1 h intervals. This temperature was selected as it is the expected operating temperature o f a full-scale installation. Membrane coupons were rinsed under RO water for - 1 rain on both sides and reinstalled in the test cells. The P W P with RO water and 6 K PEG separation charac- teristics were then redetermined. Concentra- tions o f the feed and permeate were determined with a Shimadzu 5000 TOC analyzer.
5. Membrane characterization
The PEG separations were used to estimate the pore size using a single parameter (rp) radially averaged pore model according to Tremblay [14]
f = 1 - x (4)
1 - e -Pe(1 - X )
The pore Peclet number, Pc, is the ratio o f the convective and diffusive transport o f the solute through the pore. Both types o f solute flow account for the influence o f the pore wall as the solute size approaches the pore size. A global steric parameter (X) associated with the restricted convective transport within the pore and the ratio o f restricted diffusivity (~) o f the solute within the pore to the bulk diffusivity o f the solute are calculated numerically [i5]. The Peclet number can be defined as
(5)
The viscosity o f water is # and A P is the pres- sure drop across the membrane.
160 M.M. Dal-Cin et al. /Desalination 101 (1995) 155-167
A parameter characterizing the combined effects o f a membrane's porosi'.y and resistance to flow can be obtained from the pure water permeation rate once the pore radius (rp) has been determined from the 6 K PEG solute sieving experiments [16]. Rearranging the Hagen-Poiseuille equatien, a ratio of the num- ber o f pores (n) to the pore length (Ax) per unit area (A) can be obtained:
_ 8 Q ~
Ax A ~r A Pr4 A (6)
This ratio is a convenient measure of a membrane's performance for a given pore size. Using the pore size and n/AxA provides more information regarding changes at the membrane surface than would be possible using the MWCO and PWP.
6. R e s u l t s a n d discussion
6.1. Relative pure water flux and membrane materials
From a practical point of view, the RF provides a clear measure of the effects of adsorptive fouling with PSFP. The RFs for various membrane materials are summarized in Table 3 and indicate the average RF, standard deviation, minimum and maximum R F values and the number o f coupons tested. The large number o f coupons, manufacturers and pore sizes evaluated in several classes of materials made identification of each membrane imprac- tical.
A large range of RFs is immediately evi- dent, from - 2 0 % to almost 300%, with con- siderable variability for some materials. This may stem from the nature o f the experiments, testing o f single coupons and various mem- brane preparation m~,thods from the different manufacturers. Despite this, the ranking of materials largely follov s expected trends, the most hydrophobic materials having the lowest
RF.
Fluorinated polymers such as Teflon (poly- tetrafluoroethylene) have low surface energy and would be expected to exhibit little or low adsorption. However, it was not clear what adsorptive fouling, if any, may have occurred with the Desalination Systems, Inc~ K150 Teflon membrane tested (0.1/~m). The P W P f increased to 274 % o f the P W P i after exposure to PSFP. The increased P W P may have been due to only partial removal of storage media. The P W P increased from 30 to 147 l/m2/h during the 5 h preconditioning and so the high
RF may have been a continuation of this trend. Polyvinylidene fluoride (PVDF) has chemical properties similar to Teflon; it would be ex- pected to adsorb more material due to the presence o f - C H 2 groups. These membranes had an average RF of 78%, ranging from 38% to 119%. The range o f RFs for the PVDF membranes and odd results with the Teflon membrane made comparisons between the two materials difficult.
Modified PVDF membranes showed a wide range of RFs after contacting with PSFP. This may be expected given that there were three manufacturers making this class o f membranes, undoubtedly using different modifications. Poor reproducibility was obtained with the DDS ETNA series (1 K, 1 0 K and 2 0 K MWCOs). RFs o f - 1 5 0 % and - 6 0 % were observed for the same pore sizes in replicate tests. Separations of 6 K PEG decreased by more than 20-30% when the R F w a s > 100%. This suggests that the surface modification may be removed or degraded by PSFP. Past experi- ence with these membranes in our laboratories has seen definite colour changes after use, from dark to light brown, suggesting a loss o f the surface modification or coating. Similar observations have been made by researchers at Wastewater Technology Center.
The thin film composite (TFC) class o f membranes also showed widely varying de- grees of fouling resistance. As with the modi- fied PVDF membranes, this was not unexpect-
M.M. Dal-Cin etal. / Desalination 101 (1995) 155-167 161 ed as this class could consist of widely varying
surface chemis*.ries. The Desalination Systems Inc. G10 and G50 (2 K and 15 K MWCO, respectively) and Nitto Denko Corp. NTR 7410 (10% NaCl separation) are reported to be sulfonated polysulfones. Nitto Denko Corp. describes their NTR 729HF membrane as a polyvinylalcohol (PVA) derivative. Peterson [17] suggests that there is also polypiperazine- amide present in the barrier layer along with the PVA. D e s a l i n a t i o n ' s D E S A L 5 (200 MWCO) composition is unknown, although it may be a tri-laminate of polypiper- azineamide on a sulfonated polysulfone on polysulfone [17].
Changes in their performance varied consid- erably after contacting with PSFP. The G10 and G50 fluxes increased beyond their PWPis
while maintaining or increasing the separation of 6 K PEG. The RF for the DDS GS81 (6 K MWCO), which is a non-TFC-sulfonated mem- brane, was 39%, indicating severe adsorptive fouling. The R F for the NTR 729HF was > 200% in replicate tests. Unlike the G10 and G50 membranes, 6 K PEG separations decreased from - 9 0 % to - 5 0 % , suggesting some change in the membrane surface mor- phology or properties.
Several TFC membranes had RFs > 100% even though separations increased marginally. This does not imply that the membrane was degraded as the separations would have de- creased in such a case. Membranes were pres- surized with water for 5 h before testing, so
P W P increases were unlikely to have been caused by washing away some sort of storage media, unless it was not highly wztcr soluble as was suspected with the Teflon membrane. It is possible that the top layer of the composite membrane was partially removed by PSFP, but still left intact at the coating/support interface. This would have reduced the hydraulic resis- tance resulting in higher PWPs while the sepa- ration of 6 K PEG would have remained the same or increased if some PSFP remained on
the surface. This mechanism is difficult to verify, but the observed behaviour is unlikely to be an anomaly given that it was largely restricted to coated membranes such as TFCs, modified PVDF and was reproducible with several membranes.
Cellulosic membranes were further subdi- vided into cellulose acetate (CA), cellulose tri- acetate (CTA; and regenerated cellulose (RC). The regenerated cellulosics all had extremely high RFs with a minimum of 90%, suggesting little or no adsorptive fouling. This was sup- ported by the negligible changes in 6 K PEG separations. Some coupons had RFs slightly above 100%, which may have been due to experimental error, unlike the large increases discussed earlier. The low adsorptive fouling with regenerated cellulose membranes with PSFP is consistent with previously reported work using proteins such as BSA [1] and peptides [18].
The cellulose acetate and tri-acetate samples showed some variability in adsorption. The average cellulose acetate RF was 91%, largely due to the performance of four different 'MWCO membranes from Osmonics Inc. (S series with MWCOs of 2 K, 20 K, 50 K and 100 K). The remaining cellulose acetate mem- branes appeared to have somewhat lower RFs at - 5 3 % . The tri-acetates fouled more than the other cellulosics. The increasing RF of the cellulosic membranes was consistent with the increasing hydrophilicity of materials and their composition: cellulose > cellulose acetate > cellulose tri-acetate. Cellulose tri-acetate was expected to be the most hydrophobic with three acetate groups.
Polyamide (PA), polysulfones (PS and PES) and polyether-imide (PEI) are considered to be hydrophobic materials which would exhibit severe adsorptive fouling. This was the case with RFs for each class of material ranging fr~m 21% to 41%. High increases of 6 K PEG separation were observed with the low RFs for these materials. The modified polysulfones
162 M.M. Dal-Cin et al. / Des~!ination 101 (1995) 155-167
tested had been typically used in biological applications where they had superior adsorptive fouling resistance. The low R F s exhibited with PSFP suggest that they are not compatible with this feed.
The R F o f polyacrylonitrile (PAN) and
p o l y a m i d e - i m i d e (PAl) m e m b r a n e s varied considerably. The R F o f PAl membranes was loosely tied to the initial pore size, following the trend predicted by the pore size restriction model, while there was no obvious trend with the P A N m e m b r a n e s .
The range o f RFs observed for a wide range o f materials demonstrates the potential for adsorptive fouling to influence m e m b r a n e p e r f o r m a n c e with PSFP. Regenerated ce~-lulose m e m b r a n e s f r o m several manufacturers all exhibited very low fouling with respect to unaltered p o r e sizes and RFs. Several T F C s also appear compatible with PSFP although changes o f m e m b r a n e properties warrant fur- ther investigation.
6. 2. R e l a t i v e f l u x e s and p o r e size relationships
The p o r e restriction model predicts a dimin- ishing relative flux loss as the pore size in- creases. This trend was not observed with any o f the m e m b r a n e materials due to large varia- tions in the R F throughout the range of pore sizes. These variations may have been due to differences in manufacturing, storage media, additives, etc. of the suppliers. Membranes with a wide range of pore sizes were made in our laboratories [19] with PAI, PEI and PES, under similar conditions to study the relation- ship between adsorptive fouling and pore size.
The R F varied considerably for the PAl
m e m b r a n e s , ranging from 12% to 93% (Table 4) and could not be correlated with the initial P W P , although the higilest R F s were obtained with the most permeable membranes. Separations o f 6 K PEG before contacting with PSFP were already near 100% for the tighter PAI m e m b r a n e s (1-4), making pore size
Table 4
Relative fluxes for PAI, PEI and PES membranes for increasing MWCOs (as indicated by the increasing
PWP and d~.creasing 6 K PEG separation)
Material PWP i RF PWP S 6 K PEG (l/m2/h) (%) (I/mZ/h) separation (%) Before After PAl: 1 48 46 22 99 102 2 84 72 61 97 99 3 95 45 43 101 97 4 108 73 79 92 99 5 125 69 86 81 90 6 615 12 73 23 84 7 729 22 157 14 87 8 1474 93 1372 6 2 9 4887 90 4403 --1 0 PES: 1 78 24 19 44 91 2 140 18 25 88 94 3 256 1i 28 34 98 4 322 8 24 36 98 5 364 16 57 7 81 6 670 17 113 7 84 7 795 48 381 6 18 PEI: 1 127 13 16 77 95 2 147 24 35 71 61 3 257 17 44 51 93 4 322 35 114 17 46 5 436 36 159 5 45 6 878 40 349 1 13 7 1047 31 329 4 48 8 1086 44 482 5 12
changes undetectable. Separations for inter- mediate PAl m e m b r a n e s (5-7) approached similar levels ( - 85%) despite widely different initial separations.
A series of PES membranes also showed similar trends. Separations for m e m b r a n e s 1-6 increased to high levels ( > 80%) f r o m initial levels as low as 7%. Several approached 100% separation; hence it is not known if the new
M.M. Dal-Cin et al. / Desalination 101 (1995) 155-167 163 o d 0.0
~
~2
d~
1/r i(nm-')
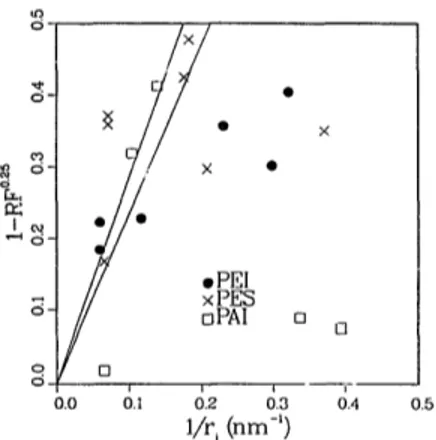
i" 0.4 0.5Fig. 2. (1 -Rb -0"25) plotted as a function of 1/r i for PAl, PES and PEI membranes. The solid lines represent theoretical values for adsorbed layer thicknesses 2.35 < la <2.85 nm.
> 5.0 nm, which Was in reasonable agreement with the adsorbed layer thickness. Smaller pores would result in the adsorbed layer bridg- ing the pore rather than covering the interior pore wall.
The behaviour exhibited by the PES and PAl membranes can be described by the foul- ing mechanisms proposed by Meirles et al. [4] and Brink et al. [12]. The separation character- istics of membranes with intermediate pore sizes appear to be determined by the membrane after adsorptive fouling. The similar separa- tions for 6 K PEG for intermediate membranes suggested that the separations were effected by the adsorbed layer. The similarity of the P W P f
for these membranes suggested that the fouling layer was a significant, if not the dominant, hydraulic resistance. This behaviour was not observed for membranes with large initial pore sizes, as would be expected from the discussion of Fig. 1.
effective pore size was smaller than indicated.
PWPIs also approached a common value at - 2 5 - 3 0 l/m2/h. Membranes produced from PEI showed no trends with neither separations nor fluxes approaching a common level.
A quantitative analysis of the pore restric- tion model can be made using Eq. (3). Fig. 2 shows no correlation between ( I - R b -°'zS) and
l l r i over the observed range of pore sizes for any of the materials. Estimates of the adsorbed layer thickness, l a, can be obtained if the anal- ysis is restricted to membranes with the largest pore sizes. It would appear that from Fig. 2 a straight line through the origin was plausible only for l l r i < 0 . 2 nm -1. A linear regression on these data gave adsorbed thicknesses of 2.35, 2.47 and 2.85 nm for PEI, PAi and PES, respectively. The upper and lower ranges of l a
are shown in Fig. 2 as solid lines. Given the scatter in the experimental data, the differences between I a for the different materials should not be considered significant. The pore restric- tion model was adequate only for pore radii
6.3. Pore size and porosity effects
Changes in m,~mbrane morphology can also be examined more rigorously using the ratio
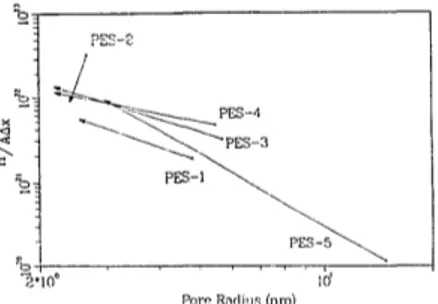
n l A x A and pore size described earlier. P W P
reductions are expected after adsorptive fouling but cannot distinguish between adsorptive fouling resulting in pore restriction, plugging or a continuous layer on the membrane surface. Fig. 3 shows how these parameters changed for PES membranes after adsorptive fouling. The membrane designation (e.g., PES-2) and ar- rowhead of the vector indicate the properties of the new and fouled membrane, respectively. All membranes showed a pore size reduction, as they must, based on the increased 6 K PEG separations described earlier. However, the increase in the ratio n l A x A was unexpected. These observations dearly contradict the pore restriction model which would predict either a constant or decreasing n l A x A . This ratio would decrease either through total pore blockage (decreasing n) or by Ax increasing due to the
164 M.M. Dal-Cin et al. /Desalination 101 (1995) 155-167
ilJ PES-8
%!
. . .
\
~, 1o o I0'
Pore Radi,m (nra)
Fig. 3. Changes in PES membrane characteristics due to adsorptive fouling with PSFP.
% " PAI-7
.-~,10 . . . . 1~]~ Pore Radius (nm)
Fig. 4. Changes in PAI membrane characteri3tics due to adsorptive fouling with PSFP.
~ ~ PEI-3
:<
Pore Radius (rim)
Fig. 5. Changes in PEt membrane characteristics due to adsorptive fouling with PSFP.
effective m e m b r a n e thickness increasing by the adsorbed layer thickness, l a. The new pore size and n / & r A reflect the properties o f the new adsorbed layer. The mechanism of an adsorbed layer establishing new permeation characteris- tics is m o r e likely and can account for n / A x A
increasing, as was already demonstrated by Mereiles et ai. [4] in Figs. la and lc.
The use of a single solute to characterize the p o r e size limits the number o f usable PAI m e m b r a n e s to three. Estimation of pore size changes with the other samples is difficult as the 6 K PEG separationv were either nearly
100% or zero. The PAi m e m b r a n e data pre- sented in Fig. a show trends similar to those observed with the PES m e m b r a n e s , a reduction in the effective pore size and increasing n / A x A .
Another feature o f both the PES and PAI fouled m e m b r a n e data is the similarity o f fouled pore sizes, which follows f r o m the similarity of the 6 K PEG separation data. The PES and PAI m e m b r a n e s have a fouled effec- tive pore radius between 2 . 5 - 3 nm. This obser- vation is also consistent with that predicted by Mereiles et al.
Mixed results were obtained with the PEI membranes. The ratio n l A x A decreased with two o f the membranes and did not tend toward a c o m m o n effective pore size (Fig. 5). This may suggest a different fouling mechanism from that of the PAl and PES m e m b r a n e s , such as pore plugging or pore restriction. This was unexpected as the initial pore size ranges for all three m e m b r a n e materials were similar and all exhibited severe fouling.
6.4. Error analysis
The use of multiple PEG solutes for pore size estimation would have utilized a larger range of initial m e m b r a n e pore sizes and al- lowed a more accurate estimation o f the
M.M. Dal-Cin et al. / Desalination 101 (1995) 155-167 165
Table 5
Variability of the membrane porosity parameter, nlAxA, based on an error of +5% on the 6 K PEG separation
Membrane n Pore radius range (nm) Are changes range (m -3) significant7 AxA
Clean Fouled Clean Fouled
PAI: 5 1.59-2.67 x 10²² 1.74- 3.26 x 10²² 3.16- 2.77 2.81-2.40 Not significant 6 1.62-4.55 x 10²¹ 1.08- 1.85 x 10²² 8.31- 6.42 3.04-2.66 Significant 7 0.4 -2.15×10²¹ 2.7 - 4.8 xl022 12.3 - 8.08 2.92-2.53 Significant PES: 1 1.33-2.46×10²¹ 4.06- 7.82x10²¹ 5.21- 4.47 2.7 -2.35 Significant 2 2.56-4.58x10²² 0.63- 1.44x10²² 2.88- 2.49 2.66-2.16 Significant 5 0.08-3.79 x 10²⁰ 7.24-12.2 x 10²¹ 27.3 -10.5 3.16-2.77 Significant PEI: 2 1.14-1.87x10²² 1.62- 2.71x10²¹ 3.57- 3.16 4.06-3.57 Significant 3 0.68-1.19x10²² 1.05- 2.21×10²² 4.67- 4.06 2.69-2.24 Not significant 4 0.34-1.34 x 10²¹ 2.22- 4.03 x I021 10.5 - 7.41 5.05-4.35 Significant
changes in m e m b r a n e properties. Nonetheless, these changes cannot be attributed to experi- mental error. The estimate o f the pore size was calculated using Eq. (4) which is a complex function o f the test solute to pore size ratio. The ratio n/AxA is inversely proportional to the fourth p o w e r o f the pore size as predicted by the Hagen-Poiseuille relationship, making the determination o f n/AxA sensitive to pore size estimates.
The significance o f the changes in m e m - brane m o r p h o l o g y can be seen in Table 5. They were used as an alternative to error bars on n/AxA in Figs. 3 - 5 for the sake o f clarity. The accuracy o f the 6 K PEG separation data was generously assumed to be _+5%. Taking the upper and lower limits of the plausible range o f separations, the equivalent pore sizes were estimated. These were used to determine a range o f n/AxA values for a fixed P W P i and
PWPf. Significant changes were taken to be those for which n/AxA values did not overlap. Only two cases were determined to be insignif- icant - - PAI-5 and PEI-3. Figs. 3 - 5 showed several other cases where large increases o f
n/AxA were observed. These were not included as the assumption o f 4-5% error on the 6 K PEG separation data would have resulted in
separations < 0 or > 100%. Similar increases o f nlAxA were observed for numerous other membranes summarized in Table 3.
7. Conclusions
Adsorption or contacting tests w e r e shown to p r o v i d e qualitative information on adsorp- tive fouling o f various m e m b r a n e materials with PSFP. Materials were ranked on the basis o f their relative flux, R F = P W P / P W P i, after contacting PSFP in the absence o f any trans- m e m b r a n e pressure. Ideal m e m b r a n e materials based on these criteria were regenerated cellu- lose and various hydrophilic TFCs. H y d r o p h o - bic materials such as polysulfones, p o ! y a m i d e - imide and polyether-imide exhibited severe adsorptive fouling.
Increased pure water permeabilities after adsorption tests were observed for several TFCs, modified P V D F and surface-coated membranes. Test solute separations were often maintained in these situations suggesting that the m e m b r a n e was not damaged. The increased pure water permeability may have resulted from further removal o f storage media or partial removal o f the surface modification,
166 M . M . Dal-Cin et al. / Desalination 101 (1995) 1 5 5 - 1 6 7 lowering the hydraulic resistance o f the mere- PEG - -
brane. PSFP - -
Estimates o f the adsorbed layer thickness P W P - - obtained f r o m the pore restriction model
ranged f r o m 2.35 to 2.85 nm for a set o f con- P W P f - - trol m e m b r a n e materials. This model appeared
to be adequate for pore radii > 5 nm, as ex- P W P i - - pected for the estimated adsorption layer thick-
ness. AP - -
Changes in the m e m b r a n e ' s m o r p h o l o g y Q - - described by the pore radias and the ratio R F - - n / A x A suggested adsorptive fouling on the RFA - - surface o f the m e m b r a n e for pore radii R j - - < 5 nm. The fouled m e m b r a n e s showed a
tendency to a similar pore radius between 2 . 5 - 3 nm, indicating the formation of a new
surface on the m e m b r a n e whose pore size is rp - - determined by the adsorbed layer. The r i - - o b s e r v e d increases o f n l A x A were inconsistent
with adsorption in the m e m b r a n e pores and SCMP - - could not be attributed to experimental error. T O C - - The ratio n l A x A would be expected to decrease Ax - - during pore restriction due to pore plugging
(reduction o f n) or an increase in the effective pore length Ax due to the adsorbed layer. The G r e e k increased ratio n l A x A reflects the properties o f the layer adsorbed on the m e m b r a n e surface. # This behaviour was consistent with changes in oTr m e m b r a n e m o r p h o l o g y measured by Meireles et al. [4].
8. S y m b o l s
A - - effective permeation area of m e m - brane, m 2
D ~ - - diffusivity o f solute in solution, m2ls
f - - separation
l a - - thickness o f the adsorbed layer, m L M H - - permeation rate, l/m2/h
n - - n u m b e r of pores P e - - Peclet number
polyethyleneglycol plug screw feeder pressate pure water permeation rate, (L)/m2/d
pure water permeation rate after adsorptive fouling, (L)/m2/d pure water permeation rate for a new m e m b r a n e , (L)/m2/d pressure drop across the pore, kPa volumetric flow rate, ma/h percent relative flux, P W P I I P W P i resin and fatty acids
hydraulic resistance o f m e m b r a n e , or resistance due to adsorption, pore plugging or concentration polarization, 1/m
pore radius, nm
pore radius o f a new m e m b r a n e , nm
semi-chemical mechanical pulp total organic carbon
effective length of the m e m b r a n e pore, m
- - viscosity, Pa- s
- - reflection coefficient and osmotic pressure, Pa
- - ratio o f restricted diffusion within
the pore to free diffusion in bulk solution
- - global steric parameter 9 . A c k n o w l e d g e m e n t s
The authors would like to thank Pritham Ramamurthy of the Pulp and Paper Research Institute of Canada, Ashwani K u m a r and Chung Ming T a m of I . E . R . T . for helpftd dis- cussions, and Eric Chen for performing perme- ation experiments.
M.M. Dal-Cin et al. / Desalination 101 (1995) 155-167 167
R e f e r e n c e s
[1] M.K. Ko and J.J. Pellegrino, J. Membr. Sci., 74 (1992) 141.
[2] C.M. Tam and A.Y. Tremblay, J. Membr. Sci., 57 (1991) 271.
[3] A.S. Jonsson, J. Membr. Sci., 79 (1993) 93. [4] M. Meireles, P. Aimar and V. Sancbez,, J.
Membr. Sci., 56 (1991) 13.
[5] H.J. Hanemaaijer, T. Robbertsen, Th. van den Boomgaard and J.W. Gunnink, DesaIination, 68 (1989) 199.
[61 L.E.S. Brink and D.J. Romijn, Desalination, 78 (1990) 209.
[7] A.M. Brites and M.N. de Pinho, J. Membr. Sci., 78 (1993) 265.
[8] J.R.V. Flora, J. Membr. Sci., 76 (1993) 85. [9] P. Dejmek and J.L. Nilsson, J. Membr. Sei., 40
(1989) 189.
[10] K.M. Persson and J.L. Nilsson, Desalination, 80 (1991) 123.
[11] G. Belfort, J. Pimbley, A. Greiner and K.Y. Chung, J. Membr. Sci., 77 (1993) 1.
[12] L.E.S. Brink, S.J.G. Elbers, T. Robbertsen and P. Both, J. Membr. Sci., 76 (1993) 281. [13] J.D. Hazlett, O. Kutowy and T.A. Tweddle, in
Proc., 2nd Internat. Conf. Separations Sci. and Tech., M.H.I. Baird and S. Vijayan (eds.), Cana- dian Soc. for Chem. Engineering, Ottawa, 1989, pp. 65-74.
[14] A.Y. Tremblay, The role of structural forces in membrane transport: cellulose membranes, Ph.D. Thesis, University of Ottawa, 1989.
[15] J. Happel and H. Brenner, Low Reynolds Number Hydrodynamics, Martinus Nijhoff, Dordrecht,
1986.
[16] T.A. Tweddle, C.N. Striez, C.M. Tam and J.D. Hazlett, Desalination, 86 (1991) 27.
[17] R.J. Petersen, J. Membr. Sci., 83 (1993) 81. [18] P. Mourot and M. Oliver, Sep. Sci. and Technol.,
24(5,6) (1989) 353.
[19] C.M. Tam, M.M. Dal-Cin and M.D. Gui'¢er, J. Membr. Sci., 78 (1993) 123.