Any correspondence concerning this service should be sent to the repository administrator: [email protected]
This is an author-deposited version published in: http://oatao.univ-toulouse.fr/ Eprints ID: 11840
To cite this version:
Fourcade, Thibaut and Dalverny, Olivier and Alexis, Joël and Seguineau, Cédric
and Desmarres, Jean-Michel Parametric identification of elastic-plastic
constitutive laws using spherical indentation. In: 5th International Symposium
on Aircraft Materials - ACMA 2014, 23 April 2014 - 26 April 2014 (Marrakech,
Morocco).
O
pen
A
rchive
T
oulouse
A
rchive
O
uverte (
OATAO
)
OATAO is an open access repository that collects the work of Toulouse researchers and makes it freely available over the web where possible.
Parametric identification of elastic-plastic constitutive laws using
spherical indentation
T. Fourcade1, O. Dalverny1, J. Alexis1, C. Seguineau2, J.M. Desmarres3 1 LGP-ENIT, 47, avenue d'Azereix, BP 1629 - 65016 Tarbes CEDEX
2 FIALAB, 425 rue Jean Rostand, 31670 Labège, France
3 CNES, DCT/AQ/LE, 18 Avenue Édouard Belin, 31401, Toulouse, France
Keywords: Parametric identification, Finite Element Modelling, Spherical tip, instrumented indentation, pile-up.
Abstract
In this paper we present a methodology to characterize elastic-plastic constitutive law of metallic materials using spherical indentation tests and parametric identification coupled with finite elements model (FEM) simulation. This procedure was applied to identify mechanical properties of aluminium, copper and titanium and the identified models show differences with experimental uniaxial tensile tests results that do not exceed 10%. A sensitivity study according to a 2 Design of Experience (DoE) was achieved to determine which data that can be extracted from pile-up is the most relevant to use in order to enhance the identification procedure. It appears that the maximum pile-up height seems to be the best suited for this purpose.
1.
Introduction
During the lasts decades, extensive research has been devoted to the characterization of elastic-plastic properties for a wide range of materials using indentation techniques. Two main approaches can be noticed in the literature. The first one consists in the resolution of an analytical direct problem [1, 2, 3] and the second one consists in the resolution of an inverse problem [4, 5, 6, 7, 8, 9] using or not Finite Elements Model (FEM). The aim of the study is to develop a methodology to characterize elastic-plastic constitutive law of metallic materials using spherical indentation tests and parametric identification coupled with FEM simulation.
In the first part of the paper, the identification procedure is described and the results of the identification for three materials are compared to those obtained through uniaxial tensile test in order to validate its accuracy and robustness.
The second part is dedicated to discuss the possibility of adding experimental information from the pile-up after unloading as a further information to use into the identification procedure.
2.
Identification of constitutive laws using spherical
indentation
2.1.
Tested materials and experimental procedure
The three tested materials are aluminium 1050-O, temper hard copper and mill annealed titanium T40. The titanium has a hexagonal close-packed (hcp) lattice whereas both the other materials have a face centred cubic (fcc) structure.
• Standard characterization
The identification results have been compared to those of a well-known normalized test. For each materials, at least 7 tensile tests have been performed according to the ISO NF EN 6892-1 and the results are summarized in Table 1. All the uncertainties on mean values given in this paper are calculated with a confidence interval of 95% using the Student law.
Elastic Modulus (GPa) Yield stress . (MPa) Ultimate strength (MPa) Ultimate strain (MPa) Aluminium 69 ± 4 59 ± 4 120 ± 9 0.26 ± 0.03 Copper 106 ± 9 262 ± 39 279 ± 39 0.12 ± 0.01 Titanium 107 ± 2 222 ± 3 413 ± 50 0.42 ± 15
Table 1: Tensile tests results.
The elastic-plastic behaviour of the three material cannot be represented by a unique constitutive law. Both the aluminium and the copper can be described using Ramberg-Osgood expression [10] which allows a soft elastic-plastic transition:
= + 0,002
, ( 1 )
This model involves three independent parameters: the modulus of elasticity , the conventional yield stress . and the hardening parameter !.
Because of its linear hardening, the titanium is better described by a modified version of the Rasmussen model [11, 12] which is based on the model of Ramberg-Osgood:
= " + 0,002 , si ≤ , & , + 0.25 ' () * + . + 0.002 si > , ( 2 )
Until reaches . , the Rasmussen model is the same as the Ramberg-Osgood expression. When stress has reach yield stress, the transformed stress is defined as:
= − . ( 3 )
In order to insure a continuity between both the parts of the curve, the . modulus is calculated as the tangent modulus of the stress-strain curve when = . . It is then obtained from equation ( 1 ) as - /- | 0 . :
. =12 . '3 .
4 ) ( 4 )
The transformed ultimate stress is calculated according to equation ( 3 ) as :
= − . ( 5 )
The Rasmussen model is then constituted of 5 independent parameters.
• Indentation tests:
The indentation tests have been performed using a 1mm diameter spherical tip. The maximum load is 150 N for the aluminium and 300N for both the copper and the titanium and ten imprints were performed for each material. During the test, the load 5 has a function of the penetration ℎ
of the tip has been continuously monitored. Figure 1 shows the mean indentation curve of the indentation tests performed on aluminium. The error bar represent the uncertainties on the mean value with a confidence interval of 95% using Student Law.
Figure 1: Mean load-displacement curve of indentation test on aluminium specimen.
2.2. Identification algorithm and numerical model
The identification of the parameters values of the behaviour law was achieved using the results from the indentation tests and corresponds to the resolution of an inverse identification problem. A usual methods of resolving such a problem is summarized in Figure 2.
Figure 2: Block diagram of the identification of constitutive law from indentation tests.
The considered constitutive laws are the Ramberg-Osgood one for the aluminium and the copper and the Rasmussen one for the titanium. The modulus of elasticity is usually calculated with the earlier stages of the unloading slope [13] and we consider it as known during the identification. The values used in the identification for the three materials are the ones calculated from the tensile tests shown in Table 1. Thus, the number of parameters to evaluate with the identification for the Ramberg-Osgood law and the Rasmussen law are respectively 2 and 4.
The inputs of the problem are the experimental response from the indentation tests, the
0 0.05 0.1 0.15 0 20 40 60 80 100 120 140 160 Indentation depth (mm) L o a d ( N ) Constitutive law Validation Difference vector measurement - 7(8) 9(8) < ; Parameters updating NO YES Identification process Experimental response Initial parameters
Numerical model of the test
Geometry+ BC
Numerical response
behaviour law of the tested material associated with a set of initial parameter and the numerical model of the test. For a set of parameters <, a difference vector =(<) is then calculated as:
=><? = @A1><?, … , AC><?, … , A ><?, D1><?, … , DC><?, … , D ><?E ( 6 ) where AC><? = FGHI 4J>K?LH IMNO HIMNO and DC><? = F* HPQN4J I>K?LHPQNMNOI
HPQNMNOI . 5GKR is the mean experimental
indentation curve, 5 S is the simulated one, 5TUVS and 5*WKGKR are respectively the maximum of the experimental and simulated indentation curve. FG and F* are weights and have respectively a value of 1 and 2 in order to maximize the weight of the value at maximum depth, which is the one with the smallest uncertainty. Specimen roughness, presence of surface hardening and tip defect may have a significant influence on the earlier stages of the loading curve. In order to minimize such effects, the 10 first percent of the loading curve are not taken into account in the calculation of the difference vector.
The cost function is then defined as the Euclidean norm of the difference vector:
X><? = Y=><?Y ( 7 )
The identification is led by minimising the cost function using the Levenberg-Marquardt algorithm from the scipy.optimize python library. As a descent algorithm, the Levenberg-Marquardt algorithm is sensitive to local minima and thus the choice of the initial parameters value is critical for the algorithm not to converge towards the global minimum. The initial parameters are then chosen close to the global minimum using a Monte-Carlo stochastic random method. The number of draws is function of the number of parameters Z to evaluate as 2C with a minimum of 16 draws. The validity domain of the parameters are given in Table 2. The parameters corresponding to the minimum value of the cost function are then used as initial parameters for the Levenberg-Marquardt algorithm.
. (MPa) ! [ (MPa)
Min Max Min Max Min Max Min Max
Ramberg-Osgood 10 350 1.1 60
Rasmussen 10 350 1.1 60 1.1 3 20 850
Table 2: validity domain for Ramberg-Osgood and Rasmussen models during identification process.
The numerical model of the indentation test has been achieved using Abaqus. It consists in an axisymmetric model [4, 14, 15, 7, 16] with a refined “ALE adaptative meshing” of the area under the tip in order to minimize distortion of the elements. The elements size is linked to the maximum depth of indentation. The elastic-plastic behaviour of the material is a multi-linear model with an isotropic hardening. The specimen is made of CAX3 elements under and near the tip and the furthest are infinites CINAX4 elements in order to take into account the far displacement field even in a “local” problem such as indentation tests. The tip is made of CAX4R and CAX3 elements and its mechanical behaviour is linear with a modulus of elasticity and Poisson coefficient are respectively equal to 240GPa and 0.33. A “Surface-to-surface” method is used to model the contact between the tip and the surface and the contact is considered frictionless [4, 14]. The shape of the simulated indentation curve are similar to the experimental ones and no numerical oscillation can be noticed on the curve.
2.3. Identification results and discussion • Results :
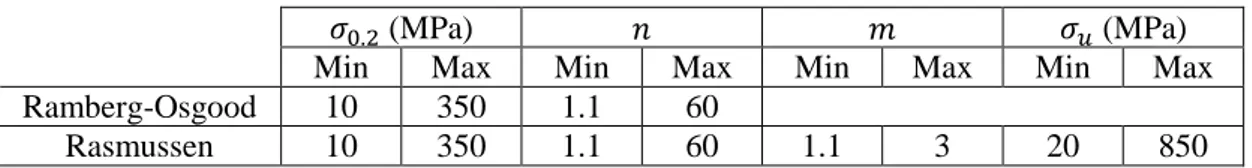
The random Monte-Carlo procedure allows to get a set of parameter close enough to the global minimum. Table 3 shows that the Levenberg-Marquardt procedure allowed to minimize the cost function for the three materials. It can be noticed that the final values of the cost function are similar for the three materials. The final simulated indentation curve is very close from the experimental one as it can be seen in Figure 3-a. The parameters of the constitutive law for the three materials are also given in this table. Figure 3-b, c, d show the experimental tensile curve and the identified constitutive law for the three materials. The identified behaviour is close of the experimental one in the three cases.
a) b)
c) d)
Figure 3: Experimental and simulated indentation curves for aluminium (a), experiment and identified tensile curves for aluminium (b), copper (c) and titanium (d)
Initial cost function Number of iterations Final cost function . (MPa) n (MPa) m Aluminium 1.63 51 0.10 53 5.7 Copper 0.65 51 0.07 211 9.8 Titanium 0.79 29 0.16 173 9.6 370 2.57
Table 3: Results of the inverse problem resolution for the tree materials.
• Discussion:
The mean relative differences between identified constitutive law and the experimental curve for the aluminium, the copper and the titanium are respectively equal to 4.6%, 6.8% and 3%. These results show that the identified laws are in good agreement with experimental tensile test results. Nevertheless, the experimental investigations of the imprint’s shape shows a slight difference between experimental and simulated pile-up. The maximum height differs from about 25%. In the next section we use pile-up information to enhance the identification procedure.
0 0.05 0.1 0.15 0.2 0 50 100 150 Indentation depth(mm) L o a d ( N )
Experimental indentation curve Best Monte-Carlo simulation Best Levenberg-Marquardt simulation
0 0.05 0.1 0.15 0.2 0.25 0 20 40 60 80 100 120 140 True strain T ru e s tr e s s ( M P a )
Experimental tensile curve Identified Ramberg-Osgood law
0 0.02 0.04 0.06 0 50 100 150 200 250 300 350 True strain T ru e s tr e s ( M P a )
Experimental tensile curve Identified Ramberg-Osgood law
0 0.1 0.2 0.3 0 100 200 300 400 500 True strain T ru e s tr e s s ( M P a )
3.
Pile-up influence on the identification
For this study, we focused on the aluminium because Ramberg-Osgood law is simpler than the Rasmussen one and unlike the copper it shows great elongation at break and notable hardening. Some authors already use data extracted from pile-up after the unloading as an additional information in order to approximate more accurately the elastic-plastic behaviour like topography of the surface around the imprint [17, 6] or the maximum pile-up height as additional data [18, 16].
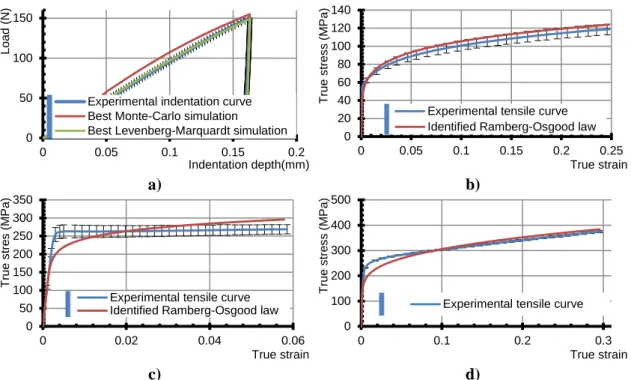
In order to measure various quantity from the pile-up, the topography of the imprint have been measured after unloading using an optical interferometer. Optical technology measurement allows to get a three dimensional information around the imprint, but because of the great slope into the imprint, the information cannot be measured here as shown in Figure 4. Moreover, the determination of the initial plan is also difficult due to the roughness of the surface.
Figure 4: Profile of an imprint measured with an optical interferometer on aluminium.
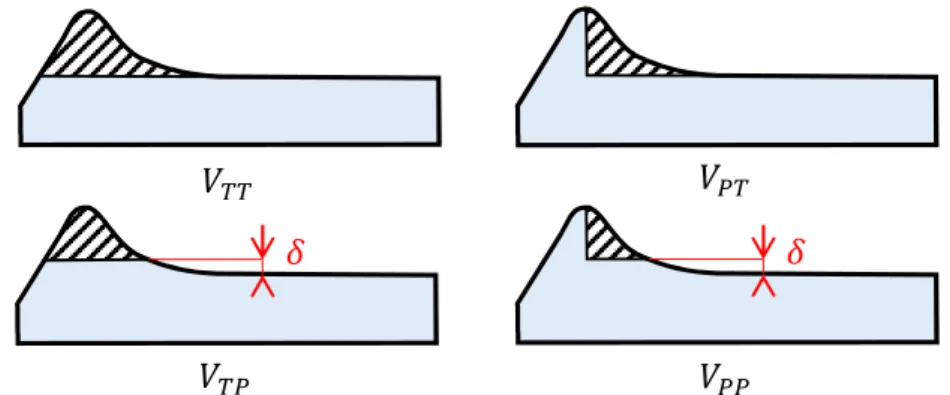
The simpler quantity to measure which is representative of the pile-up is its the maximum height ℎ*WK. The pile-up volume seems to be also representative of the pile-up, but the missing
part in the middle of the imprint and the determination of the initial plan makes difficult a precise measurement of the pile-up volume. In order to overcome this difficulty we defined 4 different strategies for measuring the volume of pile-up which are summarized in Figure 5. For the total-total volume \]], all the volume is measured and the non-measured part into the imprint is
neglected. The total-partial volume \]H is measured between the maximum height and 80% of
the maximum height. The beginning of the measurement of the partial-total volume \H] is the
abscissa of the maximum height and the partial-partial volume \HH is calculated between the
abscissa of the maximum height and 80% of the maximum height.
Figure 5: The different strategies for measuring the volume of the pile-up.
0 5 10 15 20 25 30 -2 -1 0 1 2 H e ig h t (µ m )
Position along the imprint (mm)
\]] \H]
\]H ^
\HH ^
3.1. Sensitivity study
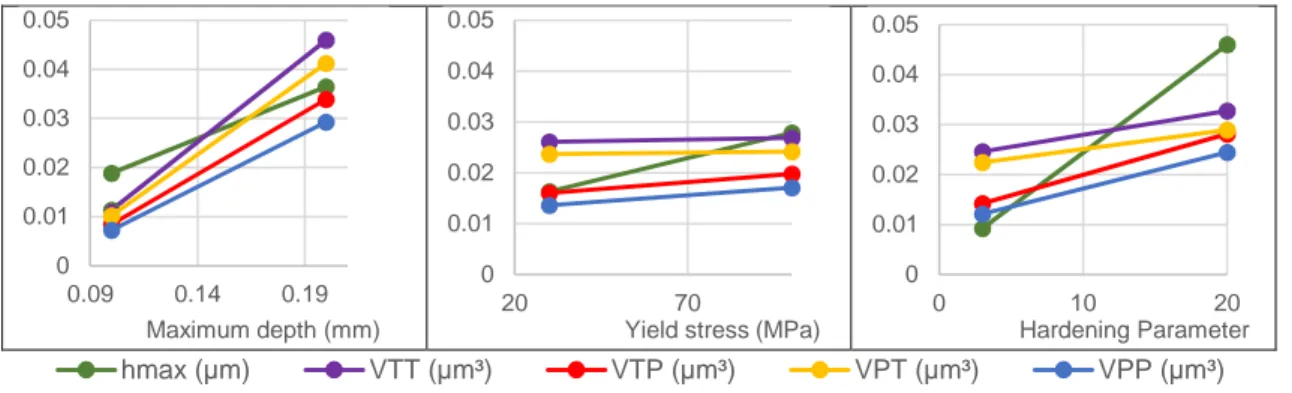
In order to determine which of the pile-up parameters it is efficient to add to solve the identification problem, we performed a numerical sensitivity study according to a 2 design of experience (DoE). The factors of the DoE are the maximum indentation depth, the yield stress
. and the hardening parameter !. Their values are respectively _0.1, 0.2`mm _30, 100`MPa and
_3,20`.
The responses are ℎ*WK, \]], \]H, \H] and \HH, Figure 6 shows the result of the DoE. It can be noticed that the maximum height ℎ*WK is quite sensitive to the material parameters whereas the volumes are very sensitive to the indentation depth but less to the hardening parameter and the yield stress. Indentation test indeed introduces plastic strain which occurs with a constant volume. Thus, the volume of pile-up is mainly driven by the indentation depth and is linked to the volume of the tip penetrating into the material. The use of pile-up volume as an extra information to resolve our inverse problem is then not relevant. The better way seems to use the maximum height of pile-up.
Figure 6: Results of the 2 DoE. 3.2. Identification with maximum pile-up height
An identification has been achieved using the maximum pile-up height. The experimental measure of ℎ*WK has been used and the difference vector has been defined as:
=><? = @A1><?, . . . , AC><?, … , A ><?, D1><?, … , DC><?, … , D ><?, a1><?, … , aC><?, … , a ><?E ( 8 ) where AC><? = FGHI 4J>K?LH IMNO HIMNO , DC><? = F* HPQN4J I>K?LHPQNMNOI
HPQNMNOI and aC><? = Fc
dPQN4J I>K?LdPQNMNOI dPQNMNOI . The
values of FG, F* and Fc are respectively 1, 1 and 2. The cost function X(<) is also defined as the Euclidean norm of =(<).
• Results and discussion:
The final value of the cost function is 0.39 which is higher than the one without taking into account
ℎ*WK into the cost function. The identified . and ! parameters of the Ramberg-Osgood are respectively 42 and 4.3 and the mean relative difference between the experimental tensile curve and the identified Ramberg-Osgood law is 6.3%. This difference is twice the difference of the identification without taking the pile-up maximum height into account.
The difference between the experimental and simulated ℎ*WK is 7.82 × 10Lf which is really low. On the other hand, the difference between the experimental and simulated curve is much higher than the one without taking pile-up into account and the shape of the indentation curve are also more different.
0 0.01 0.02 0.03 0.04 0.05 0.09 0.14 0.19 Maximum depth (mm) 0 0.01 0.02 0.03 0.04 0.05 20 70
Yield stress (MPa) 0 0.01 0.02 0.03 0.04 0.05 0 10 20 Hardening Parameter 50 hmax (µm) VTT (µm³) VTP (µm³) VPT (µm³) VPP (µm³)
4.
Conclusion
In this paper, a methodology to identify elastic-plastic constitutive law of metallic materials using inverse method with spherical indentation and FEM is proposed. Three materials have been tested and the results seems to be in good agreement with the reference tensile tests. Furthermore, topography measurement of the surrounding of the imprint were performed and we investigated which information about pile-up the most relevant information is the most relevant to use in the identification procedure in order to get more accurate results. It appears that the parameter which is the most sensitive to the material parameters is the maximum height of pile-up whereas the information about pile-up volume are mainly linked to the indentation depth. The maximum height of pile-up has been introduced into the identification procedure and used to identify the mechanical properties of aluminium. However the results of the identification shows that the identified behaviour is further from the tensile tests when taking into account the pile-up maximum height. The comprehension of this phenomenon is still under investigation.
1.
References
[1] Y. Cheng and C. Cheng, Journal of Applied Physics, vol. 84, no. 3, pp. 1284-1291 (1998). [2] G. Kermouche, J. Loubet and J. Bergheau, Mechanics of Materials, vol. 40, no. 4-5, pp.
271-283 (2008).
[3] N. Ogasawara, N. Chiba and X. Chen, Scripta Materialia, vol. 54, no. 1, pp. 65-70 (2006). [4] M. Dao, N. Chollacoop, K. Van Vliet, T. Venkatesh and S. Suresh, Acta Materialia, vol.
49, no. 19, pp. 3899-3918 (2001).
[5] M. Bocciarelli and G. Bolzon, Materials Science and Engineering: A, vol. 448, no. 1--2, pp. 303-314 (2007).
[6] G. Bolzon, M. Bocciarelli and E. Chiarullo, in NanoScience and Technology, B. Bhushan and H. Fuchs, Eds., Springer Berlin Heidelberg (2009).
[7] L. Dowhan, A. Wymyslowski, P. Janus, M. Ekwinska and O. Wittler, Microelectronics
Reliability, vol. 51, no. 6, pp. 1046-1053 (2011).
[8] G. Rauchs and J. Bardon, Finite Elements in Analysis and Design, vol. 47, no. 7, pp. 653-667 (2011).
[9] B. Donohue, A. Ambrus and S. Kalidindi, Acta Materialia, vol. 60, no. 9, pp. 3943-3952 (2012).
[10] W. Ramberg and W. Osgood, Technical note, vol. 902, pp. 1-28 (1943).
[11] K. Rasmussen, Journal of Constructional Steel Research, vol. 59, no. 1, pp. 47-61 (2003). [12] T. Fourcade, “Etude des propriétés mécaniques de matériaux métalliques en couches
minces”, PhD thesis (2013).
[13] W. Oliver and G. Pharr, Journal of materials research, vol. 7, no. 6, pp. 1564-1583 (1992). [14] J. Bucaille, S. Stauss, E. Felder and J. Michler, Acta Materialia, vol. 51, no. 6, pp.
1663-1678, 2003.
[15] T. Nakamura, T. Wang and S. Sampath, Acta Materialia, vol. 48, no. 17, pp. 4293-4306 (2000).
[16] C. Moy, M. Bocciarelli, S. Ringer and G. Ranzi, Materials Science and Engineering, vol. A (2011).
[17] M. Bocciarelli, G. Bolzon and G. Maier, Mechanics of Materials, vol. 37, no. 8, pp. 855-868 (2005).