https://doi.org/10.4224/20393390
READ THESE TERMS AND CONDITIONS CAREFULLY BEFORE USING THIS WEBSITE. https://nrc-publications.canada.ca/eng/copyright
Vous avez des questions? Nous pouvons vous aider. Pour communiquer directement avec un auteur, consultez la première page de la revue dans laquelle son article a été publié afin de trouver ses coordonnées. Si vous n’arrivez pas à les repérer, communiquez avec nous à [email protected].
Questions? Contact the NRC Publications Archive team at
[email protected]. If you wish to email the authors directly, please see the first page of the publication for their contact information.
Archives des publications du CNRC
For the publisher’s version, please access the DOI link below./ Pour consulter la version de l’éditeur, utilisez le lien DOI ci-dessous.
Access and use of this website and the material on it are subject to the Terms and Conditions set forth at
Lighting Quality and Office Work: A Field Simulation Study
Boyce, P. R.; Veitch, J. A.; Newsham, G. R.; Myer, M.; Hunter, C. M.
https://publications-cnrc.canada.ca/fra/droits
L’accès à ce site Web et l’utilisation de son contenu sont assujettis aux conditions présentées dans le site LISEZ CES CONDITIONS ATTENTIVEMENT AVANT D’UTILISER CE SITE WEB.
NRC Publications Record / Notice d'Archives des publications de CNRC:
https://nrc-publications.canada.ca/eng/view/object/?id=3e48868b-5195-403a-82a6-4cf900efe149 https://publications-cnrc.canada.ca/fra/voir/objet/?id=3e48868b-5195-403a-82a6-4cf900efe149
Lighting Quality and Office Work:
A Field Simulation Study
Peter R. Boyce
1Jennifer A. Veitch
2Guy R. Newsham
2Michael Myer
1Claudia Hunter
1Judith H Heerwagen, Research Manager
Carol C. Jones, Project Manager
December 2003
Prepared for the U.S. Department of Energy
under Contract DE-AC06-76RL01830
1
Lighting Research Center, Rensselaer Polytechnic Institute RPI # A11106
2
National Research Council of Canada, Institute for Research in Construction NRC # B3214.1
Lighting Quality and Office Work:
A Field Simulation Study
Peter R. Boyce
1Jennifer A. Veitch
2Guy R. Newsham
2Michael Myer
1Claudia Hunter
1Judith H Heerwagen, Research Manager
Carol C. Jones, Project Manager
December 2003
Prepared for the U.S. Department of Energy
under Contract DE-AC06-76RL01830
Pacific Northwest National Laboratory
Richland, Washington 99352
1
Lighting Research Center, Rensselaer Polytechnic Institute RPI # A11106
2
National Research Council of Canada, Institute for Research in Construction NRC # B3214.1
This report was prepared as an account of work sponsored by an agency of the United States Government. Neither the United States Government nor any agency thereof, nor Battelle Memorial Institute, nor any of their employees, makes any warranty, express or implied, or assumes any legal liability or responsibility for the accuracy, completeness, or usefulness of any information, apparatus, product, or process disclosed, or represents that its use would not infringe privately owned rights. Reference herein to any specific commercial product, process, or service by trade name, trademark, manufacturer, or otherwise does not necessarily constitute or imply its endorsement,
recommendation, or favoring by the United States Government or any agency thereof, or Battelle Memorial Institute. The views and opinions of authors expressed herein do not necessarily state or reflect those of the United States Government or any agency thereof.
PACIFIC NORTHWEST NATIONAL LABORATORY
operated by
BATTELLE
for the
UNITED STATES DEPARTMENT OF ENERGY
under Contract DE-AC06-76RL01830
Printed in the United States of America Available to DOE and DOE contractors from the
Office of Scientific and Technical Information, P.O. Box 62, Oak Ridge, TN 37831-0062;
ph: (865) 576-8401 fax: (865) 576-5728 email: [email protected]
Available to the public from the National Technical Information Service, U.S. Department of Commerce, 5285 Port Royal Rd., Springfield, VA 22161
ph: (800) 553-6847 fax: (703) 605-6900 email: [email protected] online ordering: http://www.ntis.gov/ordering.htm
Lighting Quality and Office Work: A Field Simulation Study
Peter R. Boyce1, Jennifer A. Veitch2, Guy R. Newsham2, Michael Myer1, and Claudia Hunter1
1. Lighting Research Center, Rensselaer Polytechnic Institute, 21, Union Street, Troy, New York, 12180-3352
Tel: 518-687-7130; Fax: 518-687-7120 [email protected]
2. National Research Council of Canada, Institute for Research in Construction, Bldg M-24 1200 Montreal Road, Ottawa, Ontario KIA OR6, Canada
Tel: 613-993-9671 / 993-9607; Fax: 613-954-3733 [email protected] / [email protected]
A Report for the
Light Right Consortium
167 pages September 26, 2003
Executive Summary
The question this study addressed was, "Can different forms of realistic office lighting affect the performance of office work or the health and well-being of employees?" An office was furnished as a typical open plan workplace for nine workers, with perimeter windows allowing access to a view but limited daylight penetration. Two experiments were conducted. In Experiment 1, there were provisions for changing between four lighting installations:
• Base Case: A regular array of parabolic-louvered luminaires
• Best Practice: A linear system of direct / indirect luminaires, together with some wall-washing to
brighten the walls, with the same average illuminance as the Base Case
• Switching Control: The same as the Best Practice but with a moveable desk lamp having three
manually switched light outputs, allowing the individual to increase the illuminance in the work area.
• Dimming Control: Direct / indirect luminaires suspended over the center of each cubicle, together
with the wall-washing system. The direct component of each suspended luminaire could be dimmed using an interface on the occupant's computer, allowing the individual to adjust the illuminance in the work area over a wide range.
Experiment 2 contrasted two lighting installations:
• Base Case 2: A regular array of recessed prismatic luminaires
• Best Practice 2: A linear system of direct / indirect luminaires, together with some wall-washing to
brighten the walls, at an illuminance level approximately 27% lower than the Best Practice in Experiment 1.
We hypothesized that occupants would prefer, and would perform better in, the Best Practice condition compared to the Base Case, and that having control would result in a further improvement in outcomes. In addition, workstations were decorated using one of two surface reflectances, a light gray and a dark blue. This provided greater variation in vertical surface luminance, which previous research has suggested might influence responses to the luminous environment in concert with lighting system effects.
The experiments were designed to test the effects of lighting systems on performance and well-being, as well as indications of the processes that might mediate these effects. What these processes might be is indicated in the Linked Mechanisms Map (Figure ES1), which evolved from the original RFP issued by the Light Right Consortium.
Figure ES1. Linked Mechanisms Map hypothesized to link luminous conditions with health, well-being, and performance.
Both experiments collected data from temporary office workers, who were hired to work under one of the lighting installations for a complete day. During that day the participants carried out tasks involving many forms of clerical and cognitive office work, evaluations of the physical environment, and assessments of their mood. In Experiment 1, we also collected data on switching/dimming choices in the designs in which control was offered.
Experiment 1 had two parallel experimental designs:
1. A between-groups design, in which each person was randomly assigned to one of the four lighting conditions, none of which they had previously seen. A total of 181 individuals contributed data to this portion of the experiment.
2. A repeated-measures design, in which 45 individuals returned for a second day of testing under a different lighting condition. This portion of the experiment involved the Base Case and Dimming Control conditions only.
Experiment 2 had a between-groups experimental design, in which each person was randomly assigned to one of the two lighting conditions, neither of which they had previously seen. A total of 107 people participated in this experiment. Experiment 2 was an extension and partial replication of Experiment 1. The data from the two experiments were analyzed and interpreted separately. Within each experiment, comparisons between different lighting and partition reflectance conditions were analyzed using
orthogonal planned comparisons, which provide for independent tests of specific effects chosen based on the underlying theory. Multivariate analysis of variance was used for sets of measurements relating to concepts for which there were multiple dependent measures, or univariate analysis of variance when there was only one measurement relating to a concept. To examine the validity of the Linked Mechanisms Map, each link in Figure 1 was tested individually, across all lighting conditions.
Results
• Linked Mechanisms Found. For the lighting installations examined, the Linked Mechanisms Map
supports 5 conclusions, two of which involve paths that were not in the original model (see Figure ES2). The first three findings were obtained in both experiments (personal control was not a variable in Experiment 2): Personal Control Luminous Conditions Non-task Surface Brightness
Appraisal Visual Comfort Visual Capabilities Preference Mood (Affect) Competence Motivation Health and Well-Being Task Performance
1. Vision Path (Luminous Conditions Î Visual Capability Î Task Performance). Lighting and task conditions that improve visibility lead to better task performance. This extends laboratory knowledge to a more realistic setting.
2. Appraisal Path (Luminous Conditions Î Appraisal Î Preference Î Mood Î Health & Well-Being). People who are more satisfied with their lighting rate the space as more attractive, are happier, and are more comfortable and satisfied with their environment and their work. This is the first time that this complete path has been demonstrated.
3. Cross Links. The proposed linkages between the Appraisal Path and the Vision Path were not found. Visual Comfort did not predict Visual Capability; this might be because none of the lighting conditions were very uncomfortable. A similar explanation might hold for the (absent) link between Mood and Motivation.
4. Personal Control Path 1 (Personal Control Î Health & Well-Being). People with dimming control reported higher ratings of lighting quality, overall environmental satisfaction, and self-rated productivity. This does not appear to be mediated by effects on Mood.
5. Personal Control Path 2 (Personal Control Î Motivation Î Task Performance). People with dimming control showed more sustained motivation, and improved performance on a measure of attention.
• Lighting designs discriminated. The lighting designs were rated for comfort as expected from
normative data. The Base Case was considered comfortable by 71% of participants, and Base Case 2 by 69%, whereas the four better practice designs received more favorable ratings (81-91% comfortable). The highest ratings were obtained by the Dimming Control condition.
• Task characteristics, practice, and fatigue important. These effects occurred in both
experiments. Performance on a vision test was best when the targets were presented at higher contrasts and larger sizes. Transcription typing performance improved when the source text, printed on paper, was in larger print (16 pt vs. 8 pt). Performance on tasks first encountered on the testing day improved from the start to the end of the day, reflecting practice. Performance on a psychophysical reaction time task declined over the day, indicating fatigue. This confirms the sensitivity of the tasks to the known influences of visibility, practice, and fatigue.
• Current lighting practice attenuates lighting effects on performance. Complex cognitive tasks
showed no simple main effects of lighting design in either experiment. This is consistent with other short-term experiments, in which visibility was high and no condition was uncomfortable, and in which
participants might be motivated to work hard for the one day regardless of conditions. There is ambiguous evidence concerning possible interactions between lighting design and partition reflectance, particularly for direct / indirect systems.
• Control used sparingly, but effectively. When they had control, most people used it once, near the
start of the day, to choose a preferred condition. People with dimming control were particularly satisfied with their ability to achieve desired conditions. The median desktop illuminance for the people with the ability to adjust the lighting by dimming was generally lower than recommended practice, but consistent with other laboratory and field work. As mentioned above, people with dimming control showed more sustained motivation, and improved performance on a measure of attention.
Figure ES2. Linked Mechanisms Map: demonstrated linkages in Experiment 1.
Implications for Lighting Practice
• Current lighting practice (as represented by the Base Case and Base Case 2) is acceptable: levels of
comfort were high, and task performance was the same as for the fixed, Best Practice lighting designs.
• Nevertheless, there is room for improvement. The direct / indirect installations, particularly those
with individual dimming control, had even higher levels of comfort and satisfaction.
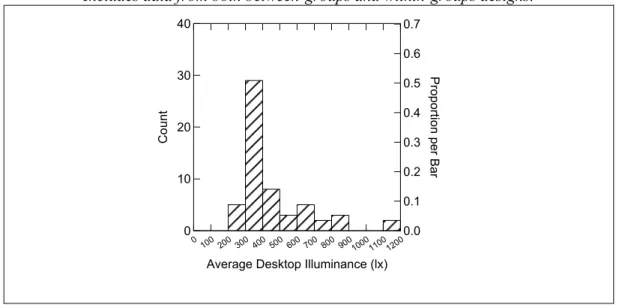
• People show a wide range of preference for illuminance (see Figure ES3). Individual overhead
dimming control as well as desktop personal control are effective means of accommodating this range.
• In addition, on average, people with dimming control chose lower illuminances than current
recommended practice. This implies that individual overhead dimming control has potential for energy savings.
• Although people on average chose lower illuminances than recommended practice, the diversity of
preferences suggests that if a fixed lower ambient illuminance is chosen it must be supplemented with desktop personal control to allow higher local illuminances for those who prefer them. (It is important to note that the illuminances people chose were in the context of an environment with high room surface brightness due to the wall washing and an indirect component on the ceilings. Illuminance preferences might differ if the room surface brightness was reduced.)
Personal Control Luminous Conditions Non-task Surface Brightness
Appraisal Visual Comfort Visual Capabilities Preference Mood (Affect) Competence Motivation Health and Well-Being Task Performance
Figure ES3. Mean desktop illuminance chosen by participants with Dimming Control. Includes data from both between-groups and within-groups designs.
Implications for Future Research
This study has implications for both future laboratory and field studies addressing the consequences of lighting design.
• Future laboratory studies should focus on specific pathways in the Linked Mechanisms Map. In
particular, testing the Linked Mechanisms Map under more extreme lighting conditions that violate common design guidelines (in order to expand the range of conditions, thereby improving the sensitivity of the test). More robust measures of motivation should also be developed in order to test the
hypothesized Mood Î Motivation Î Performance link.
• Field studies are important because they provide a more realistic context for research. Lighting is
only part of the work context, and any laboratory experiment can only simulate part of that context. Effects involving visibility occur regardless of context, but mood and motivation effects are context-dependent. Studying these effects requires collecting data from real employees doing real jobs in real organizations over periods longer than a single day. This would also allow measures of consequence to the organization, rather than just the individual, to be explored, and would allow tests of the connections between performance and well-being.
0
100200 300 400500600700 8009001000 11001200
Average Desktop Illuminance (lx) 0 10 20 30 40 C o u n t 0.0 0.1 0.2 0.3 0.4 0.5 0.6 0.7 P ro p o rti o n p e r B a r
Table of Contents
Executive Summary ... 2
Lighting Quality and Office Work: A Field Simulation Study... 12
1. Introduction... 12
2. Proposed Mechanisms ... 12
3. Method - Experiment 1 ... 13
3.1 Setting ... 13
3.2 Finishes and Furnishings... 18
3.3 Lighting Manipulations... 22 3.4 Lighting Monitoring... 23 3.5 Photometric Conditions ... 24 3.5.1 Illuminances... 24 3.5.2 Luminances ... 26 3.5.2.1 Room surfaces... 26 3.5.2.2 Computer monitor ... 26
3.6 Thermal and Acoustic Conditions... 27
3.7 Experimental Design... 27
3.7.1 Outline... 27
3.7.2 Target Sample Size ... 27
3.7.3 Participant Characteristics... 28
3.7.3.1 Between-groups experimental design ... 28
3.7.3.2 Repeated-measures participants... 29
3.8 Independent Variables ... 30
3.9 Dependent Variables... 30
3.9.1 Daily Schedule ... 30
3.9.2 Perceptions and Feelings... 31
3.9.2.1 Appraisal ... 31
3.9.2.2 Preferences... 32
3.9.2.3 Mood ... 32
3.9.2.4 Competence... 32
3.9.2.5 Health and well-being ... 32
3.9.2.6 Lighting control survey ... 33
3.9.3 Performance Measures... 33
3.9.3.1 Timed vision test... 33
3.9.3.2 Motivation... 34 3.9.3.3 Vigilance ... 34 3.9.3.4 Typing task... 34 3.9.3.5 Cognitive performance... 34 3.9.3.6 Work structure... 35 3.9.4 Social Behavior ... 35
3.9.4.1 Liking for group members ... 35
3.9.4.2 Conflict resolution... 36
3.9.4.3 Willingness to volunteer ... 36
3.10 Daily Procedure ... 36
3.11 Ethical Issues ... 37
4. Results and Discussion - Experiment 1... 38
4.1 Analytic Strategy ... 38
4.1.1 Research Design... 38
4.1.1.1 Statistical model... 38
4.1.1.3 Repeated measures design. ... 38
4.1.1.4 Non-lighting variables... 38
4.1.1.5 Interaction effects and interpretation. ... 38
4.1.1.6 Statistical versus practical significance... 39
4.1.2 Dependent Variables ... 40
4.1.3 Lighting Choices ... 40
4.1.4 Linked Mechanisms Map... 41
4.2 Manipulation Checks ... 41
4.2.1 Demographics ... 41
4.2.1.1 Between-groups design. ... 41
4.2.1.2 Repeated-measures participants... 42
4.2.2 Participant Expectancies ... 42
4.3 Perceptions and Feelings... 43
4.3.1 Lighting Appraisal ... 43
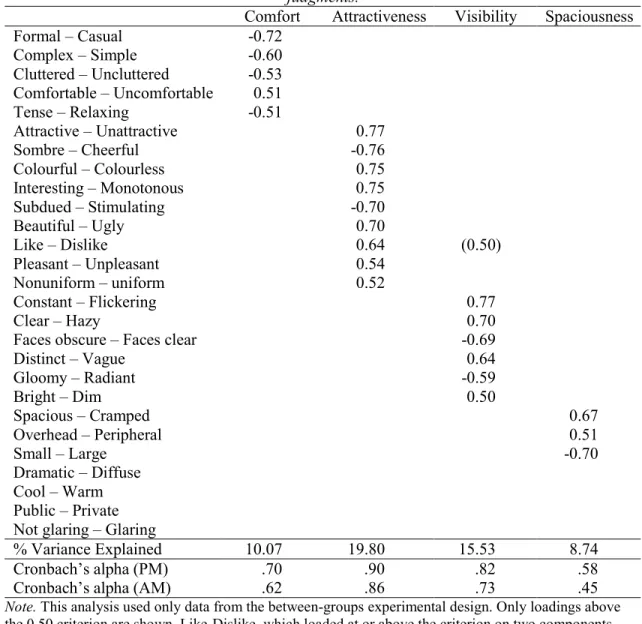
4.3.1.1 LRC’s Office Lighting Survey... 43
4.3.1.2 NRC’s lighting quality scale. ... 48
4.3.2 Preference ... 48
4.3.3 Mood ... 50
4.3.4 Competence... 51
4.3.4.1 Task competence... 51
4.3.4.2 Environmental competence... 51
4.3.5 Health & Well-Being ... 52
4.3.5.1 Satisfaction... 52
4.3.5.2 Comfort. ... 53
4.3.5.3 Task difficulty ratings. ... 54
4.3.6 Summary: Perceptions and Feelings ... 54
4.4 Performance ... 55
4.4.1 Timed Vision Test... 55
4.4.1.1 Overall contrast sensitivity... 55
4.4.1.2 Base Case versus Best Practice... 56
4.4.1.3 Best Practice versus Dimming Control. ... 58
4.4.1.4 Non-lighting effects. ... 59
4.4.2 Motivation... 61
4.4.2.1 Best Practice vs Switching Control... 61
4.4.2.2 Best Practice vs Dimming Control... 62
4.4.2.3 Non-lighting effects. ... 64
4.4.3 Vigilance ... 64
4.4.3.1 Best Practice versus Dimming Control. ... 65
4.4.3.2 Non-lighting effects. ... 66
4.4.4 Typing ... 66
4.4.4.1 Base Case vs. Best Practice... 66
4.4.4.2 Best Practice vs Best Practice + Switching Control... 69
4.4.4.3 Best Practice vs Dimming Control... 71
4.4.4.4 Reflectance effects. ... 74
4.4.4.5 Non-lighting effects. ... 77
4.4.5 Cognitive Judgments... 79
4.4.5.1 Paper-based articles... 79
4.4.5.2 Computer-based articles... 79
4.4.5.2.1 Base Case vs Dimming Control. ... 79
4.4.5.2.2 Non-lighting effects. ... 80
4.4.6.1 Speed and accuracy... 82
4.4.6.1.1 Base Case vs Best Practice... 83
4.4.6.1.2 Non-lighting effects. ... 83
4.4.6.2 Work structure... 85
4.4.6.2.1 Base Case vs Best Practice... 86
4.4.6.2.2 Best Practice vs Best Practice + Switching Control. ... 87
4.4.6.2.3 Non-lighting effects. ... 87 4.4.7 Summary: Performance... 88 4.5 Social Behavior... 89 4.5.1 Liking... 89 4.5.2 Conflict Resolution ... 89 4.5.3 Willingness to Volunteer ... 89
4.5.4 Summary: Social Behavior ... 90
4.6 Lighting Choices... 90
4.6.1 Actions and Lighting Conditions ... 90
4.6.1.1 Frequency of use. ... 90
4.6.1.2 Chosen luminous conditions. ... 91
4.6.2 Illuminance Effects on Behavioral Outcomes... 94
4.6.3 Switching/Dimming Frequency Effects... 95
4.6.4 Satisfaction with Control Mechanism... 95
4.6.5 Summary: Switching and Dimming Control... 96
4.7 Linked Mechanisms Tests... 96
4.7.1 Analytic Strategy... 96
4.7.2 Appraisal Path... 98
4.7.2.1 Median-split groups. ... 98
4.7.2.2 Appraisal Æ Preference link... 99
4.7.2.3 Preference Æ Mood link... 99
4.7.2.4 Mood Æ Health and Well-being link... 100
4.7.2.5 Mood Æ Motivation link. ... 101
4.7.2.6 Competence Æ Motivation link... 102
4.7.2.7 Motivation Æ Performance link. ... 102
4.7.2.8 Summary: appraisal path... 104
4.7.3 Vision Path... 104
4.7.3.1 Median split groups... 104
4.7.3.2 Appraisal Æ Visual Comfort link. ... 104
4.7.3.3 Visual Comfort Æ Visual Capability link. ... 105
4.7.3.4 Visual Capability Æ Competence link... 105
4.7.3.5 Visual Capability Æ Task Performance link. ... 105
4.7.3.6 Summary: vision path. ... 107
4.7.4 Exploratory Tests ... 107
4.7.4.1 Motivation Æ Health and Well-being?... 107
4.7.4.2 Satisfaction Æ Task Performance?... 107
4.7.4.3 Performance Æ Satisfaction?... 108
4.7.4.4 Mood affects Social Behavior? ... 110
4.7.5 Summary: Linked Mechanisms Tests ... 112
5. Method - Experiment 2 ... 112
5.1 Setting ... 112
5.2 Finishes and Furnishings... 112
5.3 Lighting Manipulations... 113
5.4 Lighting Monitoring... 114
5.5.1 Illuminances... 115
5.5.2 Luminances ... 116
5.5.2.1 Room surfaces... 116
5.5.2.2 Computer monitor ... 116
5.6 Thermal and Acoustic Conditions... 116
5.7 Experimental Design... 116 5.7.1 Outline... 116 5.7.2 Sample Size... 116 5.7.3. Participant Characteristics... 116 5.8 Independent Variables ... 117 5.9 Dependent Variables... 117 5.9.1 Daily Schedule ... 117
5.9.2 Perceptions and Feelings... 117
5.9.3 Performance Measures... 118 5.9.4. Social Behavior ... 118 5.10 Daily Procedure ... 118 5.11 Ethical Issues ... 118 6.0 Results - Experiment 2... 118 6.1 Manipulation Checks ... 118 6.1.1 Demographics ... 118 6.1.2 Participant Expectancies ... 118
6.2 Perceptions and Feelings... 119
6.2.1 Lighting Appraisal ... 119
6.2.1.1 LRC’s Office Lighting Survey... 119
6.2.1.2 NRC’s lighting quality scale. ... 122
6.2.2 Preference ... 122
6.2.2.1 Base Case 2 versus Best Practice 2. ... 122
6.2.2.2 Non-lighting effects. ... 124
6.2.3 Mood ... 124
6.2.4 Competence... 125
6.2.4.1 Task competence... 125
6.2.4.2 Environmental competence... 125
6.2.5 Health & Well-Being ... 125
6.2.5.1 Satisfaction... 125
6.2.5.2 Comfort. ... 125
6.2.5.3 Task difficulty ratings. ... 126
6.2.6 Summary: Perceptions and Feelings ... 126
6.3 Performance ... 127
6.3.1 Timed Vision Test... 127
6.3.1.1 Overall contrast sensitivity... 127
6.3.1.2 Base Case 2 vs Best Practice 2... 128
6.3.1.3 Non-lighting effects. ... 131
6.3.2 Motivation... 132
6.3.3 Vigilance ... 132
6.3.4 Typing ... 133
6.3.4.1 Base Case 2 vs Best Practice 2... 133
6.3.4.2 Reflectance effects. ... 135
6.3.4.3 Non-lighting effects. ... 137
6.3.5 Cognitive Judgments... 138
6.3.5.1 Paper-based articles... 138
6.3.6 Cognitive Performance ... 139
6.3.6.1 Speed and accuracy... 139
6.3.6.1.1 Base Case 2 vs Best Practice 2... 140
6.3.6.1.2 Non-lighting effects. ... 141 6.3.6.2 Work structure... 142 6.3.7 Summary: Performance... 143 6.4 Social Behavior... 144 6.4.1 Liking... 144 6.4.2 Conflict Resolution ... 144 6.4.3 Willingness to Volunteer ... 145
6.4.4 Summary: Social Behavior ... 145
6.5 Linked Mechanisms Tests... 145
6.5.1 Analytic Strategy... 145
6.5.2 Appraisal Path... 145
6.5.2.1 Median-split groups. ... 145
6.5.2.2 Appraisal Æ Preference link... 146
6.5.2.3 Preference Æ Mood link... 146
6.5.2.4 Mood Æ Health and Well-being link... 147
6.5.2.5 Mood Æ Motivation link. ... 149
6.5.2.6 Competence Æ Motivation link... 150
6.5.2.7 Motivation Æ Performance link. ... 150
6.5.2.8 Summary: appraisal path... 151
6.5.3 Vision Path... 151
6.5.3.1 Median split groups... 151
6.5.3.2 Appraisal Æ Visual Comfort link. ... 151
6.5.3.3 Visual Comfort Æ Visual Capability link. ... 152
6.5.3.4 Visual Capability Æ Competence link... 152
6.5.3.5 Visual Capability Æ Task Performance link. ... 152
6.5.3.6 Summary: vision path. ... 153
6.5.4 Exploratory Tests ... 154
6.5.4.1 Motivation Æ Health and Well-being?... 154
6.5.4.2 Satisfaction Æ Task Performance?... 154
6.5.4.3 Performance Æ Satisfaction?... 155
6.5.4.4 Mood affects Social Behavior? ... 156
6.5.5 Summary: Linked Mechanisms Tests ... 156
7. General Discussion ... 156
7.1 The Modified Linked Mechanisms Map... 156
7.2 The Importance of the Lighting Conditions for Office Work... 159
7.3 Patterns of Use of Lighting Control ... 160
7.4 Implications for Lighting Practice ... 160
7.5 The Way Ahead ... 162
8. References... 164
Lighting Quality and Office Work: A Field Simulation Study 1. Introduction
For many years studies of the optimum lighting conditions for offices were focused on maximizing visual performance and avoiding visual discomfort. The result was a steady growth in the understanding of what lighting conditions are necessary to achieve high levels of visual performance (Rea and Ouellette, 1991) and to avoid visual discomfort (Boyce, 2003). Further, lighting practice has taken this knowledge on board to such an extent that it is rare today to find offices lit in such a way that either visual
performance is limited or visual discomfort occurs. However, this should not be taken to mean that all is well in the world of office lighting. It is all too easy to find offices that are perceived to be gloomy and uninteresting. This perception has been the impetus behind the burgeoning field of lighting quality (Veitch 1998; Veitch and Newsham, 1998a, 1998b). Lighting quality means different things to different people but the one thing all agree on is that a high quality lighting installation needs to consider not just the visibility of the tasks but the appearance of the space. This report describes a study done to determine to what extent different levels of lighting quality affect the task performance of office workers, and their health and well-being.
The approach adopted to address this question is that of a field simulation study. Two separate field simulation experiments have been conducted. In both experiments, "Best Practice" office lighting design conditions have been compared with a "Base Case" lighting condition representative of modern office lighting practice. The comparison is done in terms of office workers' task performance and feelings of health and well-being, over a complete working day. The "Best Practice" lighting conditions used enhanced non-task surface brightness and gave people different levels of control of the luminaires associated with their own workspace. The office workers who experienced the lighting conditions were temporary office workers, with no expert knowledge of lighting. The tasks examined were representative of those done in a modern office, but with an emphasis on knowledge-based tasks.
This approach has two major advantages. The first is that it has a high level of external validity. It uses a real office and real office workers experiencing a number of realistic lighting conditions while doing a wide range of realistic tasks. The second is that it is cost-effective, in that it provides a sensitive test of whether lighting conditions can have an effect on the task performance and/or health and well-being of office workers, even when all the task details are highly visible and visual discomfort is absent. The approach is sensitive because it tests the combined effects of several different mechanisms that may influence task performance and health and well-being and that are influenced by lighting conditions. If a significant effect of the lighting conditions is found, then the effectiveness of the individual mechanisms can be tested to determine their relative importance. If no significant effect of the lighting conditions is found, then it is unlikely that the individual mechanisms are significant - a conclusion that would have taken much longer and much more money to reach using an approach that studied one mechanism at a time.
2. Proposed Mechanisms
Wyon (1996) introduced the concept of a linked mechanisms map as a guide to well-conducted research projects that aim to provide useful practical guidance. They provide a rational basis for answering the question "Why do you expect your independent variable to affect your dependent variables?" Figure 1 shows the linked mechanisms map that sets out the mechanisms by which it is believed that surface brightness and personal control may improve task performance and enhance feelings of health and well-being.
Figure 1. Linked Mechanisms Map hypothesized to link luminous conditions with health, well-being, and performance.
The rationale behind this linked mechanisms map is as follows:
• Changing the luminous conditions in an office can immediately affect office workers in three ways;
by changing visual capability (Rea & Ouellette, 1991); by changing visual comfort (Wibom & Carlsson, 1987); and, by changing the perception (appraisal) of the conditions (Flynn, Hendrick, Spencer, & Martyniuk, 1979).
• These three aspects interact over time. For example, luminous conditions that cause visual
discomfort or distraction, over time, will affect visual capability and the appraisal of the conditions. Similarly, luminous conditions that limit visual capability will, over time, affect visual comfort.
• Visual capability has a direct effect on task performance (e.g., Eklund, Boyce, & Simpson, 2000,
2001). They also affect the perception of competence to do the task and hence the motivation to do the task.
• Visual comfort has a direct effect on mood and, through mood, an effect on feelings of health and
well-being (although it could also be considered a form of well-being in itself).
• As for the appraisal of the lighting conditions, these are evaluated against expectations to determine
whether the office worker likes or dislikes the luminous conditions (preference) and this, in turn, leads to an effect on mood (Baron, Rea, & Daniels, 1992; Newsham & Veitch, 2001).
• Mood, itself, directly affects feelings of health and well-being. Mood and the perception of
competence together affect the motivation to do the task and hence task performance (Bandura, 1982; Baron et al. 1992).
• Finally, giving an office worker personal control directly affects their mood and feelings of
competence to do the task, even if the control is little used (Barnes, 1981; Becker, 1986).
This study has been designed around this Linked Mechanisms Map (Figure 1). Measurements taken will allow all the elements in the map to be measured, using established methods or at least methods that have been used before.
3. Method - Experiment 1 3.1 Setting
The setting for the study was a Class C construction office building in downtown Albany, New York
(Figure 2). Figure 3 shows a plan of the 239 m2 (2,573 ft2), air-conditioned, second floor office used. On
entering the office from the elevator, the participant faced an array of nine office cubicles, arranged in
Personal Control Luminous Conditions Non-task Surface Brightness
Appraisal Visual Comfort Visual Capabilities Preference Mood (Affect) Competence Motivation Health and Well-Being Task Performance
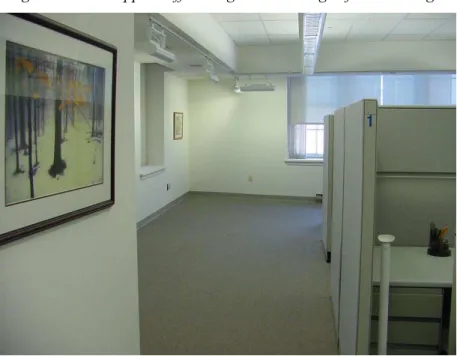
three groups of three, four, and two (Figure 4). Turning to the left, the participant saw a reception desk and sofa (Figure 5), while a turn to the right revealed a long tapering hallway leading to a break area furnished with tables and chairs (Figure 6). There were a number of rooms off this open area. Starting from the elevator they were two restrooms, a kitchen, a large storage room, a janitors room, a large office, another storage room, a conference room (Figure 7) and a small room used for visual screening.
Participants had access to the restrooms, the kitchen, the cubicle area, the hallway and the conference room. Of these areas, there were rectangular windows in the cubicle area, the conference room, and the end of the hallway. The positions of these windows are marked by letter in Figure 3. The dimensions of the windows, identified by letter, are given in Table 1.
The view through windows A to D, i.e., to the west, was of a small dark atrium. The view through windows E, F, G, H and I, i.e., to the north, were of a similar brick building some 10.7 m (35.1 ft) away across a pedestrian passage. The view through window J, i.e., to the east, was of some small buildings, the embankment of an interstate highway and the sky. Windows E and G were fitted with both vertical blinds and a perforated roller blind. Windows B, C, D, F, H, I, and J were fitted with vertical blinds. Both types of blinds were beige in color, the vertical blind having a reflectance of 0.56 and a transmittance of 0.21, the roller blind having a reflectance of 0.51 and a transmittance of 0.06.
By adjusting the position of the blinds on each window, the view of the sky from almost all of the cubicle area was eliminated, the amount of daylight entering the cubicle area was limited, yet a view out was preserved. For windows B, C, D, H and I, the vertical blinds were drawn across and slanted at 45 degrees. For window J, the vertical blinds were drawn back. For windows E and G the vertical and roller blinds were set so that the open part of the window started at sill height and was symmetrical about the vertical centerline of the window. For window F, the roller blind was pulled down to cut off the top part of the window. The actual dimensions and the effective dimensions of windows E, F, and G used throughout the experiment are given in Table 2.
Figure 3. A plan of the 239 m2 (2,573 ft2), second floor office used.
Figure 5. The reception area.
Figure 7. The conference room.
Table 1. Window positions and sizes
Identification letter Location Sill height (m) Window width (m) Window height (m) Blinds A West wall, reception desk 0.82 1.35 2.18 None B West wall, cubicle area 0.82 1.35 2.18 Vertical C West wall, cubicle area 0.82 1.35 2.18 Vertical D West wall, cubicle area 0.82 1.35 2.18 Vertical E North wall, cubicle area 0.82 3.63 2.13 Vertical and roller F North wall, cubicle area 1.37 0.76 1.63 Roller G North wall, cubicle area 0.84 1.24 2.13 Vertical and roller H North wall, conference room 0.89 1.07 1.32 Vertical I North wall, conference room 0.89 1.07 1.32 Vertical J East wall, break area 0.89 2.28 2.08 Vertical
Table 2. Blind positions for windows E, F, and G. Identification letter Sill height (m) Window width without blinds (m) Window height without blinds (m) Window width with blinds (m) Window height with blinds (m) E 0.82 3.63 2.13 2.89 1.04 F 1.37 0.76 1.63 0.76 0.58 G 0.84 1.24 2.13 0.91 1.55
3.2 Finishes and Furnishings
The ceilings throughout the office were suspended T bar carrying 600 mm by 1,200 mm (2 ft by 4 ft) fiber ceiling tiles with a reflectance of 0.88. In the open area, this ceiling was 2.90 m (9.5 ft) above the floor. However, the ceiling was interrupted by a series of enclosed structural beams whose underside was 2.75 m (9.0 ft) above the floor, and there was a 0.63 m (20.7 in) wide dropped soffit along the north edge of the building, whose underside was 2.44 m (8.0 ft) above the floor (see Figure 8). These features were painted flat white and had a reflectance of 0.88. In the conference room, the soffit and ceiling tiles were arranged so as to form a long elevated rectangular section above the conference table (see Figure 7). The height of the raised ceiling area was 2.75 m (9.0 ft) above floor level, while the height of the rest of the ceiling was 2.44 m (8.0 ft) above floor level.
The walls throughout the office were sheetrock with the exception of a small area near the reception desk which was painted brick. All these surfaces were painted flat white with a reflectance of 0.73.
The floor throughout the office was carpeted. The carpet was gray in color, with a reflectance of 0.20.
The cubicles were square in plan, the actual dimensions being 2.28 m by 2.28 m (7.5 ft by 7.5 ft). The height of the panels forming the cubicles were either1.67 m (66 in) or 1.37 m (54 in). Half the wall area of the cubicles had the 1.67 m height and half the 1.37 m height. Centered on the corner of the cubicle directly opposite the entrance to each cubicle was an L-shaped gray work surface. This work surface was positioned 0.75 m (29.5 in) above the floor. The work surface extended the full length of the two panels it was adjacent to (see Figure 9).
Above one arm of the L was a 0.40 m by 1.14 m (15.7 in by 44.9 in) filing bin, the bottom of which was mounted 0.48 m (18.9 in) above the work surface. A bare T5HO fluorescent lamp was recessed under the filing bin close to the panel. This lamp was mechanically filtered using electrical tape to limit its light output. The purpose of this lamp was to soften any shadows that were cast by the filing bin on the work surface. This lamp was on at all times. It produced an illuminance of 40 lx at the edge of the work surface opposite the center of the lamp, 100 lx on the work surface directly under the front of the filing bin, and 250 lx on the work surface directly under the lamp.
A 17 inch computer monitor was positioned at the angle of the L-shaped work surface, with the CPU on the floor below the work surface and the keyboard and mouse resting on a retractable shelf that could be pulled out and raised over a limited range as desired by the user. On one side of the monitor was a document holder, angled so as to place a sheet of paper in the document holder in a similar plane as the screen of the computer monitor. The location of the monitor on the desk was fixed, as was that of the document holder except that this latter could be positioned in one of two symmetric positions to the left or right of the monitor, as desired by the participant.
Completing the furnishing in each cubicle was a wheeled and padded chair of adjustable seat height, adjustable back position, and adjustable arm location.
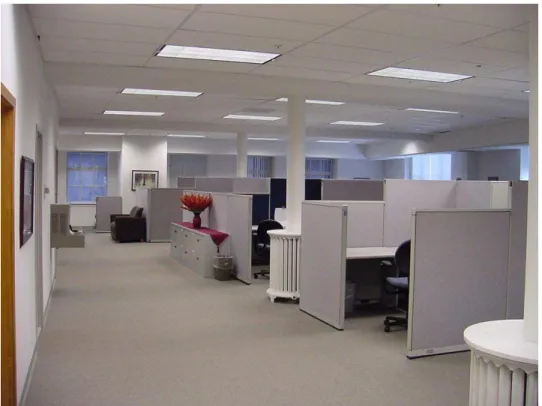
The fabric finishes of the panels forming the cubicles were either gray with a reflectance of 0.30 or dark blue with a reflectance of 0.05 (see Figure 10). In five cubicles, all the panels had the gray finish. In two others, all the panels had the dark blue finish. In yet two others, three panels had the dark blue finish and the one containing the entrance to the cubicle had the gray finish. In all cubicles, the work surface and the filing bin were metal painted gray with a reflectance of 0.52. In all cubicles, the chair seats and backs
were blue fabric with a reflectance of 0.11, while the rest of the chair was of black plastic with a reflectance of 0.04.
As for the conference room, this was furnished with a long mahogany table and a mahogany credenza, both of reflectance 0.12. Around the conference table were chairs with red seats and backs with a reflectance of 0.05, the rest of the chairs being black plastic with a reflectance of 0.03.
The only significant furnishing in the hallway area were two sets of four filing draws, arranged between the columns (see Figure 6). The filing draws were arranged back to back to form a 0.91m square in plan with a height of 0.75 m. The top of the units was covered with a mahogany panel of reflectance 0.11. The sides were painted light gray with a reflectance of 0.42.
A variety of paintings were hung on the walls of the office and various decorative items were placed on non-working surfaces to provide some visual interest (see Figures 5, 6, and 10).
Figure 8. The dropped soffit along the north edge of the building.
Figure 10. General view of workstations showing different fabric reflectances, and decorative elements external to workstations, and Lighting Design 1 (Base Case).
Figure 12. Conference Room, Lighting Design 2 (Best Practice).
Figure 14. General view of workstations, Lighting Design 4 (Dimming Control).
3.3 Lighting Manipulations
Four different lighting installations were used in this study. The four lighting installations were all designed to be representative of current office lighting practice. A check on the how well this objective was achieved was made by having a panel of experienced lighting designers visit the office and evaluate the design. The panel consisted of James Benya (Benya Lighting Design), Naomi Miller (Naomi Miller Lighting Design), and Michael White (Johnson Controls). At the time of their visit, the office was fully furnished but with different areas lit using the different lighting installations. After discussion and some minor modifications the panel agreed that the four lighting installations were all representative of current office lighting practice.
The four lighting installations were:
1. Base Case: This installation was designed to represent the most common approach to office lighting in use today. It was designed to meet the minimum requirements for office lighting as set out in the IESNA/ANSI Standard guide to office lighting (RP-1-1993) (IESNA, 1993). It consisted of a regular array of three lamp, 18 cell, 3 inch deep, semi-specular, parabolic-louvered luminaires, mounted on 8 ft by 10 ft centers in the suspended ceiling (Figure 10). Each luminaire contained three T8, 32W,
fluorescent lamps of correlated color temperature (CCT) of 3,500K and a CIE General Color Rendering Index (CRI) of 82. These three fluorescent lamps were operated from an electronic dimming ballast. This installation provides an adequate illuminance on the working plane but tends to produce dark walls and ceilings. Its strongly downward directional light distribution also tends to produce shadows and veiling reflections. This lighting was installed throughout the space. Only the areas that the participants
frequently used during the experiment, i.e., cubicle area, hallway and conference room, were changed to other lighting systems during the experiment. Other areas i.e., restrooms, kitchen, storage rooms, research office, and vision screening room, were lit by this installation throughout the experiment.
2. Best Practice: This installation was designed to provide a similar illuminance on the working plane as the Base Case installation but also to produce brighter walls and ceiling and to reduce shadows and veiling reflections. The part of the office containing the cubicles was lit by five runs of continuous
direct / indirect luminaires suspended 16 inches below the ceiling (Figure 11). Each luminaire was either eight feet or four feet long; the eight foot luminaire containing two four foot, 54W, T5 high output fluorescent lamps, while the four foot luminaire contained only one of these lamps. All these lamps had a CCT of 3,500K and a CRI of 85. All these lamps were controlled by electronic dimming ballasts.
The north and west walls of the area containing the cubicles were illuminated by a wall-washing system using track-mounted linear luminaires, each luminaire containing one 50W 24 inch twin tube compact fluorescent lamp. These lamps have a CCT of 3,500K and a CRI of 82. The track on which these luminaries were mounted was set 3 feet in from the wall. The luminaires were positioned so as to light significant areas of the wall, i.e., areas with paintings but not windows (Figure 8). All these lamps were controlled by electronic dimming ballasts.
The hallway area was lit by three sets of four, 8 feet long indirect luminaires, arranged in a rectangle, and suspended 16 inches from the ceiling (Figure 6). Each luminaire contains two 54W, T5, high output fluorescent lamps, each with a CCT of 3,500K and a CRI of 85. All these lamps were controlled by electronic dimming ballasts.
The conference room was lit by two, 8 foot, direct / indirect luminaires, arranged above the long axis of the table. These luminaires were the same as those used in the cubicle area and contained the same lamps and ballasts (see Figures 7 and 12). The walls of the conference room were lit by five track mounted luminaires of the same type, with the same lamp and ballast as were used in the cubicle area.
3. Best Practice with Switching Control: In this installation, the lighting of the hallway and conference room was the same as in the Best Practice lighting. In the cubicle area, the ambient lighting (including wall-washing on the perimeter walls) was the same as for the Best Practice installation but, in addition, each cubicle was fitted with a free-standing desk lamp with a luminous shade placed on the unobstructed work surface (Figure 13). The desk lamp was a model. Each desk lamp contained one 40W 2D compact fluorescent lamp which could be mechanically switched to three different light outputs, equivalent to 11W, 19W and 35W. This lamp has a CCT of 3,500K and a CRI of 82. Moving and switching this desk lamp provides an element of control to the lighting of the cubicle.
4. Dimming Control: For this installation, the lighting of the hallway and conference room was the same as in the Best Practice installation. In the cubicle area, the wall-washing was also the same as in the Best Practice installation,. However, suspended above the center of each cubicle was one modified four foot, direct / indirect luminaire (Figure 14). Each of these luminaires contained three 54W T5HO fluorescent lamps with a CCT of 3,500K and a CRI of 85. The modification (made by the manufacturer for this experiment) was an opaque baffle that separated the three lamps so that one contributed only to the indirect component, while the other two could contribute to both the direct and indirect component but primarily the direct component. The light output of the lamp that contributed only to the indirect
component was fixed, but the light output of the other two lamps could be dimmed from zero to full light output from the computer in the cubicle using a simple on-screen interface.
As for the area between the cubicles and the elevator, this was lit by thirteen compact fluorescent downlights (Figure 14), each luminaire containing a four-pin, 32W triple tube compact fluorescent lamp of CCT of 3,500 K and CRI of 82. In addition, two desk lamps, each fitted with one 40W, 2D compact fluorescent lamp which could be mechanically switched to three different light outputs, equivalent to 11W, 19W and 35W, were placed on the small filing cabinets near the cubicles (see Figure 14). For this application the middle, 19 W setting was used.
3.4 Lighting Monitoring
All the lighting installations, with the exception of the direct / indirect luminaires centered over each cubicle in the Dimming Control lighting installation, were operated through one lighting control system. This system allowed the luminaires forming the installation to be put into functional groups, e.g., for the Best Practice installation, the direct / indirect luminaires over the cubicle area formed one functional group and the wall washing luminaires formed another. Each functional group could be dimmed as desired. Further, the power demand for each functional group of luminaires was recorded every five
minutes. This is particularly useful for monitoring the use of the individual desk lamps in the Best Practice with Switching Control installation.
The direct / indirect luminaires suspended over the center of each cubicle in the Dimming Control lighting installation were operated through a separate control network proprietary to the manufacturer. This network provided the occupant of the cubicle with a simple interface displayed on the monitor to control the light output of the two lamps in the luminaire over the cubicle that contributed to the direct and indirect components. It also recorded the time, magnitude and direction of any changes made. 3.5 Photometric Conditions
3.5.1 Illuminances
Table 3 shows the mean illuminances provided by the four lighting installations on the work surface, on the monitor screen, on the keyboard, and at the participant's eyes, in the cubicles with the gray and navy blue panels. Where there is some degree of control of light output, two average illuminances are given, reflecting the range of illuminances possible. For the Best Practice with Switching Control
lighting, the range covers from the desk lamp being switched off to the desk lamp at full light output. For the Dimming Control installation, the range covers from the direct / indirect luminaire at minimum light output to maximum light output.
Table 3. Means of the illuminances (lx) provided on the work surface, on the monitor, on the keyboard, and at the participant's eye, by the four lighting installations in the cubicles with the gray and dark blue
panels.
Lighting installation and panel type
Illuminance on work surface (lx) Illuminance on monitor (lx) Illuminance on keyboard (lx) Illuminance at participant's eye (lx) Base Case Gray Blue 611 558 364 338 697 640 313 288 Best Practice Gray Blue 601 528 426 378 649 544 341 316 Best Practice with
Switching Control Gray Blue 528 - 1199 473 - 1140 371 - 447 344 - 438 599 - 764 539 - 740 295 - 422 264 - 335 Dimming Control Gray Blue 285 - 1032 276 - 1048 166 - 852 188 - 873 269 - 1156 283 - 1151 171 - 578 181 - 588 To indicate the contribution of daylight to these illuminances, Table 4 gives the mean illuminances on the work surfaces of the cubicles with gray and dark blue panels measured at noon on a sunny day with all the electric lighting turned off. From Table 4 it can be seen that the contribution of daylight to the measured illuminances given in Table 3 is modest.
Table 4. Means (and standard deviations) of the illuminances (lx) provided on the work surface by daylight alone. Lighting installation and panel Illuminance on work surface (lx) Illuminance on monitor (lx) Illuminance on keyboard (lx) Illuminance at participant's eye (lx) Daylight only Gray 19.8 (24.9) 18.8 (22.6) 22.2 (22.6) 18.2 (11.9) Daylight only Blue 16.5 (9.4) 27.5 (24.9) 25.3 (18.1) 14.0 (1.4)
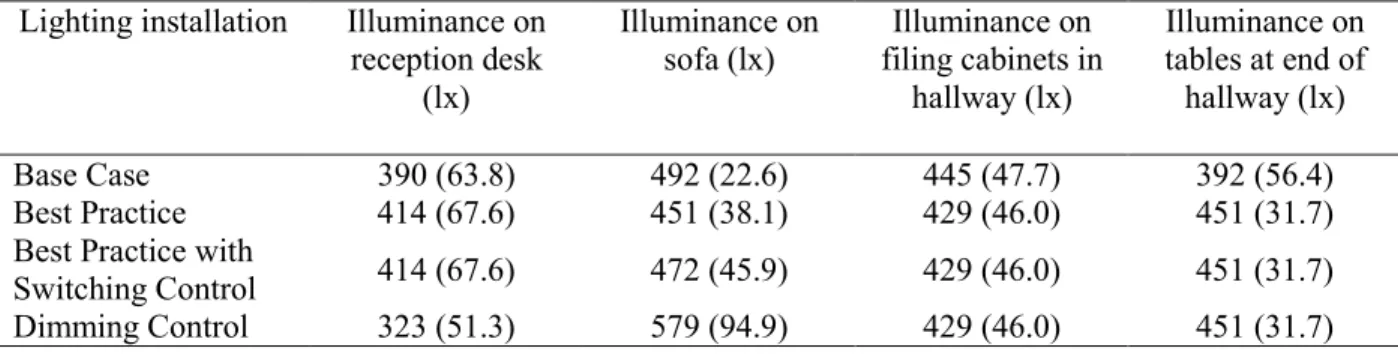
Illuminances were also measured at other salient locations in the space, i.e., the reception desk, the sofa near the reception desk, on the filing cabinets in the hallway, and on the tables at the end of the hall way that were used for meeting.
Table 5 shows the mean illuminances provided by the four lighting installations at these locations.
Table 5. Means (and standard deviations) of the illuminances (lx) provided on the reception desk, on the sofa near the reception desk, on the filing cabinets in the hallway, and on the tables at the end of the
hallway, by the four lighting installations.
Lighting installation Illuminance on
reception desk (lx) Illuminance on sofa (lx) Illuminance on filing cabinets in hallway (lx) Illuminance on tables at end of hallway (lx) Base Case 390 (63.8) 492 (22.6) 445 (47.7) 392 (56.4) Best Practice 414 (67.6) 451 (38.1) 429 (46.0) 451 (31.7)
Best Practice with
Switching Control 414 (67.6) 472 (45.9) 429 (46.0) 451 (31.7)
Dimming Control 323 (51.3) 579 (94.9) 429 (46.0) 451 (31.7)
For the Best practice with Switching Control installation, the illuminance on the work surface, on the monitor screen, on the keyboard and at the participant's eyes varied as the desk lamp wattage is switched. Table 6 shows the mean illuminances measured at these locations for the three setting of the desk lamp wattage in the cubicles with the two panel types.
Table 6. Means (and standard deviations) of the illuminances (lx) provided on the work surface, on the monitor, on the keyboard, and at the participant's eyes, by the three wattage levels of the desk lamp used
in the Best practice with switching control installation, for the gray and dark blue cubicles.
Desk lamp wattage (W) and panel Illuminance on work surface (lx) Illuminance on monitor (lx) Illuminance on keyboard (lx) Illuminance at participant's eye (lx) 13 W Gray Blue 867 (58.1) 740 (72.7) 387 (66.5) 408 (81.8) 612 (56.0) 597 (76.8) 323 (39.9) 301 (45.9) 26 W Gray Blue 1420 (179.7) 1215 (118.2) 403 (38.1) 383 (68.7) 681 (23.4) 657 (72.3) 353 (17.4) 302 (32.1) 37W Gray Blue 2356 (284.0) 2248 (186.3) 447 (52.4) 438 (99.2) 764 (18.3) 740 (80.0) 422 (26.0) 335 (20.9)
For the Dimming Control installation, the illuminance on the work surface, on the monitor screen, on the keyboard and at the participant's eyes varied as the direct component of the lighting was dimmed. Table 7 shows the mean illuminances measured at these locations for three setting of the dimming control, for the cubicles with the gray and dark blue panels. One other aspect of the Dimming Control installation is the effect on adjacent cubicle when the direct component of the luminaire suspended directly above a cubicle is altered. To measure the contribution to an adjacent cubicle, the increase in illuminance on the work surface in one cubicle when the indirect component of the luminaire over the adjacent cubicle was varied from zero light output to 100% light output was measured. The mean increase in illuminance was 85 lx .
As for the conference room, the illuminance on the table in front of each chair and on the faces of people sitting in each chair were measured. The mean illuminances for the two lighting installations used in the conference room are given in Table 8.
Table 7. Means (and standard deviations) of the illuminances (lx) provided on the work surface, on the monitor, on the keyboard, and at the participant's eyes, at three dimming levels of the Dimming Control
installation, for the gray and dark blue cubicles.
Dimmer Setting (%) and panel Illuminance on work surface (lx) Illuminance on monitor (lx) Illuminance on keyboard (lx) Illuminance at participant's eye (lx) 0% Gray Blue 279 (35.3) 300 (27.1) 166 (16.3) 181 (32.1) 270 (34.4) 283 (12.8) 171 (21.7) 181 (32.1) 50% Gray Blue 358 (48.9) 378 (23.7) 244 (22.2) 263 (40.1) 368 (39.6) 377 (22.0) 215 (43.3) 218 (12.1) 100% Gray Blue 945 (88.7) 964 (59.7) 853 (64.5) 874 (116.2) 1151 (49.5) 1156 (32.0) 588 (96.9) 579 (66.8)
Table 8. Means (and standard deviations) of the illuminances (lx) provided on the conference room table, and at the eyes of participants sitting around the table, for the two lighting installations used in the
conference room. Lighting installation Illuminance on table (lx) Illuminance at participant's eye (lx) Base Case 522 (37.2) 365 (52.3) Best Practice 687 (43.5) 538 (58.7) 3.5.2 Luminances 3.5.2.1 Room surfaces
The luminances of the all the surfaces in the cubicle area, the hallway and the conference room, under each lighting installation, were measured using a Radiant Imaging 2610 digital imaging photometer, and the appearance of the space was recorded with a Sony Mavica FD92 digital camera.
3.5.2.2 Computer monitor
The computer monitors used extensively throughout the study were all set up to have a similar background color. The screen luminance of a blank white screen display, in the absence of any lighting in
3.6 Thermal and Acoustic Conditions
The air temperature and relative humidity conditions provided by the air-conditioning in the office were typical of offices and showed little variation over the time of the experiment The sound pressure levels occurring in the office were less than 50 dB(A). Such sound pressure levels are typical of a quiet office.
3.7 Experimental Design 3.7.1 Outline
There were two independent variables for the experiment, one being the four different lighting installations; the other being the two reflectances of the panels forming the background to the computer in the cubicle. (Although the panels also differed in color, we know of no reason why this color difference would be expected to influence any of the behavioral outcomes.)
The experimental design involved two experiments in one. One, called the between-groups experiment, collected data from every participant once only. The other, called the repeated measures experiment, exposed the same participants to two lighting conditions on separate occasions. The
advantage of the between-groups approach is that the sample is larger and, therefore, is more likely to be representative of the population. It also reduces any bias due to hypothesis-guessing or to asymmetric transfer of training or mood that can occur under the repeated measures approach. The disadvantage of the between-groups approach is that more participants are required to achieve equal sensitivity to the repeated measures approach because the individual differences between participants cannot be removed from the variability. In the repeated measures approach each participant acts as their own control, so the differences between individuals can be removed from the variability, thereby increasing the sensitivity for the same number of participants.
The experimental design is shown schematically in Table 9. By using both approaches, this experimental design provided a partial replication of the experiment. Replication is important in persuading people about the reliability of the conclusions of a study. Demonstrating that lighting
conditions that enhance non-task surface brightness and but allowing personal control leads to better task performance and improved feelings of health and well-being once would be interesting, but demonstrating it twice is convincing.
3.7.2 Target Sample Size
In a between-groups experiment, each participant is randomly assigned to one of the experimental conditions (in this case, one of eight conditions: four lighting conditions crossed by two cubicle panel reflectances). This procedure ensures that individual differences are equally distributed between the groups, and allows the inference that if any differences exist between the groups on any dependent measure, then the treatment is the cause of the effect (Kerlinger & Lee, 2000). A power analysis was undertaken to determine the sample size necessary to detect medium-sized effects (7-10% explained variance; Cohen, 1988), which was the smallest effect size considered to have practical significance. Assuming the standard probability criterion of alpha=.05, a sample size of 200 people would provide adequate statistical power (power= .84 for the lighting design main effect, power = .93 for the partition luminance main effect, and power = .84 for the interaction [Borenstein, Rothstein, & Cohen, 1997]). To have enough statistical power to detect a small effect (1-2%) would have required 972 participants. Thus, we set our target as 50 participants in each of the four lighting conditions.
A random selection of people in the Base Case and Dimming Control conditions who at the end of the first day had indicated their willingness to participate again, returned for a second day of testing in which they experienced the other of these two lighting conditions from the one they had previously experienced. This procedure provided a counterbalanced presentation of the conditions (half had the base-case lighting first, and half had the best-practice with Dimming Control first). They experienced the same reflectance condition (either high or low) on both days.
The repeated measures experiment sample size target was set at 50 people, 25 each from the Base Case lighting condition and the Dimming Control condition. This repeated measures comparison required
a minimum sample size of 34 individuals (each experiencing both lighting design conditions) to detect medium size effects, so a sample size of 50 was expected to provide more than adequate power. (Statistical power for the detection of a small effect size would require 199 people; Borenstein et al., 1997).
Table 9. Schematic experimental design with planned sample sizes (Experiment 1)
Base Case Best Practice Best Practice with
Switching Control Dimming Control Gray Panel Between groups N = 25 Between groups N = 25 Between groups N = 25 Between groups N = 25 Blue Panel Between groups N = 25 Between groups N = 25 Between groups N = 25 Between groups N = 25 N = 200 participants randomly assigned to the 8 above conditions
Same panel reflectance for both
occasions: Repeated measures: N = 25 from Dimming Control participated a second time Repeated measures: N = 25 from Base Case participated a second time N = 50, each participant participating twice in counterbalanced order. 3.7.3 Participant Characteristics
The participants were recruited from an office temporary services agency; and paid at the agency rate for each day they worked. They were all over 18 years of age and were required to have experience with Windows-based word processing and spreadsheet software and a minimum typing speed of 30 words per minute, and have normal or corrected to normal vision and hearing.
Several demographic characteristics were recorded by the participants themselves, guided by the software on their computers. In addition, during one of the rest periods built into the day, each participant was taken to the vision screening room. In this room, the participants' near-field visual acuity, contrast sensitivity, color vision and visual field size were measured. Visual acuity was measured using the Lighthouse continuous text card seen at a distance of approximately 40 cm with an illuminance of 320 lx. Contrast sensitivity was measured using the Vistech contrast test system, viewed from a distance of 2.28
m, and at a background luminance of 60 cd/m2. Color vision was measured using the Ishihari Test for
Color Blindness. Visual field size was measured using an apparatus consisting of a horizontal array of white LEDs, with one LED positioned every 10 degrees from the fixation point. The participant was asked to fixate on the central LED, and the experimenter flashed different LEDs, one at a time, until the locations where the participant was no longer able to see the LED flashing were identified.
3.7.3.1 Between-groups experimental design
A total of 181 people provided valid data in the between-groups experimental design. The sample size for each of the eight experimental conditions is shown in Table 10. (Equipment failure and experimental errors led to the loss of data and the unequal group sizes.)
Table 10. Between-groups participants by experimental condition
Base Case Best Practice Best Practice
with Switching Control Dimming Control Total Light (Gray) 27 25 17 33 102 Dark (Blue) 24 16 16 23 79 Total 51 41 33 56 181
The demographic characteristics of the between-groups participants are summarized in Table 11.
Table 11. Between-groups sample characteristics
Sex 69 Male 112 Female
Age 86 – 18-29 38 – 30-39 28 – 40-49 22 – 50-59 7 – 60-69 Corrective Lenses 54 – None 23 – Reading 55 – Distance 15 – Bi- or Tri-focal 6 – Multi-focus 7 – Contact lenses Education 41 - HS 38 - CC 35 - UC 42 - UD 25 - GD
Note. HS = high school diploma. CC = community college diploma. UC = undergraduate courses. UD = undergraduate degree. GD = graduate degree.
We inquired about the frequency of hearing impairment or use of a hearing aid on the testing day. Eleven participants reported having at some time being diagnosed with a hearing impairment, and three wore a hearing aid at the test. In addition, no one reported any functional problems with hearing that prevented them from communicating with others during the session.
In the separate vision testing, participants’ color vision was tested: Six people failed the Ishihara color test.
The contrast sensitivity test consisted of five rows of rings, from high to low spatial frequency; in each row were nine targets of diminishing luminance contrast. Scores on this test were the sum of correctly-identified rings, from 0 to 45. The mean contrast sensitivity score was 33.22 (SD = 4.41). Near-field visual acuity was generally very high; the distribution is shown in Table 12.
Table 12. Between-groups participants' near-field visual acuity
Visual Acuity 20/
20 25 30 35 40 50 60 80
Total frequency 59 57 33 2 18 8 3 1
We also asked participants to report the duration of their time in the paid work force and as a
temporary office worker. Overall, participants had been in the workforce for an average of 15.2 years (SD = 11.4) and as a temporary worker for an average of 1.5 years (SD = 3.1).
3.7.3.2 Repeated-measures participants
A subset of the between-groups participants returned for a second visit in a different lighting condition. We examined the distributions of the demographic variables for the repeating participants to see whether or not they were similarly distributed to the larger sample. These statistics are shown in Table 13. The distributions differed from the full sample for every variable (compared to the overall sample for expected values, using chi-squared). The people who completed a second session included a higher proportion of women, a lower proportion of people aged 40 – 49, more contact lens wearers, and fewer people with only a high school diploma, than the overall sample. Two people in this group reported a hearing impairment and one used a hearing aid. The people who repeated did not differ from the whole sample in their total years in the workforce (M = 14, SD = 12) or as a temporary office worker (M = 1.2,
Table 13. Repeated measures sample characteristics
Sex 13 Male 32 Female χ2(1) = 102.6, p<.01
Age 20 – 18-29 9 – 30-39 11 – 40-49 3 – 50-59 2 – 60-69 χ 2 (4) = 103.1, p<.01 Corrective Lenses
13 -
None
6 – Reading 13 – Distance 3 – Bi- or Tri-focal 2 - Multi-focus 8 – Contact lenses χ2 (5) = 102.4, p<.01 Education 14 - HS 7 - CC 9 - UC 10 - UD 5 - GD χ2(4) = 102.8, p<.01Note. HS = high school diploma. CC = community college diploma. UC = undergraduate courses. UD = undergraduate degree. GD = graduate degree.
Visual acuity for the people who repeated showed a different pattern than for the full sample (χ2(7) =
103.5, p<.01) (Table 14), but the median and mean did not differ from the full sample. The difference in the distributions were a higher proportion of people with 20/20, 20/30, or 20/40 vision, and a lower proportion of people with 20/25 vision. Two people who repeated failed the color vision test, which was a
significantly higher proportion than in the full sample (χ2(1) = 103.7, p<.01). Contrast sensitivity test
scores were the same for the repeating participants as for the full between-groups sample (M = 33.51, SD = 3.89).
Table 14. Repeated measures visual acuity
Visual Acuity 20/ Median Mean
20 25 30 35 40 50 60 80
Frequency 13 20 6 1 2 2 1 0 25 27
3.8 Independent Variables
This experiment had two independent variables, lighting design and panel reflectance, that are applicable to all the dependent variables. In addition some dependent variables were measured more than once, thereby providing an independent variable of time for these dependent variables. Further, one of the tasks, the typing task, had the task material presented in three print sizes. The timed vision test also varied in target contrast, with six levels.
3.9 Dependent Variables 3.9.1 Daily Schedule
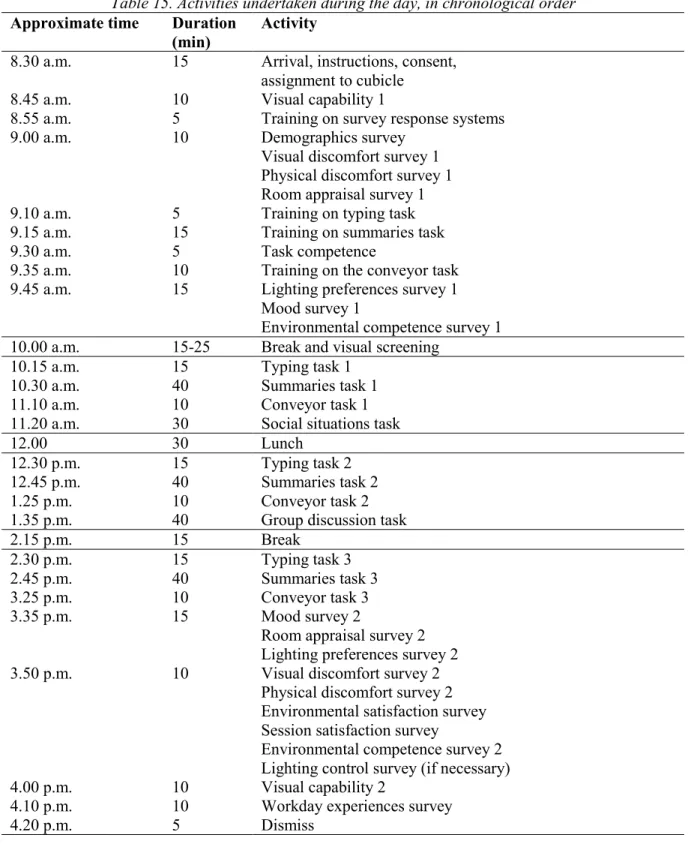
The outcome measures encompassed several domains in order to cover all of the concepts in the linked mechanisms map: visual and cognitive task performance; mood; satisfaction; vision capability; ratings of task and environmental competence, motivation, room appraisal, and lighting preferences. In addition, demographic information was recorded. The activities undertaken by the participants during the day are listed in the planned chronological order in Table 15.
As is clear from this list of activities, the first session, from 8.30 a.m. to 10.00 a.m., was primarily used for collecting demographic and current state information from the participants and for training the participants in the tasks. Subsequent sessions involved performance on a mixture of visual and cognitive tasks, with participants working as individuals or in a group. Several of the tasks and surveys were repeated so that changes over time could be examined. The typing task, summaries task, and the group discussion task required the participant to leave the cubicle and go up the hallway to retrieve information from the filing cabinets there. The group discussion task required the participant to leave the cubicle and go into the conference room with all the other participants to hold a discussion.
The nature of each activity and the data collected from it are discussed below in conceptual groups. This same conceptual grouping guided the data analysis reported in the Results section.