HAL Id: hal-01559760
https://hal.archives-ouvertes.fr/hal-01559760
Submitted on 10 Jul 2017
HAL is a multi-disciplinary open access
archive for the deposit and dissemination of
sci-entific research documents, whether they are
pub-lished or not. The documents may come from
teaching and research institutions in France or
abroad, or from public or private research centers.
L’archive ouverte pluridisciplinaire HAL, est
destinée au dépôt et à la diffusion de documents
scientifiques de niveau recherche, publiés ou non,
émanant des établissements d’enseignement et de
recherche français ou étrangers, des laboratoires
publics ou privés.
Photoinduced Structural Dynamics of Molecular
Systems Mapped by Time-Resolved X-ray Methods
Majed Chergui, Eric Collet
To cite this version:
Majed Chergui, Eric Collet. Photoinduced Structural Dynamics of Molecular Systems Mapped by
Time-Resolved X-ray Methods.
Chemical Reviews, American Chemical Society, 2017, 117 (16),
pp.11025-11065. �10.1021/acs.chemrev.6b00831�. �hal-01559760�
1
Photoinduced structural dynamics of molecular
systems mapped by time-resolved x-ray methods
Majed Chergui
*,†and Eric Collet
*,‡†
Ecole Polytechnique Fédérale de Lausanne, Laboratoire de Spectroscopie Ultrarapide (LSU),
ISIC, and Lausanne Centre for Ultrafast Science (LACUS), Faculté des Sciences de Base,
Lausanne CH-1015, Switzerland.
‡
Univ Rennes 1, CNRS, Institut de Physique de Rennes, UMR 6251, UBL, F-35042 Rennes,
France.
ABSTRACT:
We review the tremendous advances in ultrafast X-ray science, over the past 15 years, making the
best use of new ultrashort x-ray sources including table-top or large-scale facilities. Different
complementary x-ray based techniques, including spectroscopy, scattering and diffraction, are
presented. The broad and expanding spectrum of these techniques in the ultrafast time domain, is
delivering new insight into the dynamics of molecular systems, of solutions, of solids and of
Biosystems. Probing the time evolution of the electronic and structural degrees of freedom of these
systems on the timescales of femtosecond to picoseconds delivers new insight into our
understanding of dynamical matter.
2
CONTENTS:1. Introduction
2. Sources of Ultrashort X-ray pulses 2.1 Plasma-based sources
2.2 Large-scale facilities: Synchrotrons
2.3 Large-scale facilities: X-ray Free Electron Lasers (XFEL) 3. Structural dynamics with X-rays: Methods
3.1 X-ray spectroscopies
3.1.1 X-ray absorption spectroscopy
3.1.2 Photon-in/photon-out X-ray spectroscopies 3.2 X-ray Scattering
3.2.1 Scattering of molecules from disordered media 3.2.2. Diffraction by molecules in crystal lattices 3.2.3 Symmetry and broken symmetry
3.2.4 Local order and diffuse scattering
4. Structural dynamics of transition metal complexes in solution 4.1 Intramolecular Charge Transfer
4.2 Photoinduced spin cross-over dynamics 4.3 Bond forming dynamics
4.4 Solvation and its dynamics 4.5 Reactivity to solvent species 4.6 Intersite Charge Transfer 5. Molecules in crystals
5.1 Spin cross-over
5.1.1 Femtosecond spin-state switching in the solid state 5.1.2 Multiscale aspect of the out-of-equilibrium dynamics 5.1.3 Photoresponse of spin-state concentration wave 5.2 Time-resolved photocrystallography in molecular solids 5.2.1 Femtosecond studies of molecular crystals 5.2.2. Slower dynamics
5.3 Cooperative charge-transfer and photoinduced ferroelectricity 6. Biological systems
6.1 Picosecond studies 6.2 Femtosecond studies 7. Perspectives and Conclusions
3
1. IntroductionThe discovery of the X-rays by William Conrad Röntgen in 1895 sparked off a breath-taking chain of scientific breakthroughs in the first two decades of the XXth century that marked the birth of structural science. The systematic study of the characteristic rays (in emission and absorption) was mainly undertaken by Charles Glover Barkla, who discovered X-ray absorption edges (interestingly, this discovery preceded X-ray diffraction).1,2 Soon after, the
seminal works of Paul Ewald, Max von Laue, William Henry Bragg and William Lawrence Bragg in the period between 1912 and 1913, heralded the birth of a new Era by establishing the laws of X-ray diffraction from crystals and the determination of their structures with atomic resolution.3-7 The ideal crystal is a highly ordered arrangement
of atoms and molecules with perfect periodicity in three dimensions. In the real world this order is always disrupted. At any instant the atoms are displaced from their ideal mean position by thermal motion, even at absolute zero temperature. Soon after the pioneering works of Ewald, von Laue and the Braggs, Debye investigated the effects of thermal motions and disorder showing that they decrease the diffraction intensities of Bragg reflections, especially at high scattering angles.8 This would lead to the birth of Debye-Scherrer scattering for powder diffraction and
diffuse scattering, which applies to disordered media. Further additional discoveries, like electron diffraction and scattering, made it such that by the 1920s, X-ray and electron diffraction techniques had reached the atomic scale resolution of space, i.e. the Å. It can be said that while several spectacular improvements will come in the following decades, the stage was then set for the static structural determination of assemblies of atoms (crystals, molecules, proteins). The advent of computer science with always more powerful calculations made possible the analysis of larger amount of data for pushing such studies toward more complex systems, from the structure of simple crystals (like Na+Cl-) to the structure of proteins or viruses.
In parallel to the discoveries concerning scattering of X-rays, work was pursued to understand and interpret X-ray absorption and emission spectra, as the development of quantum mechanics was unfolding. Manne Siegbahn9-12
developed new apparata and methods to rigorously analyse X-ray spectra. However, X-ray spectroscopy would remain limited to chemical identification of elements and analysis of electronic structure. As a structural tool, X-ray absorption spectroscopy would have to go through several decades of theoretical developments (beautifully described in the historical review by Stumm von Bordwehr13) aimed at describing the modulations that appear in
the above-edge region of the spectrum of an atom, when it is embedded in a molecular or crystalline edifice. These modulations, called X-ray absorption near-edge structure (XANES) and extended X-ray absorption fine structure (EXAFS) finally received a consistent interpretation through the works of Sayers, Stern and Lytle.14 Several
improvements of the theoretical tools will ensue,15 making EXAFS in particular (whose treatment is easier), an
important element-selective tool in Materials Science, Biology and Chemistry.
Although, the awareness that resolving atomic motion was implicit in Debye’s work, several decades would be required before this will become possible, in particular, with the advent of the laser in the early 1960, thanks to the works of Ali Javan,16,17 Nikolai G. Basov, Alexander M. Prokhorov,18 Charles Townes and Arthur Schawlow. Soon
after the birth of the laser, pulsed nanosecond, then picosecond lasers appeared, but to reach the atomic scale of time, i.e. the femtosecond, laser technology had to wait the mid-1980, thanks to the works of Charles Shank.19-24
The time scales of chemical and physical transformation in matter span several decades and the required time resolution depends on the scientific question one needs to address (Figure 1). Animal motion requires typically millisecond resolution, and the first snapshots with such a resolution were taken by the French anatomist and physiologist, Etienne-Jules Marrey,25 who developed the first shutter camera. Large amplitude protein motion
requires ms to s, which can be monitored by NMR or optical techniques. As the length scale of processes decreases, e.g. acoustic waves, molecular rotation, molecular vibrations, there is need for higher and higher temporal resolution spanning the range from nanoseconds (ns) to femtoseconds (fs). For the description of processes occurring at the atomic scale of length, i.e. the chemical bond, fs-resolution is required. This is the time scale of nuclear motion or vibration in molecules, crystals and biosystems, and has, for that matter been coined the atomic scale of time by A. H. Zewail, who pioneered Femtochemistry, by demonstrating the power of fs pump-probe spectroscopy to describe chemical processes. He was awarded the Nobel Prize for Chemistry in 1999 for his seminal contributions.26-30
4
Figure 1: Time scales of fundamental processes in Nature and (below) types of devices to probe them in real-time. The atomic scale of time is the femtosecond and that of length is the Angström.
Indeed, for the first time it became possible to probe in real-time the motion of atoms inside molecules, via their wavepacket dynamics, and monitor chemical reactions and the transition state. This major development and that of others in the growing community of ultrafast scientists,31-37 were all carried out using optical pulses in the IR,
visible and ultraviolet. Yet from the beginning it was clear to many in this community that optical-domain radiation does not deliver structural information, except in a few rare cases, i.e. small molecules whose energy topology (i.e. potential energy curves) is known. This does not apply to assemblies of more than 3 atoms and therefore early on in the 1990s, were there suggestions to replace the optical probe pulse by ultrashort pulses of electrons or of X-rays. A. H. Zewail was the sole to adopt the route with electron pulses,38-41 while most of the community adopted
X-rays.42-54 The main challenge in this endeavour was the development of sources of ultrashort electron or X-ray
pulses and the mastering of data acquisition schemes which differed greatly depending on whether one carries out diffraction, scattering or spectroscopic measurements. The common technical preoccupation of scientists coming from very different scientific backgrounds (Chemistry, Biology, Solid state physics, Materials Science, Engineering) has created a convergence of interests towards instrumentation that is used equally by different communities. The pioneering work of the Zewail group on ultrafast electron diffraction and more recently, microscopy and Electron Energy Loss Spectroscopy has been reviewed in several excellent papers and is beyond the scope of this review. 55-60 Rather, here we focus more specifically on the studies using X-ray pulses that have been undertaken in the last
15 years to probe the photoinduced structural changes in molecular systems, either in solutions or in crystalline forms. While several reviews have already been published on the X-ray probing of molecular systems,56,61-71 this is
the first that binds together the solution and crystalline phases.
Probing the nuclear dynamics of molecular systems requires both the atomic-scale resolution of space (the Å) of structural methods such as X-ray or electron diffraction and X-ray absorption spectroscopy, with the atomic resolution of time, the femtosecond. The principle of all these approaches consists in exciting the sample with an ultrashort laser pump pulse and probing it with a second ultrashort X-ray (or electron) probe pulse, whose time delay with respect to the first is tuned by optical delay lines in the femtosecond to picosecond range, or even longer times.
When an X-ray beam is incident on a sample, several processes can occur as schematically depicted in Figure 2. The beam can be scattered with a change of the incident wave vector. This forms the basis of scattering and diffraction methods, which over the past century have been refined to a high degree of sophistication to study molecules in crystals or in solution. Most of the incident beam is however absorbed creating a photoelectron extracted from a core orbital by the high energy incident beam. This X-ray absorption process is the basis of structural methods described below. The core hole can be refilled by an electron from a higher core orbital leading to X-ray emission, which contains extremely valuable information about the electronic and spin structure of the system. Finally, either the photoelectron or electrons resulting from Auger processes may be detected, providing valuable electronic structure information. These various approaches will be discussed in detail in §§ 3.
Central to the methods discussed here are ultrashort X-ray pulses. Thereafter, we describe the available sources delivering such pulses.
5
Figure 2: Processes that are triggered when an X-ray beam intensity (I0) is incident on a sample. Different types of
core-level spectroscopies are possible: X-ray absorption spectroscopy (XAS), photon-in/photon-out spectroscopies which are broadly classified as ray emission (XES) and Photoelectron spectroscopy (photo-in/electron-out). X-ray scattering is used to probe structures of molecules in solution and X-X-ray diffraction for crystalline systems.
2. Sources of Ultrashort X-ray pulses
Performing time-resolved ray experiments with picosecond to femtosecond time resolution requires ultrashort X-ray pulses, as there are no detector capable of picosecond to femtosecond resolution. Thus the time resolution has to rely on the source and on the use of optical delay lines, just as in ultrafast optical spectroscopy. There are several classes of sources of ultrashort X-ray pulses, which can be broadly classified as table-top or large scale installations. Within these two categories, sources also differ in pulse duration, energy range, energy tunability, etc. The commonly used table-top sources include: (i) laser-driven table-top plasma sources, which can generate 100 fs hard X-ray pulses;72 (ii) high harmonic generation (HHG) sources that can reach attosecond pulse durations but are
limited to the vacuum ultraviolet (VUV) to soft X-ray range.73 The large scale installations are all accelerator-based
facilities such as synchrotrons, which can generate 100 ps X-ray pulses that can be shortened to 100 fs using the slicing scheme,74-77 or X-ray free electron lasers (X-FELs), which can generate intense X-ray pulses of few fs.78 In
the following we will give a brief description of ultrashort pulsed hard X-ray sources based on table-top and large-scale installations, as several detailed reviews on each type can already be found in the literature.61,67,72,78-80 The
most commonly used sources for ultrafast X-ray studies to date have been the plasma based ones (table-top), synchrotrons and X-ray free electron laser, on which we concentrate hereafter.
2.1 Plasma-based sources
In laser-driven plasma sources,81 a femtosecond laser pulse with peak intensity higher than 1016 W/cm2, is used to
irradiate a metal target, resulting in creation of a plasma. The thus generated free electrons are accelerated by the very high electric field of the laser pulse and their interactions with target atoms leads to emission of soft and hard X-ray radiation. However, the emitted X-ray pulse is isotropic and it fluctuates in intensity on a pulse-to-pulse basis, requiring special optics to collect the radiation and special set-up designs to correct for the fluctuations. Usually, the collected radiation amounts to only a small part of the typically 109 X-ray photons emitted per pulse, because of
constraints on time resolution.72 For a target thickness of the order of 10 μm, the characteristic emission has duration
of the order of 100 fs. An interesting intrinsic property of this technique is that time zero is very well defined, as the same optical laser is used to excite the sample and generate the plasma. It is with this technique that Rischel et al reported the first fs X-ray diffraction study of the ultrafast melting of molecular layers.82
Recent developments in laser and target technologies have allowed the generation of hard X-ray pulses at kHz repetition rates and much reduced intensity fluctuations. Because, the irradiated target is damaged irreversibly, it is moved to refresh it after for each laser pulse. Furthermore, a highly stable spatial position of the target area with fluctuations of less than 20 μm is needed. Some hard X-ray plasma sources with Cu tape targets are driven by sub-50 fs pulses and work at 1 kHz repetition rate83 and the collimated hard x-ray flux on the sample reaches up to 107
photons/s. It was shown that by using intense mid-IR sub-100-fs pulses allows for accelerating electrons from the Cu target due to much higher kinetic energies comparably long optical period, thus generating a 25 times higher X-ray flux than with 800 nm laser pulses.84
6
2.2 Large-scale facilities: SynchrotronsThe X-ray pulses generated by third generation synchrotrons are of the order of 50-150 picosecond, and can be used to probe photoinduced structural changes on time scales of >100 ps, either by X-ray diffraction, scattering or spectroscopy. The pioneering development of the X-ray scattering technique with 100 ps time resolution was performed on the ID09B beam-line by the Wulff group at the European Synchrotron Radiation Facility (ESRF, France).85,86 It is now available in several places around the world, such as the APS (Argonne, USA) and the
KEK-AR (Tsukuba, Japan).87 For example, during experiments performed at the ESRF in the 16-bunch mode, the
different bunches from the synchrotron generate X-ray pulses separated by about 176 ns. In the 1 kHz repetition rate mode, the X-ray flux is decreased by a factor of ≈ 6000, as a mechanical chopper selects one X-ray pulse every ms. Nevertheless, the X-ray flux in the 1 kHz time-resolved mode is comparable with the one of a conventional X-ray tube. Such a technique has been successfully utilized to perform structural investigations of chemical or biochemical photoinduced phenomena occurring on 100 ps time scale.88
X-ray absorption spectroscopy with 50-100 ps resolution was pioneered by the Chergui group at synchrotrons.54,56,61,62,67,68,71,89-97 Parallel to the latter, developments driven by L. Chen and her group were also
taking place.64,65,98-100 Time-resolved X-ray spectroscopy quickly emerged as an important tool for studying solution
phase photoinduced electronic and structural changes in chemical systems at synchrotrons in the USA,101,102
Japan,87,103,104 and by several groups worldwide using the US, Swiss and Japanese synchrotrons.
Until about 2010, time-resolved X-ray absorption experiments were carried out using a 1 kHz femtosecond laser, while synchrotrons operate at MHz repetition rates, so that at least 103 of the X-ray pulses remained unused. A
major development was introduced by the Chergui group, which consisted in using a ps pump laser (rather than a fs one) whose repetition rate is half or an integer fraction of that of the synchrotron.105 Keeping all other parameters
fixed, this leads to an increase of the signal by the root square of the laser repetition rate compared to the same signal recorded with a 1 kHz laser. This scheme also opens the possibility to perform photon-in/photon-out experiments (including scattering and diffraction), which require a high incident flux per second.106 This development
was followed by similar ones at the APS107 and Elettra.108
In order to extract femtosecond X-ray pulses from synchrotrons, in particular with energy tuneability, the slicing scheme was proposed by Zholents and Zholterev109 and its experimental validation was reported at the ALS.74 It
consists in co-propagating an intense fs laser pulse (100 fs) with the electron bunch (100 ps) in the storage ring, and the interaction between the two slices out wedges that have the same time structure as the laser pulse. The first “slicing” beamlines were developed at the ALS110,111 and at BESSY-Germany112 and were operating in the soft
X-ray range. The first hard X-ray slicing source was implemented at the Swiss Light Source,77 where a fs laser
beam is split to "pump" and "probe" branches. The "probe" branch modulates the energy of the electrons in the modulator where electrons in the magnetic device interact with the femtosecond laser. The slice of electrons passing through the undulator generates a femtosecond X-ray pulse used to probe the sample at a variable time delay with respect to the pump pulse which is intrinsically synchronized to the sliced beam. This is a great advantage of the slicing scheme, but the photon flux in the X-ray pulse is very low (typically 1/1000 of the 50-100 ps pulse), even more so, when performing X-ray absorption spectroscopy experiments, which require a narrow energy band pass. Nevertheless, it was with the slicing scheme that the first fs X-ray experiment on a molecular system was achieved on a large facility by Chergui and co-workers.113 The new generation of machines, X-ray free electron lasers,
overcomes this limitation as discussed hereafter.
2.3 Large-scale facilities: X-ray Free Electron Lasers (XFEL)
X-ray Free Electron Lasers are linear accelerators with insertion devices (undulators) at their end, so that the electron bunches are used only once (Figure 3). The magnetic structure used to generate X-rays are linear sections hundreds of meters long. Such long interaction volumes force the electrons in the bunch to interact constructively via the generated X-ray field, giving rise to the so-called microbunching, which shortens the X-ray pulse duration tremendously (≤ 100 fs), enhances coherence, emittance and importantly flux, with values of 1012 photons/pulse in
0.1% bandwidth. This self-amplified spontaneous emission (SASE) of hard X-rays was generated for the first time in the hard X-ray range at the Linac Coherent Light Source (LCLS) at SLAC (Stanford, USA)114 and later at SACLA
(Sayo, Japan).115 New machines will be inaugurated in 2017: the European X-FEL (Hamburg, Germany) and the
SwissFEL at the Paul Scherrer Institute (Villigen, Switzerland), while another machine is under construction in Korea.
7
Figure 3: Operation principle of the Free Electron Laser. Electrons are accelerated close to the speed of light. As the beam passes through the undulator (a), which is an array of magnets, the electrons are forced to wiggle transversely along a sinusoidal path about the axis of the undulator, leading to emission of light. When the latter becomes sufficiently strong, interaction between the transverse electric field of the light and the transverse electron current causes some electrons to gain and others to lose energy to the optical field. This energy modulation leads to a microbunching (b) of the electrons, which are separated by one optical wavelength along the axis, and to an increase in radiated power and coherence (c). Reprinted with permission from Reference 116. Copyright 2017 Royal
Society of Chemistry.
The LCLS and SACLA deliver up to 1014 photons/second on the sample and the time duration of the X-ray pulses
can be decreased down to a few fs. Because of the fluctuating initial conditions of the SASE, the spectral and the time structures of the X-ray pulses fluctuate on a shot-to-shot basis. However, it is now possible to correct for these fluctuations using monochromators and normalization methods for better characterizing the X-ray spectrum, while the use of the timing-tool allows achieving few-fs time sorting.117
While the hard X-ray FELs are all based on the principle of SASE, one machine, FERMI@Elettra (Trieste, Italy), operates as a seeded FEL and therefore as a real laser.118-121 It generates soft X-ray pulses up to about 300 eV,
and work is in progress to increase this limit to the Oxygen K-edge.
3. Structural dynamics with X-rays: Methods 3.1 X-ray spectroscopies
3.1.1 X-ray absorption spectroscopy
An X-ray absorption spectrum (XAS) consists of absorption edges, which represent ionisation thresholds of the various core orbitals (Figure 4). An edge spectrum can be divided in three energy parts: the pre-edge region, the edge and the region up to about 50 eV above it, or so-called X-ray near-edge absorption structure (XANES), and the region at higher energy, called the extended X-ray absorption fine structure (EXAFS). These have been described in several textbooks and review articles,15,61,122-125 so that here, we only repeat the main characteristics
8
In pre-edge transitions, the core electron is excited to unoccupied or partially filled valence orbitals just below the ionization potential (E0 in figure 4). Therefore, these atomic transitions contain element-specific information about
the occupancy of valence orbitals, which are the ones involved in chemical bonding and chemical transformations. Once above E0, in the XANES region, the atom is ionized and the photoelectrons (PE) that are generated have low
kinetic energy, i.e. a high scattering cross-section. For this reason, they undergo multiple scattering (MS) processes, giving rise to strong modulations of the absorption coefficient, which dominate the signal. These processes contain information about the three-dimensional structure around the absorbing atom, i.e. coordination numbers, bond distances and bond angles, as discussed in several publications.15,68,122,124,126-128 In the EXAFS region, the PEs
have a large kinetic energy (i.e. smaller scattering cross-section) and the signal is dominated by single scattering (SS) events, giving rise to weak modulations of the absorption coefficient. This region delivers information about coordination numbers and bond distances to the nearest neighbours of the absorbing atom.
Figure 4: X-ray absorption spectroscopy. Excitation of a core orbital to the orbitals below the ionization potential (E0) gives rise to pre-edge transitions, which probe the unoccupied density of states. Above E0, there is a jump in
the absorption cross-section giving rise to an edge and a photoelectron is generated whose de Broglie wavelength depends on its excess energy (E-E0). Low energy electrons have high scattering cross sections, so if the absorbing
atom is embedded in an assembly of atoms, multiple scattering events occur (right panel), giving rise to modulations of the spectrum in the above ionization region, called the X-ray absorption near edge structure (XANES). As the kinetic energy of the electrons increases, the cross section decreases and weaker modulations appear which form the Extended X-ray absorption fine structure (EXAFS).
The descriptions of the pre-edge region (bound-bound transitions) and the above-edge region (bound-to-continuum transitions) call for different theoretical treatments, which have been described in detail in ref. 70 and will not be
repeated here.
The key feature of XAS is its ability to probe both the electronic structure of an absorber and the nuclear structure around it in the same measurement. In particular, it is important to stress that one interrogates the valence orbitals of the system, which are those entering in the formation and transformation of chemical bonds. In this respect, XAS is unique compared to all other X-ray diffraction tools, where accurate determination of the electron density can only be retrieved by time consuming high-resolution measurements and topological analysis.
9
For extending XAS into the time-domain, the now commonly adopted strategy was developed by the Chergui group and it consists in recording transient XAS by taking the difference at a particular X-ray energy and pump-probe time delay (t) of the transmission signal from the excited sample (pumped) minus that from the unexcited sample (unpumped) on a pulse-to pulse basis.61,62,92,95 This requires that the laser operates at half or an integer fraction of
the repetition rate of the X-ray source. The advantage of the pulse-to-pulse data acquisition scheme is that it corrects for short term fluctuations and long-term drifts of the source, such that the transient signals can be acquired at the shot noise of the synchrotron source, which is very stable. A measurement of the background in the gap where no X-rays are present is also made. It is then subtracted of the corresponding X-ray signal to compensate for any drifts over time of the data acquisition baseline. The transient spectrum is then:
∆𝐼(Ω, 𝑡) = 𝑓 ∙ [𝜑(𝑡)𝐼𝑝𝑢𝑚𝑝𝑒𝑑(Ω) − 𝐼𝑢𝑛𝑝𝑢𝑚𝑝𝑒𝑑(Ω)]
where f is the photolysis yield and 𝜑 (t) represents the quantum yield of the photogenerated product, whose time dependence reflects decay processes. This general methodology also applies to the second-order spectroscopies described in the next section.
3.1.2 Photon-in/photon-out X-ray spectroscopies
Photon-in/photon-out X-ray spectroscopies129 involve the detection of emitted X-ray photons after X-ray absorption
(Figure 2). While XAS provides insight into the unoccupied valence orbitals, just as in optical spectroscopy, X-ray emission spectroscopy (XES) provides information about the occupied and partially occupied density of states (DOS). These spectroscopies are treated within second-order perturbation theory and are therefore also called second-order spectroscopies.130 Their theoretical description in relation to time-resolved studies was discussed in
ref. 70 and will not be repeated here.
Photon-in/photon-out spectroscopies with incoming hard X-rays span a wide variety of approaches, which allow retrieving soft X-ray (L- or M-edges), low-energy excitations, perform site selective and/or range-extended EXAFS131-133 and record high-resolution XAS spectra.
Because the X-ray scattering and fluorescence cross-sections are low thanks to the advent of more intense X-ray sources and high-resolution detectors, it has become possible to record steady-state ray emission (XES) or X-ray Raman spectroscopy in a routine way. Their extension in time domain experiments has become possible thanks to the increased photon flux brought about by the high repetition rate schemes at synchrotrons105,107 or the X-FELs
are making time-resolved second-order spectroscopies new tools in chemistry, condensed matter physics and biology.
Photon-in/photon-out spectroscopies are described by the Kramers-Heisenberg equation.134 Just as in the optical
domain, this equation describes the absorption of a photon from the ground state i to an intermediate state n, that decays to a final state f, which can be seen as coherently coupled absorption and emission events. This implies that interference between different intermediate states can affect the spectral weights. However, in the hard X-ray range, the weights are generally small and interference terms can be neglected.
In a non-coherent process, the absorption matrix elements from initial state i to intermediate state n are weighed by the emission matrix element. An example is XAS in total fluorescence yield (TFY) detection mode, where the fluorescence from the sample is collected with no energy resolution, as a function of the incident photon energy. This is equivalent to integrating over the XES matrix elements and consequently, it turns the emission matrix elements into a constant.135 This approach is advantageous when the signal of interest contributes only a small
fraction to the total absorption, or when the sample transmission is very large, e.g. dilute samples.
3.1.2.1 Non-resonant X-ray emission (NXES)
X-ray emission can be triggered by absorption of a core electron either into a resonant state or non-resonantly. For non-resonant X-ray emission (NXES), the incident photon energy is much above the Fermi energy for a core transition, and the PE is ejected into the continuum (Figure 2). The spectral weights are largely independent of the incident photon energy and the lifetime broadening of the spectrum corresponds to n + f.136
10
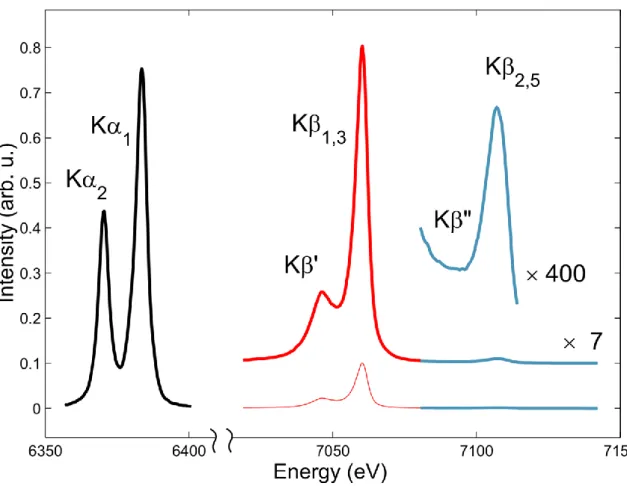
Figure 5: Typical K-edge emission spectrum of Fe showing the characteristic emission lines. Courtesy G. Vanko. Figure 5 shows the K emission spectrum of an Fe(II) complex, i.e. after creation of a hole in the Fe 1s-orbital is characterized by a number of spectral lines: the strongest of which are the K1 and K2 lines, due to transitions
from the 2p3/2 and 2p1/2 levels (making up the L-shell), respectively. These core-to-core transitions are commonly
employed to retrieve TFY XAS (§ 3.1.2). At higher energies lie the K1,3 lines (3p→1s) transitions, which are nearly
one order of magnitude weaker than the K ones. Still higher in energy are the so-called valence-to-core K2,5/ K”
lines. These are much weaker due to a poorer overlap of initial (valence orbital) and final (core orbital) wave functions. They are the emission equivalent of the pre-edge transition in XAS (Figure 4). Because they stem from the valence orbitals, the K2,5/ K” lines are very sensitive to the chemical environment of the emitting atom, in
particular the ligand orbitals, and, to a certain extent, bond distances.129,137,138 In time-domain experiments, they will
yield important information about the valence electron density change resulting from an ultrafast chemical process.
3.1.2.2 Resonant X-ray emission (RXES)
Resonant X-ray emission (RXES) occurs when the incident X-ray photon energy excites an unoccupied orbital, occurs. The signals are more intense than in NXES and are incident energy-dependent.139-141 This is also called
resonant inelastic X-ray scattering (RIXS). Thereafter, this term will be used. RIXS combines XAS and X-ray diffraction in one single experiment. The X-ray direction yields spatial information, while the spectroscopic part, through the anomalous scattering amplitude, provides information about the electronic states of the system.142 In
case the initial and final states are different, an energy transfer to the system occurs.143 In RIXS maps, the incident
and emitted (or energy transfer) photon energies are displayed on a 2D correlation plot. Figure 6 shows the Pt L3
(2p3/2-3d5/2) RIXS plane of the di-platinum complex [Pt2(P2O5H2)4]4- (abbreviated PtPOP) measured in solution in
the two most commonly used presentation formats: XAS vs XES and XAS vs Energy transfer.70 It was obtained
using a dispersive X-ray spectrometer in von Hamos geometry that detected the L1 X-ray emission (9.44 keV), and
scanning the incident X-ray energy across the L3-edge.144 By resolving both the incident and emitted photon
energies, one simultaneously measures the occupied and unoccupied density of states around the resonant core excitation. In addition, the transferred energy corresponds to elementary excitation of the final state of the material, which can include low-energy excitations such as charge-transfer or ligand-field excitations in the case of metal complexes.145,146
11
Figure 6: Pt L3-edge RIXS measurements of the di-platinum complex [Pt2(P2O5H2)4]4− measured in solution using a
dispersive von Hamos spectrometer.144 (a) and (b) present the 2p
3/2–3d5/2 resonant inelastic X-ray scattering (RIXS)
plane as XAS vs XES and XAS vs Energy transfer plots, respectively, where Energy transfer = XAS − XES. (c) shows high-energy resolution fluorescence detection (HERFD) signals at three X-ray emission energies, corresponding to horizontal slices in (a) and diagonal slices in (b). Note the sensitivity of the HERFD signal to the chosen emission energy. (d) Comparison between the total fluorescence yield (TFY) and HERFD signals, illustrating the increased energy resolution possible with the HERFD technique. Reprinted with permission from Reference 70.
Copyright 2017 Elsevier.
3.2 X-ray Scattering
Scattering techniques of X-rays, as well as of neutrons and electrons, represent a fundamental tool to investigate structural aspects of matter and its transformations.147,148 Hereafter we highlight the some important features and
the X-ray scattering and diffraction and the extension of these methods to time-resolved techniques, which open the possibilities to observe how matter rearranges in real-time.88 The scattering of monochromatic X-rays
(wavelength ), through the interaction with electrons contained in atoms, changes the direction of the incident radiation. This process is described through the momentum transfer 𝑄⃗ between the incident 𝑘⃗⃗⃗ and diffracted 𝑘𝑖 ⃗⃗⃗⃗ (or 𝑑
scattered) wave vectors.
𝑄⃗ = 𝑘⃗⃗⃗⃗ -𝑘𝑑⃗⃗⃗ . 𝑖
This change of direction is also measured by the angle 2𝜃 = (𝑘⃗⃗⃗⃗ , 𝑘̂ ). The resulting scattering of the X-ray wave by 𝑑 ⃗⃗⃗ 𝑖
an assembly of atoms forming a molecule gives rise to interferences along 𝑄⃗ . This scattering process can be described in the case of disordered molecules in solution for example, with random position and orientation, or in the case of highly ordered molecules paving a 3D crystalline lattice. In the first case, the scattered signal will be shaped by the dephasing of the waves scattered by the different atoms of the molecules, whereas in the second case additional interferences from the different nodes of the lattice will give rise to constructive interferences around the Bragg peaks only.
3.2.1 Scattering of molecules from disordered media
Molecules in solution (or in gas phase) show a statistical distribution of positions and orientations. The Curie symmetry principle explains why the scattered X-ray signal S(𝑄⃗ ) from such an ensemble of disordered molecules
12
is isotropic and only depends on the modulus Q=(4/)sin(). This isotropic signal observed with bi-dimensional
detectors is translated to one-dimensional intensity curves, S(Q), obtained by the radial integration of the signal. The Debye description, which holds for isolated molecules in gas-phase, is a simple approach to analyze scattering patterns from liquids:
𝑆(𝑄) = ∑ 𝑓𝑖(𝑄)𝑓𝑗(𝑄)
sin(𝑄. 𝑟𝑖𝑗)
𝑄. 𝑟𝑖𝑗 𝑖,𝑗
where fj(Q) denotes atomic form factors and rij are the distances between the atoms i and j. This description basically
reproduces the scattering pattern by molecules through a set of atoms with interatomic distances. More detailed analysis for molecules in solution also includes the bulk solvent contribution and the solvation shell.149 Tracking the
molecular structural change in the time domain is easier through:
S(q,t)=S(q,t)-S(q),
whereby the ground state scattered signal S(q) is subtracted from the scattered signal S(q,t) at a time delay t after photoexcitation. From this change of the scattering pattern, the structural modification is refined. Behind this very simple description of the process, it should be underlined that the solvent response can be the dominating part of the measured signal and that it in most cases it is far from trivial to extract the solute contribution.150 More details
on the X-ray data processing can be found in e.g., ref. 151.
3.2.2 Diffraction by molecules in crystal lattices
In molecular crystals, the molecules adopt well-defined positions and/or orientations. A perfect 3D crystal is built with a periodical repetition, over the unit cells, of a molecular motif along 3 lattice vectors 𝑎 , 𝑏⃗ and 𝑐 , forming the unit cell.147 The unit cell is also described by the length of three axes: a, b, c and the angles 𝛼, 𝛽 and 𝛾 between
them. As in the case for isolated molecules, an incident X-ray is scattered by the electrons around atoms. The different atoms within the unit cell scatter X-rays with different amplitudes (atomic form factors) and phases (atomic positions 𝑟⃗⃗ in the unit cell). However, since atoms in a crystal are arranged in a regular pattern, the scattering by a 𝑗
crystal gives rise to constructive interferences for specific directions 𝑄⃗ , corresponding to the nodes of the reciprocal lattice (defined by 𝑎 ∗,𝑏⃗ ∗,𝑐 ∗). Each of these directions 𝑄⃗ = h𝑎 *+k𝑏⃗ *+l𝑐 * is associated with integer values of the (hkl)
coordinates and corresponds to the so-called Bragg peaks. The intensity of every Bragg peak is proportional to the square modulus of the amplitude 𝐹(𝑄⃗ )scattered by all the electrons of a unit cell and the structure factor of the unit cell is given by:
𝐹(𝑄⃗ ) = 𝐹(ℎ𝑘𝑙) = ∑ 𝑓𝑗(𝑄) 𝑗
exp(−𝑄⃗ . 𝑟⃗⃗ ) = ∑ 𝑓𝑗 𝑗(𝑄) 𝑗
exp(−2𝑖𝜋(ℎ𝑥𝑗+ 𝑘𝑦𝑗+ 𝑙𝑧𝑗))
The integrated intensity of a Bragg peak on the (hkl) node corresponds to I(hkl)=|F(hkl)|2. Thus the information about
the position of atoms within the unit cell is distributed in the structure factors of the different Bragg peaks on the nodes of the reciprocal lattice. Solving and refining a structure is possible through the measurement of the position and intensities of the Bragg peaks.
There are different techniques to perform X-ray diffraction measurements.147 Monochromatic X-ray radiation on a
single crystal requires to mount it on a goniometer. During small rotation of the sample (1°), different Bragg peaks cross the Ewald sphere, i.e. when 𝑄⃗ = h𝑎 *+k𝑏⃗ *+l𝑐 * = 𝑘
𝑑
⃗⃗⃗⃗ -𝑘⃗⃗⃗ and X-rays are scattered along different directions 𝑄⃗ and 𝑖
collected on a 2D detector. The images measured with 1° step are converted into a three-dimensional model of the diffracted intensity on the nodes of the reciprocal lattice I(𝑄⃗ )=I(hkl). Then, a three-dimensional map of the scattering atoms is obtained by comparing calculated intensities for a given structure to the measured ones. This is made possible with different software's like SHELX152 or JANA.153 Solving the structure of a molecular crystal, made of
100 independent atoms in the unit cell for example, means finding 9 parameters for each atom j in the unit: its coordinates xj, yj, zj, cell and the 6 anisotropic thermal motion parameters. Accurate structures are obtained when
thousands of Bragg peaks are collected. Extremely accurate data and analysis make it possible to obtain precise 3D electronic density.
When single crystals are too small, X-ray scattering can be collected from a powder, made of many and statistically disoriented small crystals. The resulting diffraction rings are converted in scattered intensity I(|𝑄⃗ |). If the data collection is simple, as with the Debye-Scherrer method, the structural and symmetry analysis is more difficult. Indeed, the diffracted intensity of some Bragg peaks with different 𝑄⃗ but same |𝑄⃗ | superpose, even if these are not equivalent by symmetry.
Another option is to use the Laue technique, where a continuous radiation (white or pink beam, with continuous |𝑘⃗ |) impacts a stationary crystal. A set of diffracted beams are diffracted at different𝑄⃗ corresponding to different |𝑘⃗ |. Contrary to monochromatic measurements, where the diffracted beams intersect a single Ewald at 𝑘⃗⃗⃗⃗ , different 𝑑
13
does not require a sample rotation. This technique is appropriate for biocrystals, made of large unit cells, as many nodes of the reciprocal lattice give rise to diffraction. Coppens and co-workers used this technique on molecular crystals for tracking diffracted intensity changes in the time domain (see § 5.2.2).
One problem for time-resolved photo-crystallography is the difficulty to achieve a homogeneous excitation of the molecular crystals. For single crystals the laser penetration depth may be smaller than the sample thickness, or it may depend on the sample orientation. For powdered samples, some grains may be more exposed to laser radiation than others. Finally, on long timescales the strains in the crystal induced by light can also broaden the Bragg peaks and this inhomogeneous structure makes the interpretation of intensity changes more difficult.
3.2.3 Symmetry and broken symmetry
Since the structure factor is written as the contribution of individual atoms within the unit cell, the symmetry existing in real-space translates into reciprocal space, as stated again by the Curie symmetry principle. The spatial distribution of atoms is associated with a spatial distribution of the electron density 𝜌(x, y, z), and therefore a spatial distribution of 𝑓𝑗(𝑄). The diffraction pattern, which is the effect of X-ray scattering by atoms in a crystal, has the
same (or a higher) symmetry than its cause. For example, when a 2-fold symmetry axis along 𝑏⃗ exists in the crystal structure, any spatial density follows this symmetry 𝜌(x, y, z) = 𝜌(-x, y, -z). This gives the relationship between different structure factors F(hkl) = F(-h k -l). The symmetry operators of the space group, which are relating the different symmetry-equivalent atomic positions in the unit cell, translates in the symmetry equivalence of the intensities of different Bragg peaks with different (hkl). In addition, for specific symmetry operators including fractional translation (such as non-primitive unit cell or non-symmorphic symmetry elements like screw axes or glide planes), the intensity of some Bragg peaks vanishes by symmetry on specific nodes. For example, in the case of crystals with 21 screw axis along 𝑏⃗ the density follows 𝜌(x y z)=𝜌(-x y+1/2 -z). Then their structure factors:
𝐹(0𝑘0) = 0for𝑘 = 2𝑛 + 1.
Ordering phenomena and more generally broken symmetry in chemistry, physics and materials science are responsible for the emergence of physical properties, such as ferromagnetism and ferroelectricity, for example. The ordering of groups of atoms in different electronic states is often associated with a structural reorganization sometimes manifested by the appearance of regular patterns in real-space, as is the case for charge-density waves (CDW), spin-density waves (SDW) or superconductors, for instance.
A phase transition between two phases of high and low symmetry is described in the generalized framework of the Landau theory of phase transitions through the evolution from the high symmetry space group.154 In the high
symmetry space group G0, the density is totally symmetric and invariant under the symmetry operators of G0. The
electron density in this space group is the same for different positions (x,y,z) and (x',y',z') symmetry equivalent and therefore 𝜌0 (x,y,z) =𝜌0(x',y',z'). When a phase transition drives the system to a lower symmetry phase, with space
group G being a sub-group of G0, Landau proposed to decompose the density observed in G as a sum of two
components:
𝜌 = 𝜌0+ 𝜂. 𝛥𝜌
𝜌0 is a totally symmetric spatial density described above with respect to the high-symmetry phase, 𝛥𝜌 describes the
symmetry lowering of the density towards the low-symmetry phase. The deviation of the low symmetry phase from the high symmetry phase is measured by the amplitude of the order parameter𝜂. In a crystal, the translation symmetry 𝑇⃗ on the lattice is written as
𝑇⃗ = 𝑚𝑎 + 𝑛𝑏⃗ + 𝑝𝑐 with m, n, p integers.
Therefore 𝜌0(𝑥, 𝑦, 𝑧) = 𝜌0(𝑥 + 𝑚, 𝑦 + 𝑛, 𝑧 + 𝑝). There are many examples of molecular materials showing phase
transitions associated with loss of translation symmetry.155,156 Let us consider a system associated with a cell
doubling along 𝑐 axis. 𝑐′⃗⃗ =2𝑐 is the new translation vector along the direction 𝑐 and we have to consider now the new lattice with translational symmetry
𝑇⃗ ′= 𝑚𝑎 + 𝑛𝑏⃗ + 𝑝𝑐 ′
where the density is invariant with 𝑇⃗ ′ and so 𝜌
0(𝑥, 𝑦, 𝑧) = 𝜌0(𝑥 + 𝑚, 𝑦 + 𝑛, 𝑧 + 𝑝). However, the density is no more
invariant with 𝑐 =𝑐 2′ in the low symmetry phase 𝜌0(𝑥, 𝑦, 𝑧) ≠ 𝜌0(𝑥 + 𝑚, 𝑦 + 𝑛, 𝑧 + 𝑝 + 1/2). Figure 7 illustrates
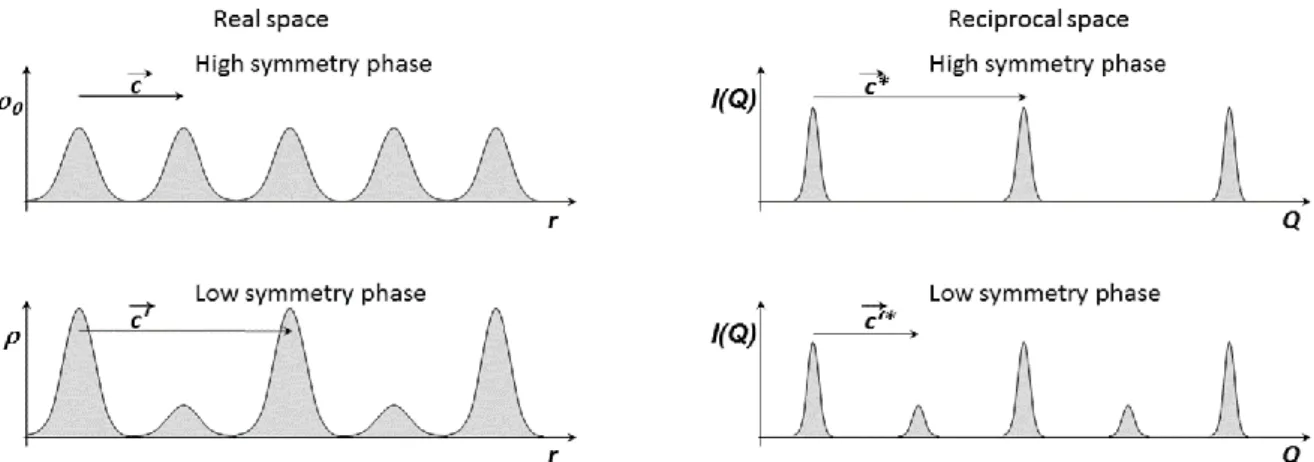
schematically how the (electronic) density changes for a cell doubling: in the low symmetry phase the spatial density is modified with respect to the high symmetry. The doubling of the translational symmetry in real space gives rise to additional Bragg peaks: since 𝑐′∗=1
2𝑐
∗, the Bragg peaks of the low symmetry phase are located on the nodes
of the lattice 𝑄⃗ = ℎ𝑎⃗⃗⃗⃗ + 𝑘𝑏∗ ⃗⃗⃗⃗ + (𝑙 +∗ 1
2)𝑐⃗⃗⃗ . Since h, k and l’ are integers, the superstructure peaks appear at the ∗
14
Figure 7: (left) Schematic representation of the structure factor on the crystalline sites, through the electronic density (r). In the high symmetry phase the crystal periodicity is c . In the lower symmetry phase where a cell doubling
occurs, the density (r) alternatively increases and decreases on the sites and the new perdiodicity is 2c . (Right) Corresponding diffracted intensity in the reciprocal space with periodicities c ∗ and c ′∗=1
2c ∗.
3.2.4 Local order and diffuse scattering
Molecular packing in crystals is not perfectly periodic: atoms move and molecular states may fluctuate in time and space. The instantaneous structure factor 𝐹𝑚(𝑄⃗ ) of a unit cell m at position 𝑅⃗ 𝑚 on the lattice, can be decomposed
into two terms: the average value in space and time < 𝐹(𝑄⃗ ) > of the crystal and the deviation ∆𝐹𝑚(𝑄⃗ ) of this unit cell m :
𝐹𝑚(𝑄⃗ ) =< 𝐹(𝑄⃗ ) > +∆𝐹𝑚(𝑄⃗ )
The X-ray scattering intensity by a crystal can then be decomposed in two terms: 𝐼(𝑄⃗ ) = 𝑁2|〈𝐹(𝑄⃗ )〉|2∑|𝛿(𝑄⃗ − 𝑄⃗ ℎ𝑘𝑙)| 2 ℎ,𝑘,𝑙 + 𝑁′∑〈∆𝐹 𝑛∗(𝑄⃗ )∆𝐹𝑛+𝑚(𝑄⃗ )〉 𝑚 𝑒−𝑖𝑄⃗ .𝑅⃗ 𝑚
The first one is associated with the Bragg diffraction by the average 3D periodic crystalline structure (structure factor < 𝐹(𝑄⃗ ) >), which was described above and is located on the nodes 𝑄⃗ ℎ𝑘𝑙 of the reciprocal lattice. The second term
is the diffuse scattering, which is more or less spread out within the reciprocal space, depending on the spatial extension of the local deviations ∆𝐹𝑚(𝑄⃗ ) over the different cells m. This diffuse scattering is located in the reciprocal
space on the Fourier-transforms of the spatial correlations function of ∆𝐹𝑚(𝑄⃗ ). Figure 8 shows how correlations
extending only along a single direction (𝑎 , 1D correlation) modulate the intensity of the diffuse scattering in the reciprocal space located in planes perpendicular to 𝑎 . If 𝑅⃗ 𝑚= 𝑛𝑎 the diffuse scattering is observed around 𝑄⃗ with
h integer.157,158 If 𝑅⃗
𝑚= 2𝑛𝑎 the diffuse scattering is observed 𝑄⃗ with coordinates h=n+1/2. The spatial extension of
15
Figure 8: (left) Schematic crystalline structure with an average structure factor F (black spheres in real space) repeating on a 3D periodic lattice, resulting in X-ray diffraction at the node of the reciprocal space (spheres, right). Fluctuation of the structure factor modifies the diffraction pattern and when local deviations (grey spheres) extend along one direction with a characteristic correlation length , diffuse planes are observed (light grey, right).
4. Structural dynamics of transition metal complexes in solution
Most of this section will be devoted to transition metal (TM) complexes because they have been and still are the most commonly investigated molecular systems by time resolved hard X-ray methods. Indeed, the presence of heavy elements (the metal atom) makes the use of hard X-ray for spectroscopic studies (XAS, XES, RIXS) necessary, but also an advantage as there is no need for vacuum. At the same time, these elements have large scattering cross-section making them also preferable for XRS or XRD.
Photoexcitation of a TM complex in solution triggers a wide range of phenomena that include: intramolecular electronic-vibrational relaxation, spin transitions, bond breaking and forming, reactivity with the solvent species, solvation dynamics, etc., all of which bear electronic and structural signatures. In the following, we will dwell with examples of systems that have been carried out using the methods described in §§ 3. Whenever possible, emphasis will be placed on those processes and phenomena that have been simultaneously investigated using both X-ray scattering and X-ray spectroscopic methods.
4.1 Intramolecular Charge Transfer
Photoinduced electron transfer (ET) is among the most common process in metal-based molecular complexes, and its understanding is essential for efficient storage and conversion of solar energy into chemical or electrical energy. The doorway to these processes are often the metal-to-ligand-charge-transfer (MLCT) or Ligand-to-metal-charge-transfer (LMCT) states, whose absorption bands dominate the visible spectrum. Because of the intramolecular charge transfer, there is significant change of the electronic structure of the constituents of the molecule, especially, the metal atom that becomes oxidised or reduced. This clearcut (from the point of X-ray spectroscopy) change is the reason why these processes were the first to be investigated by time-resolved X-ray absorption spectroscopy. Indeed, the first example of the sort was a XAS study with 70 ps time resolution at the Ru L2,3-edge of the
photoexcited aqueous Ruthenium(II)-tris-2,2’-bipyridine ([RuII(bpy)
3]).91,159 In the ground state spectrum of the
complex, the predominantly octahedral field of the complex splits the d-orbitals into a lower t2g orbital and an upper
eg orbital (Figure 9 left). All six 4d electrons of Ru2+ are in the lower t2g orbital while the eg orbital is empty. Upon
excitation of the 1MLCT state, an electron is transferred from the metal t
2g orbital to the bpy ligand, populating the
long-lived (~600 ns) 3MLCT state160 and opening up a new channel for a (2p-4d(t
2g)) core transition. In refs 91,159,
16
the oxidation state change from Ru2+ to Ru3+; ii) the appearance of a new resonance at the 2p-4d(t
2g) transition,
due to the hole created in the t2g orbital. These features were analysed by the ligand field multiplet theory,159 in very
good agreement with the experimental data. From the change of ligand field splitting between ground and excited state and using an electrostatic model that relates the octahedral ligand field splitting to the metal-ligand distance,161
a Ru-N bond contraction of ~0.02 Å in the excited state was derived, while the analysis of the EXAFS region122
delivers a value of the Ru-N bond contraction of ~0.04 Å, treating all Ru-N distances equally (i.e., in D3 symmetry).
These were later further supported by the analysis of the XANES.162 These results are in line with the low
temperature spectroscopic studies of the MLCT state.163 These results about the excited state structure are
confirmed by Quantum chemical calculations.164,165 Later, several picosecond Ru L- and K-edge studies upon
excitation of the 1MLCT state of different Ru polypyridyl complexes reported similar trends.166-170
Figure 9: (left) Representation of the occupancy of ligand-filed split d-orbitals for a d6 octahedral complex. (right)
Schematic potential curves of [FeII(bpy)
3] along the Fe-N bond. Reprinted with permission from ref. 171. Copyright
2010 John Wiley and Sons.
More significant in terms of dramatic nuclear structure changes upon a photoinduced intramolecular CT is the case of Cu(I)-diimine complexes. Indeed, upon transfer of an electron to the ligand, a significant structural change from a tetrahedral geometry to a flat one occurs (Figure 10a). Chen and co-workers172-174 investigated the structure of
the MLCT states of such complexes, in particular ([CuI(dmp)2]+ (dmp=2,9-dimethyl-1,10-phenanthroline)), by ps
XAS. Upon 400 nm photoexcitation, one reaches the S2 state, which decays on an ultrafast time scale to the S1
state172,175-177 followed by relaxation to the T
1 state. Chen and co-workers observed the photoinduced electronic
and structural changes by ps XANES and EXAFS and concluded that: (i) the excitation of the MLCT state induces an electronic configuration change from CuI (3d10) to CuII (3d9); (ii) the inner-sphere reorganization changes the
coordination number of the MLCT state from four to five in toluene, which is presumed to be non-coordinating; (iii) the average Cu-ligand bond lengths increased in the MLCT state in toluene, but decreased in acetonitrile, reflecting the difference in the interactions of the copper with the fifth ligand. The conclusion of solvent coordination was supported by simulations of the XANES spectra.178
An interesting question that arises in certain complexes, with strong mixing of metal-halogen orbitals, such as halogenated Rhenium ones, is the issue of the charge transfer from the metal to the ligand, do the halogen orbitals also take part in the electronic rearrangement? While time-resolved Raman and IR data do point to it being the case,179180, a direct proofs of a 2-centre electron transfer has been lacking. With the unambiguous sensitivity of
XAS to oxidation states, the Chergui group confirmed the scenario of electron density being transferred from both the halogen and the Rhenium atom to the bpy ligand in the case of Rhenium-halogen carbonyl polypyridine complexes.181 The experiment was carried out with 70 ps resolution and fs experiments or maybe also attosecond
17
Figure 10: (a) ground state structure (left) and 3MLCT excited state structure (right) of [Cu(dmp)
2]+. An acetonitrile
molecule pointing towards the Cu atom is added on top of the molecule. (b) static (black) and transient Cu K-edge spectrum of the molecule recorded at 50 ps time delay. (c) Simulated pre-edge transient spectrum (red, singlet minus triplet) using TD-DFT in comparison with the experimental transient (black). Inset is the molecular orbital for the transitions with the largest oscillator strengths for A′. Reprinted with permission from Reference 182. Copyright
2013 American Chemical Society.
The issue of solvent coordination dates back to the works of McMillin and co-workers who studied the luminescence lifetimes of such complexes and found it to be significantly shortened in donating solvents (i.e., those behaving as Lewis bases), such as acetonitrile (MeCN), compared to non-donating solvents, such as dichloromethane (DCM) that showed one to 2 orders of magnitude longer lifetimes (∼100 ns).183 They attributed this quenching to
complexation of a solvent molecule, most likely at the metal centre of the molecule. In order to further investigate this hypothesis, the Chergui group undertook a ps XAS study of [Cu(dmp)2]+ in MeCN and DCM along with optical
and theoretical studies.182,184,185
Figure 10b (black line) shows the steady-state Cu K-edge XANES of the complex in MeCN. The weak A feature just below 8.98 keV is a quadrupole 1s-3d pre-edge transition but it also contains a ligand contribution, as explained below. The B band is assigned to the 1s→4p transition. The C and D features are above-ionization potential (IP) XANES features, due to multiple scattering. The transient signal in MeCN at a time delay of 50 ps for [Cu(dmp)2]+
solvated is also shown in Figure 10b. A weak positive feature appears near the position of the A due to the hole that is created in the highest occupied molecular orbital (HOMO) by photoexcitation.186 At higher energies there are
strong negative and positive features in the region of the B to D features. Also, the transients turned out to be very similar MeCN and DCM. In fact, the intensity loss of the B feature, which was taken as evidence of exciplex formation,177,178 can simply be explained in terms of the oxidation shift of the system from Cu(I) to Cu(II),182 as in
the case of Ruthenium complexes discussed above.
In ref. 182, the A and B features of the ground state spectrum were analyzed using TD-DFT. The A feature is
dominated by transitions into the lowest unoccupied molecular orbital (LUMO) and LUMO+1 orbitals. These are mainly (∼97% ) comprised of electron density located on the ligand atoms, which explains its weak intensity, as this transition draws its oscillator strength via a weak mixing with the Cu 4p orbitals. In contrast, the B feature corresponds to excitations into molecular orbitals and due to their proximity to the continuum, they are rather diffuse, but this feature contains a larger 4p (dipole-allowed) contribution. Figure 10c compares the pre-edge experimental transient at 50 ps and results of the TD-DFT calculated difference spectrum of the triplet electronic structure minus the ground-state spectrum. The features present in the experimental transient are reproduced both in terms of energy and relative intensity. In particular, the new (positive) A′ feature arises, as expected, from a transition into the electron hole at the HOMO created by photoexcitation. Since the HOMO is dominated by the Cu 3d-character,182
18
was supported by calculations of the radial distribution functions (RDFs) from a classical molecular dynamics simulation for both the ground and lowest 3MLCT states of the complex in both solvents. Further support came from
a QM/MM simulation, showing that no bound exciplex forms between the solvent molecules and the complex. Rather, the solvent-dependent lifetimes of [Cu(dmp)2]+ were rationalized in terms of the energy gap between the
ground and 3MLCT states.182 The lifetime also depends on the spin−orbit-coupling, which itself is affected by the
dihedral angle, and on the energy gap between the 1MLCT and 3MLCT states.
This system turned out to be an ideal one to investigate the correlated charge, nuclear and spin dynamics in TM complexes. Indeed, ultrafast optical studies by the Tahara group have revealed a rich vibrational wave packet pattern upon excitation of the singlet MLCT state.187,188 In this respect, Tavernelli and co-workers have carried
detailed quantum dynamical184 and wave packet dynamics simulations185 that could be translated into fs XAS
signals for future XFEL experiments.
4.2 Photoinduced spin cross-over dynamics
One of the fascinating features of Fe2+-, Fe3+- and Co2+-based molecular complexes is their ability to change from
the low (LS) to the high (HS) spin state at thermal equilibrium under the effect of temperature, pressure or irradiation, and have for that matter been named spin cross-over complexes (SCO).189,190 The light induced SCO has been
coined Light-Induced Excited Spin-State Trapping (LIESST),191 and the HS to LS process, reverse-LIESST.192
These dramatic (S=2) spin transitions are interesting for applications in magnetic data storage/optical reading but also of direct relevance to biology, since the active site of hemoproteins are Fe(II)- or Co(II)-based porphyrins that undergo similar spin change during their biological functions (see § 6).
In the predominantly octahedral field due to the ligands (Figure 9), all electrons are in the lower t2g sub-shell in the
low spin (LS) ground state, while transferring electrons to the eg orbitals increases the spin state. Because the eg
orbitals derive from the dx2-y2 and dz2 orbitals, they are antibonding in 6-fold coordinated complexes, which leads to
a striking metal-ligand bond elongation in the high spin (HS) state. Studies of the LS to HS photoswitching were intensely carried out in solution using optical methods. McGarvey and Lawthers reported that the equilibrium between the spin states of iron(II) spin-crossover complexes in solution near RT can be photophysically perturbed via irradiation into the strong spin and parity allowed metal-ligand charge transfer (1MLCT) absorption bands of the
low-spin (LS) species.193 The intersystem crossing (ISC) dynamics was then explored with the use of
complementary probes, sensitive to different degrees of freedom, which strongly help investigating both ultrafast electronic and structural dynamics.97,113,192,194-198
A generic diagram of the potential energy curves of the various states of Fe(II)-based complexes is shown in Figure 9, as a function of the Fe-N bond length, which is supposed to be the reactive coordinate of the spin transition.171
The MLCT states have nearly the same equilibrium distance as the ground state, in agreement with the results on Ru(II) complexes discussed above,159 while the ligand field states 1,3T, 5T and 5E have their equilibrium distances
elongated by ~0.1 Å, ~0.2 Å, and ~0.3 Å, respectively, relative to the ground state bond distance. Light excitation into the singlet Metal-to-Ligand-Charge-Transfer (1MLCT) state or to the lower-lying ligand field states leads to
population of the lowest quintet state 5T
2 with unity quantum yield.189 The lifetime of the latter varies by several
orders of magnitude as a function of ligand and temperature189 with [FeII(bpy)
3] having the shortest lived quintet
state lifetime (650 ps) at RT. Structural studies by X-ray diffraction or X-ray absorption spectroscopy under quasi steady-state conditions, confirmed the ~0.2 Å elongation of the Fe-N bond for Fe(II)-based complexes with long-lived HS states199-201 but the question arose if this applies to the shortest lived HS state of [FeII(bpy)
3], as predicted
by theory.202
Khalil et al203 and Gawelda et al96 captured the structure of the quintet state after laser excitation using 70 ps hard
X-ray pulses probing the structure changes at the K edge of Iron. In the first case, the system was [FeII(tren(py)) 3]
in acetonitrile, which has a quintet state lifetime of 60 ns, while in the second case, it was [FeII(bpy)
3], onto which
we hereafter focus our discussion as this system has emerged as the test bed for all new ultrafast X-ray methods on molecular systems. Figure 11 shows the Fe K-edge XANES of the molecule in the LS ground state (a), the transient (difference) spectrum at 50 ps time delay (b) and the XAS spectrum of the HS quintet state (a), as retrieved from the ground state and the difference spectra and from the photolysis yield determined in laser-only experiments (and convoluted to match the much longer x-ray probe width). The structural analysis of the excited state was based on fitting both the transient XANES96 and the transient EXAFS spectra.62,204 These confirmed that the Fe-N bond
elongation is RFe-N=0.20 Å, and is nearly the same in the HS state of all Fe(II) complexes, regardless of the HS
lifetime,199,203 implying that the latter is not determined by the Fe-N bond distance. Rather, the adiabatic energy and
the coupling parameters between LS and HS state are the crucial parameters. Indeed, of all Fe(II)-SCO complexes, [FeII(bpy)


![Figure 6: Pt L 3 -edge RIXS measurements of the di-platinum complex [Pt 2 (P 2 O 5 H 2 ) 4 ] 4− measured in solution using a dispersive von Hamos spectrometer](https://thumb-eu.123doks.com/thumbv2/123doknet/14485735.525004/12.892.107.784.110.610/figure-measurements-platinum-complex-measured-solution-dispersive-spectrometer.webp)


![Figure 11: (a) static (black) Fe K-edge absorption spectrum of [Fe II (bpy) 3 ] and the spectrum in the high spin state (red data points) at 50 ps time delay, retrieved using the transient (red) in (b) and the ground state spectrum](https://thumb-eu.123doks.com/thumbv2/123doknet/14485735.525004/20.892.127.766.235.578/figure-static-absorption-spectrum-spectrum-retrieved-transient-spectrum.webp)
![Figure 13: Femtosecond X-ray scattering of [Co II (bpy) 3 ]. Time evolution of the Co-N bond lengths (black dots) retrieved from the fs XRS data](https://thumb-eu.123doks.com/thumbv2/123doknet/14485735.525004/22.892.125.742.448.901/figure-femtosecond-scattering-time-evolution-lengths-black-retrieved.webp)
![Figure 14: a) structure of the [Pt 2 (P 2 O 5 H 2 ) 4 ] 4 molecule and orbital scheme involving the excitation of a d to p orbital;](https://thumb-eu.123doks.com/thumbv2/123doknet/14485735.525004/23.892.211.750.237.727/figure-structure-molecule-orbital-scheme-involving-excitation-orbital.webp)
