Characterizing Hydration Properties Based on the
Orientational Structure of Interfacial Water Molecules
The MIT Faculty has made this article openly available. Please share how this access benefits you. Your story matters.
Citation Shin, Sucheol, and Adam P. Willard. “Characterizing Hydration
Properties Based on the Orientational Structure of Interfacial Water Molecules.” Journal of Chemical Theory and Computation 14, 2 (January 2018): 461–465 © 2017 American Chemical Society
As Published http://dx.doi.org/10.1021/ACS.JCTC.7B00898
Publisher American Chemical Society (ACS)
Version Original manuscript
Citable link http://hdl.handle.net/1721.1/120319
Terms of Use Article is made available in accordance with the publisher's
policy and may be subject to US copyright law. Please refer to the publisher's site for terms of use.
Characterizing Hydration Properties Based on the Orientational
Structure of Interfacial Water Molecules
Sucheol Shin and Adam P. Willard∗
Department of Chemistry, Massachusetts Institute of Technology, Cambridge, Massachusetts 02139, USA
Abstract
In this manuscript, we present a general computational method for characterizing the molecular structure of liquid water interfaces as sampled from atomistic simulations. With this method, the interfacial structure is quantified based on the statistical analysis of the orientational configurations of interfacial water molecules. The method can be applied to generate position dependent maps of the hydration properties of heterogeneous surfaces. We present an application to the characteri-zation of surface hydrophobicity, which we use to analyze simulations of a hydrated protein. We demonstrate that this approach is capable of revealing microscopic details of the collective dynamics of a protein hydration shell.
In the vicinity of a hydrated surface the properties of water can differ significantly from that of the bulk liquid [1]. These differences are determined by the details of the interfacial environment and they are thus sensitive to the specific chemical and topological features of the hydrated surface [2]. The details of water’s interfacial molecular structure, therefore, contain information about these surface features and how they affect their local aqueous environment [3]. This information is valuable because it provides insight into the collective molecular effects that control the solvation properties of complex solutes, but it is also diffi-cult to access due to limitations in our ability to measure and characterize water’s interfacial molecular structure.
Our current understanding of the interfacial molecular structure of liquid water is derived primarily from the results of interface sensitive experimental techniques such as vibrational sum frequency generation spectroscopy [4–8], THz absorption spectroscopy [9, 10], dynamic nuclear polarization [11], NMR [12, 13], and X-ray and neutron scattering [14–16]. Unfor-tunately, these experiments are typically more difficult to interpret than their bulk phase counterparts due to the constraints associated with achieving interface selectivity. This has driven an increased demand for theoretical developments that can facilitate the analysis and interpretation of these interface-sensitive experiments. Resulting efforts have relied heavily on the use of atomistic simulation to provide the molecular details of water’s interfacial structure.
Classical molecular dynamics (MD) simulations are a particularly efficient theoretical framework for modeling the microscopic properties of aqueous interfacial systems. These simulations provide a molecular-level basis for understanding the microscopic structure of liquid water and how it responds to the anisotropic environment of the liquid phase bound-ary. This response is mediated by the properties of water’s hydrogen bonding network and therefore involves the correlated arrangements of many individual water molecules. Char-acterizing this high-dimensional molecular structure in simple and intuitive terms can be a significant challenge, especially for solutes such as proteins that exhibit irregular or hetero-geneous surface properties.
Here we address this challenge by characterizing water’s interfacial molecular structure in terms of a low dimensional parameter that quantified its similarity to the structure of
various interfacial reference systems. We introduce a theoretical framework for quantifying this similarity based on the statistical analysis of molecular orientations at the interface. In this analysis reference systems serve to designate the unique orientational signatures of water interfaces at surfaces with specific well-defined chemical or topographical properties. The properties of these reference surfaces can be systematically chosen in order to analyze specific interfacial features that may be relevant to a particular system of study. This framework provides a physically insightful measure of interfacial structure that eliminates the need to formulate high-dimensional collective variables. Furthermore, by applying this framework across a variety of different reference systems, it can be adapted to report simultaneously on multiple specific interfacial properties.
The general formalism for our framework begins with the definition of the reference sys-tem(s) that will serve as a basis for interfacial characterization. Prior to applying this framework each reference system must be thoroughly sampled in order to establish its unique orientational molecular signature. We quantify this signature in terms of the molecular ori-entational distribution function,
f (~κ|ref) = P (~κ|ref)
P (~κ|bulk) , (1)
where P (~κ|ref) and P (~κ|bulk) denote the equilibrium probabilities for observing a molecule
with a specific molecular configuration, ~κ, within the given reference system ands in the bulk liquid respectively. We specify molecular configuration in terms of a three-dimensional
vector, ~κ = (cos θ1, cos θ2, a), where θ1 and θ2 denote the angles made between the local
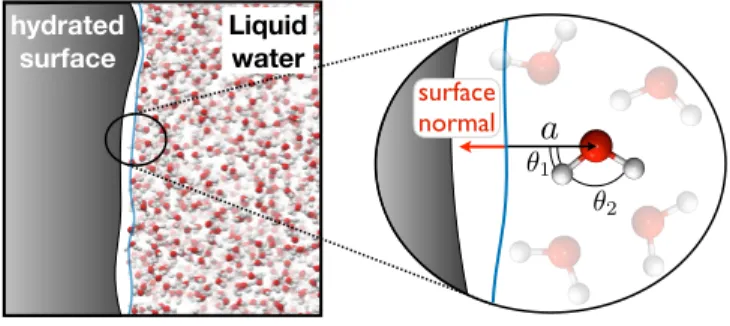
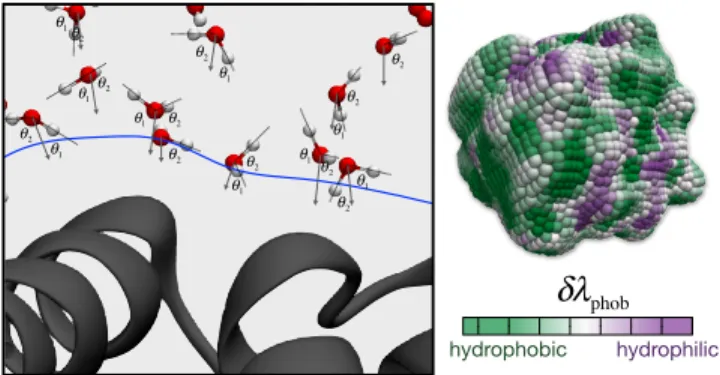
surface normal and each of a water molecule’s OH bond vectors, and a denotes the distance of the water molecule from the instantaneous position of the water interface. We define the instantaneous water interface following the procedure of Ref. [17]. This system of molecular coordinates is illustrated schematically in Fig. 1.
We characterize the interfacial molecular structure of of a particular interfacial system by
sampling values of ~κ and comparing them to the distribution function, f (~κ|ref). Specifically,
we compute the quantity,
λref = 1 N N X i=1 − ln [f(~κ|ref)] , (2)
a hydrated
surface Liquid water
✓2
✓1
surface normal
FIG. 1. A schematic illustration of the molecular coordinates that are used to specify the orienta-tional state, ~κ, of molecules at the liquid water interface.
where the summation is taken over a set of N molecular configurations sampled from the system of interest. This quantity reflects the likelihood for the sampled set of configurations to occur spontaneously within the environment of the reference system. This likelihood is
relatively large (corresponding to lower values of λref) when interfacial molecular structure is
similar to that of the reference system and relatively small (corresponding to higher values
of λref) when interfacial molecular structure differs from that of the reference system. In
this way, λref can be used to distinguish hydrated surfaces based on how they influence their
hydration environment, irrespective of their specific chemical or topographical properties. For heterogeneous surfaces, this framework can be applied locally to generate spatially
resolved maps of λref. This can be accomplished by restricting sampling of ~κ to specific
systematically controllable regions along the surface. A general expression for Eq. (2) that
can be used to compute λref at a specific position, ~rsurf, and time, t is given by,
λref(~rsurf, t) = 1 τ t+τ X t0=t − ln [f(~κ(~rsurf, t0)|ref)] , (3)
here ~κ(~rsurf, t0) is the orientational configuration of the water molecule that is closest to
position ~rsurf at time t0, and the summation is taken over a series of τ discrete time steps. The
value of τ in Eq. (3) can be varied to highlight average interfacial response to a heterogeneous surface (i.e., large τ ) or to highlight transient fluctuations in interfacial molecular structure (i.e., small τ ).
Early approaches to mapping the hydration properties of heterogeneous solutes, most notably those developed by Kyte and Doolittle, were based on a spatial decomposition
of surface chemistry [18], and have since been extended to provide higher resolution [19]. These approaches often fail to accurately predict solvation properties due to their neglect of transverse correlations within the water interface. More recent approaches have focused on water-based mapping methods. This includes approaches based on local density fluctuations [20, 21], single water chemical potentials [22], and local electrostatic fields [23]. Our method is complementary to these previous approaches and can be adapted, via the selection of different reference systems, to map a wide variety of interfacial properties.
We illustrate the performance of our method by applying it to characterize the hydropho-bicity of heterogeneous surfaces. To do this we use a single reference system as a basis for interfacial characterization – the liquid water interface at an ideal hydrophobic surface. The collective molecular arrangements that are common to this reference system are thus
specified by f (~κ|phob). As we demonstrate below, and in the Supporting Information (SI),
λphob is capable of distinguishing between the interfacial molecular structure of hydrophobic
and hydrophilic surfaces and can thus be treated as an order parameter for hydrophobicity.
As such, we use λphob, computed according to Eq. (3), to analyze water’s interfacial
re-sponse to heterogeneous surfaces. Since λphob is based only on water’s interfacial molecular
structure, it can be used to generate hydrophobicity maps that reveal the effective solvation characteristics of surfaces with complex or unknown properties.
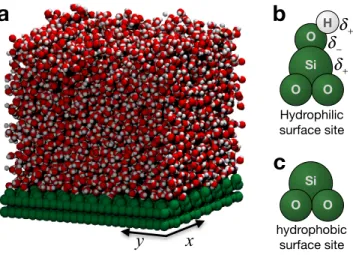
As a proof of concept, we apply our framework for interfacial characterization to a model silica surface with a patterned composition of hydrophobic and hydrophilic surface sites [24]. As illustrated in Fig. 2, the surface sites of this model can be either nonpolar (i.e., hydrophobic), if they are terminated with a neutral silica atom, or polar (i.e., hydrophilic), if they are terminated with a charged hydroxyl group. Artificial surfaces with well-defined surface patterns can be created by specifying the hydroxylation state of the surface sites.
We then use λphob to analyze water’s response to various surface patterns. We quantify this
response by computing δλref = λref − hλrefi0, where h· · · i0 denotes an equilibrium average
taken within the ensemble of configurations sampled directly from the reference system. In
this way, values of δλref ≈ 0 correspond to interfacial environments that resemble that of the
reference system. Further details about the simulations are described within the SI.
molec-x y Si O O hydrophobic surface site
a
b
c
Si O O O H Hydrophilic surface site δ+ δ− δ+FIG. 2. (a) A snapshot of a simulation of a periodically replicated slab of liquid water in contact with a 6× 6 nm2 model silica surface. (b) and (c) The chemical termination of the surface sites determines whether they are hydrophobic or hydrophilic.
ular response to hydrophobic and hydrophilic regions of a spatially heterogeneous surface.
Specifically, we have computed λphob, using Eq. (3), for points along an extended
hydropho-bic surface with a larger rectangular hydrophilic patch, as shown in Fig. 3a. For the data
plotted in Fig. 3b, λphob has been averaged over a long observation time of τ = 4 ns (40000
individual configurations). We observe that water’s average interfacial molecular structure exhibits spatial variations that mimic the chemical patterning of the underlying silica
sur-face. Over non-polar regions of the surface δλphob ≈ 0 (i.e., λphob ≈ hλphobi0), indicating
that interfacial molecular structure is similar to that of the hydrophobic reference system. Over polar regions of the surface δλphob > 0 (i.e., λphob >hλphobi0), indicating that water’s
interfacial response differs significantly from that of the reference system. Low amplitude
spatial modulations in λphob can be observed over both the polar and the non-polar regions
of the surface. These modulations reflect the corrugation of the atomic surface and thus indicate that this order parameter is sensitive to the subtle influence of surface topography on water’s interfacial molecular structure.
Transient fluctuations in local interfacial structure can be analyzed by computing δλphob
a
b
c
d
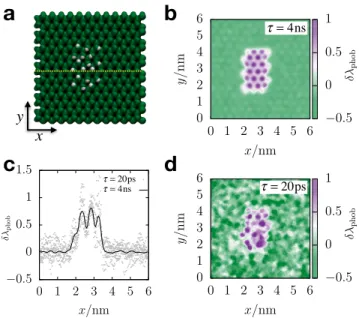
x y 0.5 0 0.5 1 1.5 2 0 10 20 30 40 50 60 phob x/nm 0.5 0 0.5 1 1.5 0 10 20 30 40 50 60 phob x/nm ⌧ = 20ps ⌧ = 2ns 0 1 2 3 4 5 6 0 1 2 3 4 5 6 y/ nm x/nm 0.5 0 0.5 1 τ = 20ps 0 1 2 3 4 5 6 0 1 2 3 4 5 6 y/ nm x/nm 0.5 0 0.5 1 τ = 4ns 0.5 0 0.5 1 1.5 0 10 20 30 40 50 60 phob x/nm ⌧ = 20ps ⌧ = 2ns 0.5 0 0.5 1 1.5 0 10 20 30 40 50 60 phob x/nm ⌧ = 20ps ⌧ = 2ns τ = 4ns τ = 20ps 0.5 0 0.5 1 1.5 0 1 2 3 4 5 6 p h ob x/nmFIG. 3. (a) A snapshot of the water exposed face of a model silica surface featuring a hydrophilic patch against a hydrophobic background. (b) and (d) A plot of δλphob, indicated by shading,
computed for points along the surface of the structure shown in Panel (a). The data in Panels (b) and (d) reflects an average over an observation time of τ = 4 ns and τ = 20 ps, respectively. (c) A plot of the value of δλphob computed along a line at y = 3 nm (the yellow dotted line in Panel (a))
that highlights how interfacial molecular structure is affected by the patch boundary. Grey points are values of δλphob, computed with τ = 20 ps, sampled at different points in time and the solid
line is δλphob computed with τ = 4 ns.
Fig. 3a using a value of τ = 20 ps (100 individual configurations). The use of a shorter observation time highlights the transient details of water’s interfacial molecular structure.
Thus, by comparing local values of δλphob over multiple consecutive snapshots it is possible
to observe the transient fluctuations of interfacial molecular structure and investigate how they depend on the details of local surface chemistry and topology. The dynamic range of
δλphob within the hydrophobic reference system is described in the SI.
Water molecules that reside over the boundaries between polar and non-polar regions of the surface experience a laterally anisotropic aqueous environment. In these regions,
takes on values that are intermediate between that of the extended polar and non-polar
surfaces. The characteristics of δλphob in these boundary regions reveal details about the
molecular correlations that mediate interactions along liquid water interfaces, and how these correlations are influenced by the details of surface-water interactions.
In the case of the model silica surface we observe that the effect of the polar/non-polar surface boundary on the interfacial molecular structure is local, limited to the region directly
above the surface boundary. A cross-section of δλphob that cuts through the center of the
hydrophilic surface patch is plotted in Fig. 3c. This plot reveals that the influence of a large hydrophilic surface patch on water’s interfacial molecular structure only extends about one molecular diameter beyond the edge of the patch. Evidently, in this case any long-ranged transverse correlations due to heterogeneous surface chemistry are not supported by distortions of the interfacial molecular structure. We present results for a variety of different surface patterns in the supporting information (SI).
The results presented in Fig. 3 verify that δλphob is effective as a local order parameter
for surface hydrophobicity. This order parameter can thus be used to infer the effective hydration properties of an unknown aqueous surface. For the model silica surfaces the
heterogeneity in surface chemistry is mirrored by the spatial dependence of δλphob, however,
for more complex surfaces, the relationship between surface structure and δλphob is not so
straightforward. When this is the case, δλphobcan provide valuable physical insight into the
relationship between surface heterogeneity and local hydration properties.
The complex heterogeneous surface properties of hydrated proteins are reflected in the water’s spatial dependence on interfacial molecular structure. Figure 4 illustrates that this
spatial dependence can be revealed with δλphob. Specifically, Fig. 4 illustrates the value
of δλphob computed along the surface of the inactive CheY protein (PDB code: 1JBE) [25]
using Eq. (3) and a value of τ = 10 ps. This map of δλphob indicates regions of the protein
surface whose interactions with water result in hydrophobic (i.e., green shaded regions) or hydrophilic (i.e., purple shaded regions) interfacial molecular structure.
Details of these protein surface maps, such as the position and shapes of the hydrophilic domains, are sensitive to the conformational fluctuations of the protein. This is illustrated
a
b
c
-0.5 1 0 0.5 δλphob 0 25 50 75 100 0 2 4 6 8 10 su rface resi d u e t/ns 0.4 0.2 0 0.2 0.4 0.6 0.8 1 2.5ns 5ns 7.5ns 10ns TimeFIG. 4. (a) A simulation snapshot of the CheY protein. Water molecules are omitted for clarity. (b) A map of δλphobcomputed for points along the surface of the protein using τ = 10 ps. Color scale
is identical to that in Fig. 3b,d. (c) Spatial maps of δλphob for a series of protein conformations
spaced out along a 4 ns trajectory.
sequence of conformations. The dynamics of interfacial structure can be further analyzed
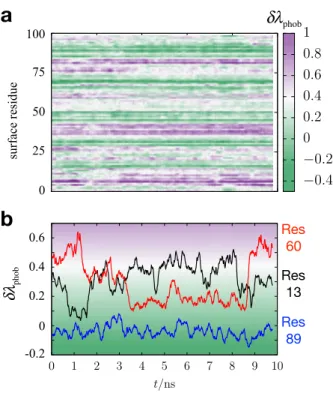
by considering the time dependence of δλphobfor individual surface residues. Figure 5 shows
the result of such a calculation performed along a 10 ns trajectory of the CheY protein. We observe that the interfacial structure in some regions of the protein remains relatively static, as indicated by persistent green or purple bands in Fig. 5a, while other regions of the protein exhibit interfacial structure that fluctuates significantly in response to protein conformational dynamics.
The ability to map the hydration dynamics of fluctuating irregular solutes is a unique feature of this interfacial characterization method. Of course, this method is not limited to the applications presented above. For instance, the approach can be easily extended to report on additional hydration properties with the use of different reference systems, such as systematically charged surfaces or those with specific curvature, or by expanding the defini-tion of ~κ, for example to include dynamical informadefini-tion. Nor is the general approach limited to extended liquid water interfaces. The examples described here simply demonstrate the type of insight that can be derived from analyzing the orientational properties of interfacial water molecules.
0 25 50 75 100 0 2 4 6 8 10 su rface resi d u e t/ns 0.4 0.2 0 0.2 0.4 0.6 0.8 1 0 25 50 75 100 surfa ce re si due 0 25 50 75 100 0 2 4 6 8 10
surfaceresidue
t/ns 0.4 0.2 0 0.2 0.4 0.6 0.8 1 0.2 0.1 0 0.1 0.2 0.3 0.4 0.5 0.6 0.7 0 1 2 3 4 5 6 7 8 9 10 p h ob t/ns -0.2 0 0.2 0.4 0.6 δλp h o b Res 60 Res 13 Res 89 δλphoba
b
FIG. 5. (a) A time series plot of δλphob, indicated by shading, as computed for individual surface
residues of the CheY protein. In this plot, each row corresponds to a unique surface residue. (b) A plot highlighting of the dynamics of δλphob for three specific surface residues.
ACKNOWLEDGEMENT
We acknowledge useful discussions with Professor John Weeks and Professor Gerhard Hummer. This work was supported by the National Science Foundation under CHE-1654415 and also partially (SS) by the Kwanjeong Educational Foundation in Korea.
[1] K. B. Eisenthal, Chemical reviews 96, 1343 (1996).
[2] D. Qu´er´e, Annual Review of Materials Research 38, 71 (2008).
[3] A. Verdaguer, G. M. Sacha, H. Bluhm, and M. Salmeron, Chemical reviews 106, 1478 (2006). [4] Q. Du, R. Superfine, E. Freysz, and Y. R. Shen, Physical Review Letters 70, 2313 (1993).
[5] M. Schleeger, Y. Nagata, and M. Bonn, The Journal of Physical Chemistry Letters 5, 3737 (2014).
[6] P. C. Singh, The Journal of chemical physics 137, 094706 (2012).
[7] S. Baldelli, C. Schnitzer, and D. Simonelli, The Journal of Physical Chemistry B 106, 5313 (2002).
[8] D. E. Gragson, B. M. McCarty, and G. L. Richmond, Journal of the American Chemical Society 119, 6144 (1997).
[9] V. Conti Nibali and M. Havenith, Journal of the American Chemical Society 136, 12800 (2014).
[10] S. Ebbinghaus, S. J. Kim, M. Heyden, X. Yu, U. Heugen, M. Gruebele, D. M. Leitner, and M. Havenith, Proceedings of the National Academy of Sciences 104, 20749 (2007).
[11] B. D. Armstrong and S. Han, Journal of the American Chemical Society 131, 11270 (2009). [12] G. Otting and K. Wuethrich, Journal of the American Chemical Society 111, 1871 (1989). [13] G. Otting, E. Liepinsh, and K. W¨uthrich, Science (New York, N.Y.) 254, 974 (1991). [14] D. I. Svergun, S. Richard, M. H. J. Koch, Z. Sayers, S. Kuprin, and G. Zaccai, Proceedings
of the National Academy of Sciences 95, 2267 (1998).
[15] F. Bruni, M. A. Ricci, and A. K. Soper, The Journal of chemical physics 109, 1478 (1998). [16] G. Luo, S. Malkova, J. Yoon, D. G. Schultz, B. Lin, M. Meron, I. Benjamin, P. Vanysek, and
M. L. Schlossman, Science (New York, N.Y.) 311, 216 (2006).
[17] A. P. Willard and D. Chandler, The Journal of Physical Chemistry B 114, 1954 (2010). [18] J. Kyte and R. F. Doolittle, Journal of molecular biology 157, 105 (1982).
[19] L. H. Kapcha and P. J. Rossky, Journal of molecular biology 426, 484 (2014). [20] D. T. Limmer and A. P. Willard, Chemical Physics Letters 620, 144 (2015).
[21] A. J. Patel, P. Varilly, D. Chandler, and S. Garde, Journal of statistical physics 145, 265 (2011).
[22] T. Young, R. Abel, B. Kim, B. J. Berne, and R. A. Friesner, Proceedings of the National Academy of Sciences 104, 808 (2007).
[24] N. Giovambattista, P. G. Debenedetti, and P. J. Rossky, The Journal of Physical Chemistry C 111, 1323 (2007).
θ1 θ2 θ1 θ2 θ1 θ2 θ2 θ1 θ2 θ1θ2 θ2 θ1 θ1 θ2 θ2 θ1 θ2 θ2 θ1 0 1 2 3 4 5 6 01 2345 6 y/nm x/ nm 0 .4 0.2 0 0 .2 0.4 0.6 0.8 1 δλphob hydrophilic hydrophobic