HAL Id: hal-02925956
https://hal.archives-ouvertes.fr/hal-02925956
Submitted on 31 Aug 2020HAL is a multi-disciplinary open access archive for the deposit and dissemination of sci-entific research documents, whether they are pub-lished or not. The documents may come from teaching and research institutions in France or abroad, or from public or private research centers.
L’archive ouverte pluridisciplinaire HAL, est destinée au dépôt et à la diffusion de documents scientifiques de niveau recherche, publiés ou non, émanant des établissements d’enseignement et de recherche français ou étrangers, des laboratoires publics ou privés.
chemical analysis by X-ray fluorescence microscopy
Cyrill Bussy, Julien Cambedouzou, Sophie Lanone, Emilie Leccia, Vasile
Heresanu, Mathieu Pinault, Martine Mayne-L'hermite, Nathalie Brun,
Claudie Mory, Marine Cotte, et al.
To cite this version:
Cyrill Bussy, Julien Cambedouzou, Sophie Lanone, Emilie Leccia, Vasile Heresanu, et al.. Carbon nanotubes in macrophages: imaging and chemical analysis by X-ray fluorescence microscopy. Nano Letters, American Chemical Society, 2008, 8 (9), pp.2659-2663. �10.1021/nl800914m�. �hal-02925956�
Carbon nanotubes in macrophages: imaging and
chemical analysis by X-ray fluorescence microscopy
Cyrill Bussy 1,2*, Julien Cambedouzou 1,*, Sophie Lanone 2, Emilie Leccia 1, Vasile Heresanu 1, Mathieu Pinault 3,
Martine Mayne-l’Hermite 3, Nathalie Brun1, Claudie Mory1, Marine Cotte 4, Jean Doucet 1, Jorge Boczkowski 2,5,#, Pascale Launois 1,#
1 Laboratoire de Physique des Solides, UMR 8502 CNRS, Université Paris Sud, Bât. 510, Orsay, F-91405, France.
2INSERM, Unité 700, Paris, F-75018, France ; Université Paris Diderot/Paris 7, Faculté de Médecine Paris 7, site X. Bichat, Paris, F-75018, France.
3Laboratoire Francis Perrin, URA CEA-CNRS 2453, DSM-IRAMIS-SPAM, CEA Saclay, F-91191 Gif-sur-Yvette, France.
4 European Synchrotron Radiation Facility, BP 220, Grenoble, F-38043, France.
5 Assistance Publique-Hôpitaux de Paris, CIC 07, Hôpital Bichat, Paris, F-75018, France.
# equally contributed to this work
*Corresponding authors:
Phone: (+331 6915 6051) - Fax: (+331 6915 6086)
Email: [email protected] – [email protected]
Table of Contents Graphic
ABSTRACT
X-ray fluorescence microscopy (µXRF) is applied for the first time to study macrophages exposed to unpurified and purified single-walled (SW) and multi-walled (MW) carbon nanotubes (CNT). Investigating chemical elemental distributions allows one: (i) to image nanotube localization within a cell, (ii) to detect chemical modification of the cell after CNT internalization. An excess of calcium is detected for cells exposed to unpurified SWCNT and MWCNT and related toxicological assays are discussed.
Carbon nanotubes (CNT) are considered as promising new tools in many different fields1,
including nanomedicine2. Due to the increase of their worldwide industrial production, a growing
concern about their potential health impacts emerges and first evidences of biological effects of carbon
nanotubes in vivo and in vitro have been recently reviewed in refs.3-8. But basic research on interactions
of CNT with cells is still needed. The present study isplaced in an occupational health context, in case
of accidental CNT exposure of manufacturing workers. Consequently, we use non functionalized CNT
that reflect CNT produced for different industrial applications.
A first challenging issue is to know whether these materials enter or not into cells. Optical
microscopy observations of single-walled (SW) CNT are intrinsically limited by the spatial resolution,
while low contrast of carbon-based nanotubes makes electron microscopy observations very difficult for
dispersed SWCNT9 in a carbon-rich cellular environment. SWCNT have also been detected in biological
media through their near-infrared intrinsic fluorescence10-12. However, the method is limited to
individually dispersed semi-conducting nanotubes13, while as-produced SWCNT are usually assembled
in bundles and are either semi-conducting or metallic.Incorporation of CNT inside cells can more easily
be detected by marking them with imaging agents14-15, but these agents may alter biological effects16-18.
An alternative approach is to trace CNT in cells by detecting the catalyst metal particles employed in
most synthesis techniques and finally remaining attached to or contained in nanotubes. Catalytic
particles have recently been imaged using their magnetic resonance properties11. However, spatial
resolution was only of a few hundred of m2, which does not allow intra-cellular analysis. A second
issue is to have information about cell modifications after contact with CNT. Indeed, data have been
published showing oxidative stress and inflammation19,20 but information is still lacking concerning
underlying mechanisms.
Aiming at providing new data on cell-CNT interactions, we investigated this issue using X-ray
correlations across the cell since distributions of various elements are collected simultaneously, with
sub-cellular spatial resolution and high sensitivity21-27. Obtained results consist in a two-dimensional
projection of the volumetric distribution of elements in a whole cell. Analysis of the fluorescence signal
of catalyst metal particles bound to nanotubes can provide information about CNT cellular localization
without making complete dispersion of these nanomaterials in surfactants and without using
supplementary marker, which may alter interactions between CNT and cells. Therefore, µXRF can allow
investigating interaction of cells with nanotubes exhibiting characteristics as close as possible to those
found in production plants or research laboratories. Furthermore, modifications in cell constitutive
elements can give precious indications about underlying mechanisms of cell responses to these
materials. To the best of our knowledge, the µXRF method, newly used in biology and toxicology, has
never been applied before to analyze cell-CNT interactions. The purpose of this letter is to demonstrate
the relevance of µXRF to study the biological effects of carbon nanotubes on cells. We will first show
that this technique possesses enough sensibility to detect CNT in cells, even for very low concentrations
of catalyst, and then that it has the unique advantage of allowing detecting changes in the distribution of
chemical elements in cells after exposure to nanotubes.
In this study, we consider murin macrophages exposed to SWCNT or to multi-walled (MW)
CNT, the choice of macrophage cells being dictated by their key role in host responses to exogenous
agents (cell culture monolayer is exposed to suspensions of CNT sonicated in serum-free cell culture
medium; see Supplementary Information for details). MWCNT used are produced by Catalytic
Chemical Vapor Deposition (CCVD) following a procedure described elsewhere28,29, and further treated
by high energy sonication (see also Supporting Information). This treatment leads to CNT breakage: as
shown by High Resolution Transmission Electron Microscopy (HRTEM), their length, initially of about
150 m, is in the [1-6] µm range and nanotube tips are often opened (inset Fig. 1A/b). MWCNT are straight, their external diameter is in the [10-120] nm range with most of the tubes in the [30-70] nm
range. Residual iron-based catalyst particles are partially filling the CNT inner core (Fig. 1A/b). The
used SWCNT of both “unpurified” and “purified” (NP-SWCNT and P-SWCNT respectively) grades
synthesized using the ‘HiPCO’ process30 and purchased from CNI Corporation. In both SWCNT grades,
iron is present in the form of nano-particles at the end and on the side-walls of nanotubes (inset Fig.
1A/d and f), the number of iron particles being much higher in NP- than in P-SWCNT (Fig. 1A/c,d vs.
1A/e,f). Iron content measured by TGA is of about 20.8 and 1.8 wt% in NP- and P-SWCNT
respectively. The individual diameter is in the [0.8 - 1.2] nm range and the individual length is in the
[100 - 1000] nm range. We underline that no free iron-based particles were observed in any of our
samples, which is the prerequisite of our strategy of tracing CNT by detecting catalyst metal particles
(see also Supplementary Information, figure S1).
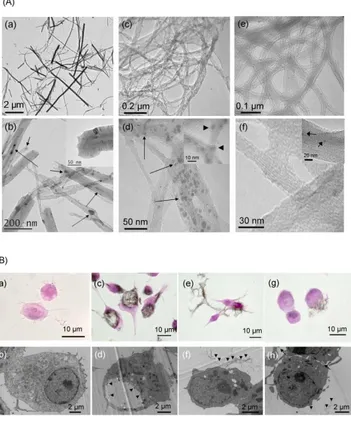
Figure 1. (A) HRTEM images of: (a) and (b) MWCNT, (c) and (d) NSWCNT, (e) and (f)
P-SWCNT. (b): Arrows show iron-based catalyst particles inside MWCNT hollow core; inset shows that
nanotube tips are often open consecutively to the sonication treatment. (c-f): SWCNT (NP- and P-) are
side-walls of nanotubes (arrows in d and f, arrow-heads in inset d). After purification process (e, f), most
of the iron nanoparticles (arrows) were removed as compared to the as-produced material (c, d). (B)
Morphological and ultrastructural images of murin macrophages exposed to CNT, obtained by optical
microscopy after hematoxylin-phloxin stain (a, c, e and g) or by TEM (b, d, f and h). (a, b):
Non-exposed control macrophages. (c, d): Macrophages Non-exposed to 10µg/mL of MWCNT for 24h. (e, f):
Macrophages exposed to 10µg/mL of NP-SWCNT for 24h. (g, h): Macrophages exposed to 10µg/mL of
P-SWCNT for 24h. In optical microscopy images, black regions indicate the presence of nanotubes (c, e
and g). In TEM images, arrow-heads indicate the CNT localization (d, f and h), inside and typically
close to the vacuole membrane for MWCNT exposure (d), or outside the cell for both NP- (f) and P- (h)
SWCNT. Arrows in (h) point towards short P-SWCNT bundles.
Figure 1B shows typical optical microscopy and conventional TEM images of control and
CNT-exposed cells. Details of the exposure procedure can be found in the Supporting Information. After 24h
of exposure, MWCNT are mainly engulfed into vacuoles that can occupy most of the cell surface
cytoplasm (Fig. 1B/c, d), as previously shown19. By contrast, for the same concentration, such
phenomenon is only occasionally observed in the case of NP-SW and P-SWCNT-exposed cells (fig.
1B/f, h and data not shown).
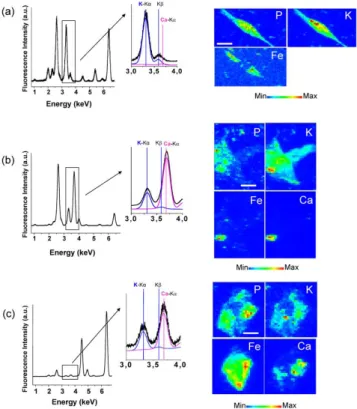
Figure 2 shows fluorescence spectra and elemental maps of a control cell obtained using µXRF.
Phosphorus (P) and potassium (K) are constitutive elements of cells and their spatial repartition
delimitates the cell shape. The P and K-rich zones in the central part of the cell can be attributed to the
nucleus. Na and Cl concentrations follow the cell shape. Other element maps (Ti, Cr, and Fe) show a
Figure 2. X-ray microfluorescence spectra integrated over the whole scanned area of a typical control
cryo-fixed macrophage. Positions of Kfluorescence peaks of sodium, phosphorus, chlorine, potassium, titanium, chromium and iron are indicated. Zoomed areas around the positions of the K and K
fluorescence peaks of potassium and of the K peak of calcium are shown, together with fits of the potassium and calcium contributions, in blue and in purple, respectively. Elemental maps of phosphorus,
potassium, sodium, chloride and iron are drawn. The color scale is a temperature scale, ranging from
blue for low concentration in the element of interest to red for high concentration. The size of a pixel is
1 m x 1m (scale bar, 10 µm).
Considering exposed cells, iron maps reveal one or several iron-rich zone(s) inside or close to
the cell contours (Figs. 3 and 4) whereas no such zone was observed in control cells (Fig. 2). Iron-rich
zones give the localization of the catalyst particles inside the MWCNT or attached to the SWCNT,
therefore allowing CNT localization. Iron-based catalyst particles could even be detected in the case of
cell exposure to P-SWCNT (Fig. 4b), for which iron amount was minimized, thus highlighting the high
sensitivity of the XRF method. Observation of SWCNT-cell interaction is particularly interesting since we could not clearly identify these carbon materials in cells with optical microscopy or conventional
TEM, as previously discussed by other investigators9. In addition, in some cells exposed to SWCNT, the
iron map shows co-localization of the highest Fe signal with the highest P signal (Fig. 4b), suggesting an
This finding could have important implications, for example, in terms of genotoxicity31 and would need
a dedicated investigation.
Figure 3. X-ray microfluorescence spectra integrated over the whole scanned area of three murine
macrophages exposed for 24 hours to MWCNT suspensions at concentrations of 10 µg/mL (Panel a)
and 100 µg/mL (Panels b and c). Zoomed areas around the positions of the K and K fluorescence peaks of potassium and of the K peak of calcium are shown, together with fits of the potassium and calcium contributions, in blue and in purple, respectively. Elemental maps of phosphorus, potassium,
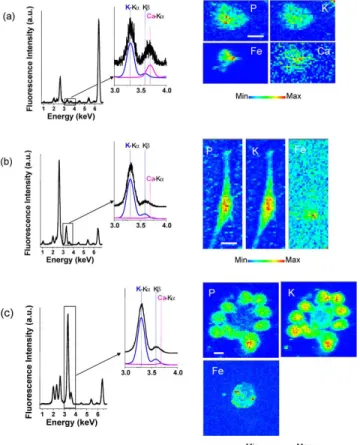
Figure 4. X-ray microfluorescence spectra integrated over the whole scanned area of murine
macrophages exposed for 24 hours to SWCNT suspensions. Panel a: suspension of NP-SWCNT at 100
g/mL, Panel b: suspension of P-SWCNT at 100 g/mL, and Panel c: suspension of NP-SWCNT at 10
g/mL. Zoomed areas around the positions of the K and K fluorescence peaks of potassium and of the K peak of calcium are shown, together with fits of the potassium and calcium contributions, in blue and in purple, respectively. Elemental maps of phosphorus, potassium, iron and of calcium, if it is in
detectable amount, are drawn for all cells. Pixel size is 1mx1m (scale bar, 10 µm).
µXRF allows detecting a dose-response effect of the cellular Fe signal in CNT-exposed cells;
higher amount of iron with respect to phosphorus is found in cells exposed to 100 µg/mL compared to
those exposed to 10 µg/mL of MWCNT, and for cells exposed to NSWCNT as compared to
fluorescence spectra are respectively equal to 16 and 70 for Fig. 3b and c, to be compared to 6 for Fig.
3a; Fe/P =10 for Fig. 4a to be compared to Fe/P =3 for Fig. 4b).
Beyond CNT localization, µXRF can be used to study other aspects of CNT behaviour in a
biological context. Figure 4c (cells exposed to 10µg/mL NP-SWCNT) shows an agglomerate of 10
macrophages around a central non-cellular area. The central area is iron-rich but contains nearly no
phosphorus, thus corresponding to an aggregate of nanotubes. The nanotube aggregate in fig.4c displays
a low but detectable potassium signal that probably arises from sorption of potassium from the culture
media since no potassium was present in the NP-SWCNT used here. This result is in line with previous
studies showing sorption of divalent ions from aqueous solution by CNT32, but it has never been shown
in biological relevant conditions. Thus, µXRF can help to identify and characterize CNT aggregates in
biological relevant conditions.
One of the major interests of µXRF is the simultaneous mapping of the fluorescence signal of
various chemical species. It allows monitoring effects on cellular elemental distributions that can be
linked to CNT internalization. In the following, we emphasize the case of Ca. No significant amount of
Ca was observed in any control cell, as illustrated in the fluorescence spectrum shown in fig. 2, while Ca
signal could be detected in some cells exposed to 100 µg/mL MWCNT and NP-SWCNT (Fig. 3b and c
and Fig. 4a respectively). It should also be noticed that control studies of XRF spectra of corresponding nanotubes exposed to cell media alone did not show any calcium localization on nanotubes. No Ca
signal was observed in any cell exposed to 100 µg/mL of P-SWCNT, as it is illustrated in Fig. 4b.
Cellular heterogeneity in Ca response has previously been observed in murine macrophages exposed to
ultrafine carbon particles33,34, where excess in Ca signal is due to an increase in cellular Ca uptake. Our
observation of Ca could be of great importance in the perspective of understanding the biological impact
of CNT on macrophages, since excess of Ca can be linked to functional disorder in cells like oxidative
stress, inflammation or cytotoxicity35. Moreover, the observation of clear changes in the elemental
distribution of cells exposed to CNT validates the sensibility of µXRF for that purpose and confirms the
In order to get a better understanding of the role of calcium in the biological effects of
macrophages exposure to CNT, first results concerning cytotoxicity and inflammatory response
(secretion of TNF-) are presented for discussion in Figure 5. It has to be noted that we examined inflammatory response (TNF- production) only in MWCNT-exposed cells because of SWCNT interference with the dosage of TNF- protein (data not shown).Cytotoxicity response was found higher in cells exposed to MWCNT and NP-SWCNT as compared to those exposed to P-SWCNT, which did
not seem to induce calcium accumulation either. Furthermore, the intracellular calcium chelator
BAPTA-AM and the calmodulin inhibitor W-7 both significantly inhibit MWCNT- and
NP-SWCNT-induced cytotoxicity and the production of TNF- by MWCNT-exposed macrophages, thus tending to confirm the biological relevance of the increased calcium content found by µXRF. Further
investigations should allow studying the details of the biological mechanism(s) involved in the effects of
Figure 5. Twenty-four hours treatment of murin macrophages with CNT and calcium antagonists
BAPTA-AM or W-7. (A) DNA quantification after MWCNT, NP- or P- SWCNT exposure (10 µg/mL)
with or without the intracellular calcium chelator BAPTA-AM (5 µM) or the calmodulin inhibitor W-7
(10 µM). Results are the means of 6 replications ± SEM, given as the ratio of the mean for each
condition to the mean of the control condition. Calcium antagonists reversed completely and partially
the decrease of DNA content induced by MWCNT and NP-SWCNT respectively (# p<0.05: vs
corresponding control, § p<0.05: MWCNT + BAPTA-AM vs MWCNT + W-7, * p<0.05: CNT without
Ca2+ antagonists vs CNT + BAPTA-AM). (B) TNF- protein release (pg/mL) after 24 hours exposure to
MWCNT (10 µg/mL) with or without BAPTA-AM (5 µM) or W-7 (10 µM). Data are presented as the
mean of 3 replications ± SEM. Significant increase of TNF- protein was only observed in cells exposed to MWCNT without calcium antagonists (# p<0.05: compared with respective control, *
p<0.05: CNT without Ca2+ antagonists vs CNT + BAPTA-AM).
Moreover, at the present stage of the study, it is difficult to draw definitive conclusions regarding
the physico-chemical determinants of the modification of Ca content since different parameters are
modified from MWCNT to NP-SWCNT (structure, agglomeration state, dimensions, together with
content and location of iron-based catalyst particles) and from NP-SWCNT to P-SWCNT (chemical
surface properties and amount of iron-based particles). The bioavailability of iron-based catalyst
particles which could also be a causative agent for promoting cell perturbations36-38, probably also varies
between our three samples (MWCNT are opened and purification treatment of SWCNT may imply
increased iron bioavailability and redox activity in P-SWCNT compared to NP-SWCNT). However,
whatever the predominant physico-chemical determinant, the present experiments show a new paradigm
of CNT toxicity, based on the capacity of CNT to modify cell calcium content, for both MWCNT and
In summary, our results demonstrate for the first time the relevance of the µXRF technique to
study cell-CNT interactions. It allows CNT localization at the single cell level with simultaneous
analysis of the biological response through observation of changes in cell elemental composition
(calcium in the present study). Analysis of cell-CNT interactions by µXRF is an original approach that
represents a significant advance in the field of toxicology of carbon nanotubes and could provide new
data to understand biological effects of these nanomaterials as they are produced, without any artificial
labelling which would necessarily modify the CNT-cell interactions.
Acknowledgments. This work was supported by the French ANR through RESPINTTOX project
(SEST program), by ESRF, and by the Région Ile-de-France in the framework of C'nano IdF,
NANOTUBTOX project. C'Nano-IdF is the nanoscience competence center of Paris Region, supported
by CNRS, CEA, MESR and Région Ile-de-France. The authors thank: F. Valsaque for fruitful
discussions related to physico-chemical characterization (LCSM, UMR CNRS 7555, Nancy, France), G.
Guillier for providing XRF sample holders (service de mécanique et cryogénie, LPS, Orsay, France), S.
Bohic for his skilled help and discussions during the sample preparation process (ESRF, INSERM
U647, Grenoble, France) and also A. Grodet & F. Cluzeau for TEM preparation of CNT-cell samples
and for their imaging (AMET-IFR02, CRB3-INSERM U773, Paris, France).
Supporting information available: Experimental procedures and figure S1. This material is available
free of charge via the Internet at http://pubs.acs.org
References
2 Lacerda, L.; Bianco, A.; Prato, M.; Kostarelos, K. Adv. Drug Delivery Rev. 2006, 58, 1460-1470
3 Lam, C.-w.; James, J.T.; McCluskey, R.; Arepalli, S.; Hunter, R.L. Critical Rev. Toxicol. 2006, 36,
189-217
4 Donaldson, K.; Aitken, R.; Tran, L.; Stone, V.; Duffin, R.; Forrest, G.; Alexander, A. Toxicol. Sci.
2006, 92 (1), 5-22
5 Helland, A.; Wick, P.; Koehler, A.; Schmid, K.; Som, C. Environ Health Perspect. 2007, 115,
1125-1131
6 Boczkowski, J.; Lanone, S. Nanomed. 2007, 2 (4), 407-410
7 Oberdörster, G.; Oberdörster, E.; Oberdörster, J. Environ. Health Persp. 2005, 113, 823-839
8 Lewinski, N.; Colvin, V.; Drezek, R., Small 2008, 4 (1), 26-49
9 Porter, A.E.; Gass, M.; Muller, K.; Skepper, J.N.; Midgley, P.A.; Welland, M. Nature
Nanotechnology 2007, 2, 713-717
10 Cherukuri, P.; Bachilo, S. M.; Litovsky, S. H.; Weisman, R. B., J. Am. Chem. Soc. 2004, 126,
15638-15639
11 Choi, J.H.; Nguyen, F.T.; Barone, P.W.; Heller, D.A.; Moll, A.E.; Patel, D.; Boppart, S.A.; Strano,
M.S. Nano Lett. 2007, 7 (4), 861-867
12 Leeuw, T.K.; Reith, R.M.; Simonette, R.A.; Harden, M.E.; Cherukuri, P.; Tsyboulski, D.A.;
Beckingham, K.M.; Weisman, R.B. Nano Lett. 2007, 7 (9), 2650-2654
13 Moore, V.C.; Strano M.S.; Haroz, E.H.; Hauge, R.H.; Smalley, R.E. Nano Lett. 2003, 3 (10),
1379-1382
15 Wong Shi Kam, N.; Jessop, T.C.; Wender, P.A.; Dai, H. J. Am. Chem. Soc. 2004, 126, 6850-6851
16 Sayes, C.M.; Liang, F.; Hudson, J.L.; Mendez, J.; Guo, W.; Beach, J.M.; Moore, V.C.; Doyle,
C.D.; West, J.L.; Billups, W.E.; Ausman, K.D.; Colvin, V.L. Toxicol. Lett. 2006, 161, 135-142.
17 Dumortier, H.; Lacotte, S.; Pastorin, G.; Marega, R.; Wu, W.; Bonifazi, D.; Briand, J.-P.; Prato,
M.; Muller, S.; Bianco, A. Nano Lett. 2006, 6 (7), 1522-1528.
18 Magrez, A.; Kasas, S.; Salicio, V.; Pasquier, N.; Seo, J.W.; Celio, M.; Catsicas, S.; Schwaller, B.;
Forró L. Nano Lett. 2006, 6 (6), 1121-1125
19 Brown, D.M.; Kinloch, I.A.; Bangert, U.; Windle, A.H.; Walter, D.M.; Walker, G.S.; Scotchford,
C.A.; Donaldson, K.; Stone, V. Carbon 2007, 45, 1743-1756
20 Pulskamp, K.; Diabaté, S.; Krug, H.F. Toxicology Letters 2007, 168, 58-74
21 Bohic, S.; Simionovici, A.; Snigirev, A.; Ortega, R.; Devès, G.; Heymann, D.; Schroer, C.G. Appl.
Phys. Lett. 2001, 78 (22), 3544-3546
22 Twining, B.S.; Baines, S.B.; Fisher, N.S.; Maser, J.; Vogt, S.; Jacobsen, C.; Tovar-Sanchez, A.;
Sañudo-Wilhelmy, S.A. Anal. Chem. 2003, 75, 3806-3816
23 Glesne, D.; Vogt, S.; Maser, J.; Legnini, D.; Huberman, E. J. Struct. Biol. 2006, 155, 2-11
24 McRae, R.; Lai, B.; Vogt, S.; Fahrni, C.J. J. Struct. Biol. 2006, 155, 22-29
25 Finney, L.; Mandava, S.; Ursos, L.; Zhang, W.; Rodi, D.; Vogt, S.; Legnini, D.; Maser, J.; Ikpatt,
F.; Olopade, O.I.; Glesne, D. PNAS 2007, 104, 2247-2252
26 Fahrni, C.J. Curr. Opin. Chem. Biol. 2007, 11, 121-127
28 Pinault, M.; Mayne-L’Hermite, M.; Reynaud, C.; Pichot, V.; Launois, P.; Ballutaud, D., Carbon
2005, 43, 2968-2976
29 Pinault, M.; Pichot, V.; Khodja, H.;Launois, P.; Reynaud, C.; Mayne-L’Hermite, M. Nano Lett.
2005, 5, 2394-2398
30 Nikolaev, P.; Bronikowski, M.J.; Bradley, R.K.; Rohmund, F.; Colbert, D.T; Smith, K.A.; Smalley,
R.E. Chem. Phys. Lett. 1999, 313, 91-97
31 Zhu, L.; Chang, D.W.; Dai, L.; Hong, Y. Nano Lett 2007, 7 (12), 3592-3597
32 Rao, G.P.; Lu, C.; Su, F. Separation and Purification Technology 2007, 58, 224-231
33 Brown, D.M.; Donaldson, K.; Borm, P.J.;Schins, R.P.;Dehnhardt, M.; Gilmour, P.; Jimenez, L.A.;
Stone, V.,Am. J. Physiol. Lung Cell. Mol. Physiol., 2004, 286, L344–L353
34 Stone,V.; Tuinman, M.; Vamvakopoulos, J.E.; Shaw, J.; Brown, D.; Petterson, S.; Faux, S.P.;
Borm, P.; MacNee, W.; Michaelangeli, F.; Donaldson, K., Eur. Respir. J. 2000, 15, 297-303
35 Donaldson, K.; Stone, V.; Borm, P.J.A.; Jimenez, L.A.; Gilmour, P.S.; Schins, R.P.F.; Knaapen, A.M.; Rahman, I.; Faux, S.P.; Brown, D.M.; Macnee, W, Free Radical Biol. & Med. 2003, 34 (11), 1369–1382
36 Liu, X.; Gurel, V.; Morris, D.; Murray, D.; Zhitkovich, A.; Kane, A.B.; Hurt, R.H., Advanced
Materials, 2007, 19, 2790–2796
37 Guo, L.; Morris, D.; Liu, X.; Vaslet, C.; Hurt, R.H.; Kane, A.B., Chemistry of Materials, 2007,
19(14), 3472-3478