Laureates: JuniorPrizes of thesCs faLLMeeting2016 CHIMIA 2017, 71, No. 4 195 doi:10.2533/chimia.2017.195 Chimia 71 (2017) 195–198 © Swiss Chemical Society
*Correspondence: Dr. M. Radioma
E-mail: [email protected]
aDepartment of Inorganic and Analytical Chemistry
University of Geneva Sciences II 30, Quai Ernest-Ansermet CH-1211 Geneva 4 bDepartment of Chemistry University of Fribourg
Chemin du Musée 9, CH-1700 Fribourg
cAdolphe Merkle Institute
University of Fribourg
Chemin des Verdiers 4, CH-1700 Fribourg
Quantitative Nano-characterization of
Polymers Using Atomic Force Microscopy
Milad Radiom§*a, Svilen Kozhuharova, Phally Kongb, Michela di Giannantoniob, Mathieu A. Ayerc,
Plinio Maronia, Andreas F. M. Kilbingerb, Katharina M. Frommb, Christoph Wederc, and Michal
Borkoveca
§SCS-Metrohm Award for best oral presentation in Polymer, Colloids & Interfaces
Abstract: The present article offers an overview on the use of atomic force microscopy (AFM) to characterize the nanomechanical properties of polymers. AFM imaging reveals the conformations of polymer molecules at solid– liquid interfaces. In particular, for polyelectrolytes, the effect of ionic strength on the conformations of molecules can be studied. Examination of force versus extension profiles obtained using AFM-based single molecule force spectroscopy gives information on the entropic and enthalpic elasticities in pN to nN force range. In addition, single molecule force spectroscopy can be used to trigger chemical reactions and transitions at the molecular level when force-sensitive chemical units are embedded in a polymer backbone.
Keywords: AFM imaging · Atomic force microscopy · Mechanochemistry · Single molecule force spectroscopy · Single molecules
Milad Radiom studied Mechanical Engineering at Amirkabir University of Technology (Iran) and Nanyang Technological University (Singapore) to respectively receive his BSc and M.Eng de-grees. He subsequently obtained his PhD in Chemical Engineering, under the super-vision of Prof. William Ducker, at Virginia Tech(UnitedStates)in2014.Hethenmoved to University of Geneva (Switzerland) as a postdoctoral research associate in
labora-tory of Prof. Michal Borkovec to work on collaborative research activities within the Swiss National Center of Competence in Research Bio-Inspired Materials. His re-search includes single molecule measure-ments and molecular mechanochemistry.
Introduction
AFM was invented in 1986 as a high-resolution imaging technique giving topo-graphical information by means of track-ing contact forces between an AFM tip and a sample surface.[1]AFM enables us to vi-sualize atoms and molecules and chemical bonds when imaged at low temperatures,[2] as well as conformations of polymers in their various environments.[3,4] For the latter studies, polymers are adsorbed from a dilute solution onto an atomically flat sol-id substrate such as mica, gold, or highly oriented pyrolytic graphite. Although ear-ly AFM images were obtained in contact mode, where a physical contact between AFM tip and sample was established, interest in imaging soft and destructible samples such as cells, DNA, proteins and various synthetic polyelectrolytes resulted in development of non-contact mode im-aging techniques (Fig. 1).[5–8]Analysis of AFM images provides useful information on conformational transitions, and enables one to extract various parameters, such as persistence length or gyration radius.[4,9,10] These nanomechanical properties depend on chemical structure, line charge density of molecules, as well as solvent quality.[10–12]
A decade after the invention of the AFM, Gaub and coworkers showed that it can also be used to manipulate and to ex-tend single polymer molecules.[13]The re-search on muscle protein titin opened a new area of application for AFM, for which the term single molecule force spectroscopy (SMFS) was coined. SMFS experiments are realized by adsorbing a polymer film on solid substrate or by chemically bind-ing a sbind-ingle polymer molecule to the tip of an AFM cantilever. The tip is then brought into contact with the substrate, which occa-sionally results in extending a single mol-ecule (Fig. 1). Both the solid substrate and the AFM tip can be functionalized to tune various interactions at purpose, including desorption or extension.[14,15] To model such force-extension profiles the polymer chain is mimicked by a continuous curve or by a series of discrete segments that are freely jointed or that are jointed at a given angle, but allow for rotational and torsional degrees of freedom.[16]These models nor-mally incorporate a characteristic length corresponding to an entropic elasticity and a characteristic elasticity constant cor-responding to the enthalpic contribution. SMFS was further combined with electro-chemistry to obtain a nano-thermodynamic cycle by continuous extension–relaxation and oxidation–reduction processes,[17]and a correlation force spectrometer that al-lows to obtain time-resolved mechanical properties of single molecules.[18]
More recently, SMFS has entered the realm of mechanochemistry (Fig. 1). To obtain such information, special polymers
196 CHIMIA 2017, 71, No. 4 Laureates: JuniorPrizes of thesCs faLLMeeting2016
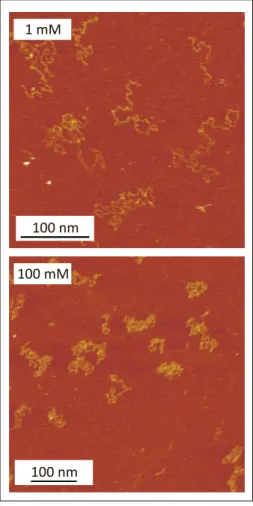
electrolyte, namely P2VP, at two dif-ferent ionic levels. At pH 3.0, P2VP is positively charged. Fig. 3 shows AFM im-ages of P2VP in 1 mM and 100 mM solu-tions. To prepare the dilute films, 20 mL of 0.1 mg/L polymer solution was depos-ited on freshly cleaved mica for 40 s. The polymer solution was then replaced with a larger volume of the electrolyte solution. The adsorbed molecules were imaged with a Cypher AFM (Asylum Research) in amplitude-modulation mode. Silicon tips (BL-AC40TS, Olympus) with nominal tip radius <10 nm, spring constant in the range of 0.07–0.15 N/m, and resonance frequen-cy around 30 kHz in water and 130 kHz in air were used. Prior to imaging, the tip was treated in a UV-ozone cleaner (PSD Pro, Novascan, Ames, USA) for 20 min in an oxygen-enriched atmosphere. A scan rate of 4.88 Hz with free oscillation amplitude (FOA) of about 10 nm and amplitude set-point of about 76% of FOA were also used. The imaging was carried out at a tempera-ture of 25 °C.
The image at 1 mM shows that the molecules assume extended random coil conformations, while at 100 mM, the mol-ecules feature a collapsed coil conforma-tion. The collapse of the molecule at higher ionic level is due to the screening of elec-trostatic repulsion between the charged monomers. This observation suggests that, at the lower ionic level, the electrostatic term greatly contributes to the conforma-tional persistence in the molecules. Similar trends have been observed for P2VP as a function of solution pH.[3]It is possible to Aldrich. PU and P1 were synthesized by
the methods reported in ref. [29] and ref. [30], respectively.
Conformation of Polymer Molecules
Conformation of single molecules is characterized by bond–bond correlation functions between tangent unit vectors n along the contour of the molecule. This correlation function normally decays on the order of nm. The decay is exponential within the worm-like chain (WLC) model. For an adsorbed polymer, the characteristic decay length is related to the persistence length lpof the molecule, where:
�n (0) .n (s)� = exp −2ls
p (1)
For a charged molecule, the persistence length is normally attributed to an inher-ent backbone rigidity, which contributes to the bare persistence length, as well as an electrostatic term whose strength depends on the ionic level of the solution. Odijk, Skolnik and Fixman predicted a fast decay of the electrostatic contribution proportional to the inverse of the solution ionic level,[31,32] while a weaker decay was observed in experiments and simula-tions.[9,33,34]
Let us use AFM imaging to illustrate the conformational transition of a poly-are synthesized that contain along the
back-bone force-sensitive units, referred to as mechanophores. Application of mechanical force triggers transitions within the mecha-nophore units. One may also incorporate a functional group at one end of a polymer and investigate specific interactions between the functional group and surface. This approach leads to remarkable insights into forces and kinetics of various chemical reactions and transitions, including complexation and coordination bonds,[19,20] receptor–donor interaction,[21] hydrogen-bonding,[22] and covalent bonds.[23,24] Mechanical force re-duces the activation energy barrier, and thus facilitates the transitions by thermal activa-tion. Without mechanical force, the transi-tions can only proceed by other triggers. An example is the isomerization of a carbon– carbon double bond, which is ubiquitous in nature and technology, and is relevant, for example, in the isomerization of 11-cis-ret-inal to all-trans-ret11-cis-ret-inal in the human eye,[25] or the isomerization of stilbene.[26]Catalysts such as silver, iodine and ruthenium have also been used to induce the isomerization of the double bond.[27]As will be discussed below, isomerization of carbon-carbon dou-ble bonds can be activated mechanically at a force of about 800 pN.[28]
Let us now illustrate these notions with specific examples. The structures of polymers used in the experiments are summarized in Fig. 2. The polymers are poly(2-vinyl pyridine) (P2VP, molecular weight Mw = 150 Kg/mol, and dispersity Đ = 1.1), a poly(urethane) made from
poly(tetrahydrofuran), 1,4-butanediol, and methylene diphenyl diisocyanate (PU, Mw
= 200 kg/mol, Đ = 1.6) and a triblock co-polymer of poly(exo-N-(2-aminoethyl)-5-norbornene-2,3-dicarboximide) and poly(exo-N-hexyl-5-norbornene-2,3-di-carboximide) (P1, Mw= 230 kg/mol, Đ =
1.6). P2VP was purchased from
Sigma-imaging pulling
mechanochemistry
Fig. 1. Schematics of AFM non-contact mode imaging, single molecule pulling, and mecha-nochemistry.
P2VP
+ NH nP1
O O N n O O N NH2 m O O N NH2 mPU
N H NH O O O O n pFig. 2. The investigated polymers include poly(2-vinyl pyridine) (P2VP), a poly(urethane) made from poly(tetrahydrofuran), 1,4-butanediol, and methylene diphenyl diisocyanate (PU),[29]and a
triblock copolymer of N-(2-aminoethyl)-5-norbornene-2,3-dicarboximide) and poly(exo-N-hexyl-5-norbornene-2,3-dicarboximide) (P1).[30]The side blocks of P1 are about 11 monomers
long (m ≈11) while the middle block is about 544 monomers long (n ≈ 544). The side blocks contain amine. In the experiments using P1, the AFM tip was functionalized with epoxide. Amine enhances adhering of the polymer to AFM tip by covalently bonding with epoxide. The covalent bonding helps pull the polymer to elevated forces (~ 1 nN).
Laureates: JuniorPrizes of thesCs faLLMeeting2016 CHIMIA 2017, 71, No. 4 197
energy Eb = 170 kJ mol–1and a thermal
rate of generally less than 10–8s–1.[39]The high energy barrier and low rates hinder the isomerization to proceed thermally at room temperature. Using AFM, we pulled molecules which contained cis double bond units in the backbone and obtained their force versus extension profiles. The force is transferred to the units via the polymer backbone, and results in reduc-tion of the energy barrier by an amount
F∆x, where F is the force and ∆x the
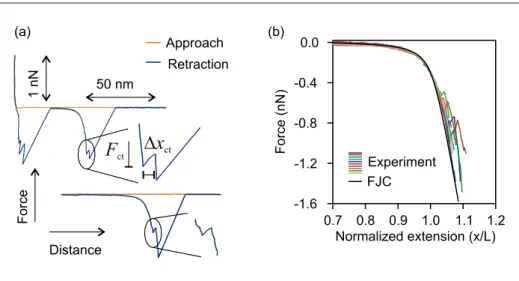
dis-placement of cis monomers along the reac-tion coordinate. Occasionally, the energy barrier is lowered enough and isomeriza-tion occurs through thermal activaisomeriza-tion. In the force versus extension profiles of P1 (Fig. 5(a)), isomerization is identified by a sudden increase in the extension of the molecule. The extension increases since
trans isomers are longer than cis isomers.
The force where the isomerization oc-curs is denoted by the isomerization force
Fct. The force versus extension response
of P1 differs from those of force-insen-sitive polymers such as P2VP and PU introduced in the previous section. In the latter, the force increases with extension until the molecule breaks from the AFM tip or the solid substrate. In the former, the molecule is tethered between the AFM tip and the solid substrate even after the isomerization.
Here again application of the normal-ization procedure is important to identify single molecule events, see Fig. 5(b). The force versus extension profiles are fitted to the FJC model (Eqn. (2)) which results in the nanomechanical properties, Kuhn length lKand force constant K = 20±3 nN,
of P1. Analysis of the single molecule isomerization events results in an iso-merization force Fct= 800±60 nN.[28]The
isomerization force is lower than the force of breaking of covalent bonds and rings, 1–2 nN, which have higher activation ener-gies.[40,41]
Conclusion
AFM has revolutionized our analyti-cal capabilities of polymers and enabled high resolution and nanoscale descrip-tion of individual molecules. By adsorb-ing polyelectrolytes from dilute solutions on appropriate solid substrates and imag-ing their contour, the dependence of their conformation on the ionic level of solution can be obtained. A similar preparation can be used to pick and then pull single mol-ecules, which on the other hand reveals their molecular elasticity. By incorpora-tion of force-sensitive units in polymer backbones, AFM can be used to activate and probe chemical transitions within in-dividual molecules.
approaches exist, the most reliable ones are the nano-handling of thick molecules,[37] and a statistical approach that consists of normalization of the extension length of the pulled polymers and overlapping of the force versus normalized extension profiles. When the force versus normalized exten-sion profiles overlap, single molecule ex-tension responses are likely. In the latter case, if more than one statistical population exists, one can usually confirm the popula-tion that corresponds to stretching of single molecules with firmly anchored ends. This is done by repeating the experiments on a more dilute polymer layer, or on surfaces that are chemically different.[28]
The freely jointed chain (FJC) model can describe the force versus extension profiles of single molecules:[38]
x = L coth lKF kT − kT lKF + F K (2)
where L is the contour length, k the Boltzmann constant, T the absolute tem-perature. The Kuhn length lK, and the force
constant K represent the nanomechanical properties of single molecules in the FJC model. This model has been successfully used in describing the force versus exten-sion profiles of synthetic polymers.[38]
Fig. 4 shows the force versus extension profiles of P2VP and PU. Experiments with P2VP were performed in 1 mM, pH 3.0 solution and on mica while experiments with PU were carried out in dimethylsulf-oxide (DMSO) and on silica. In both cases, polymer solutions of 100 mg/L concentra-tion were used. The deposiconcentra-tion period for P2VP was 40 sec and for PU, 2 h. For P2VP the polymer solution was exchanged with a larger volume of the electrolyte so-lution while for PU, the polymer film was initially rinsed with DMSO and then dried with a stream of nitrogen prior to the force spectroscopy experiments. The normaliza-tion procedure was used to obtain single molecule extensions. Thereafter, FJC mod-el was used to fit the individual force
ver-sus extension profiles. An average Kuhn
length and force constant was obtained for each polymer. These values were lK
= 0.52±0.07 nm and K = 9.5±0.2 nN for P2VP and 0.30±0.02 nm and 27.1±3.3 nN for PU. These results suggest that at low forces, PU is more flexible than P2VP due to its lower Kuhn length. At high forces, PU becomes stiffer than P2VP as a result of its higher force constant.
Molecular Mechanochemistry
Cis to trans isomerization of a
car-bon–carbon double bond has an activation quantify the persistence lengths of the
ad-sorbed molecules using an image analysis software which computes the lateral coor-dinates of the molecules from which the correlation function is calculated.[35]These results will be presented elsewhere.
Molecular Elasticity
Elasticity of polymers at the single molecule level is obtained from an analy-sis of their force versus extension profiles obtained from AFM pulling experiments. The loss of entropy as a consequence of increase in the end-to-end distance of the pulled molecule results in a restoring force that is sensed by the AFM probe. At forces in the nN range, chemical bonds and bond angles are also significantly distorted, which leads to an enthalpic contribution. In this case, the polymer molecule may ex-tend beyond its contour length.[36]
The first step in the analysis is the iden-tification of single molecule events that are originating from molecules that are firmly anchored on both ends to the solid sub-strate and the AFM tip. While a variety of
100 mM
100 nm 100 nm 1 mM
Fig. 3. AFM images of P2VP adsorbed on mica at different ionic levels 1 mM and 100 mM, both at pH 3.0. At these conditions P2VP is positively charged. At low ionic level the molecules form an extended random coil while at high ionic level they collapse.
198 CHIMIA 2017, 71, No. 4 Laureates: JuniorPrizes of thesCs faLLMeeting2016
[7] J. V. Lauritsen, M. Reichling, J. Phys. Condes.
Matter 2010, 22, 263001.
[8] D. J. Marchand, E. Hsiao, S. H. Kim, Langmuir
2013, 29, 6762.
[9] L. Grebikova, S. Kozhuharov, P. Maroni, A. Mikhaylov, G. Dietler, A. D. Schluter, M. Ullner, M. Borkovec, Nanoscale 2016, 8, 13498.
[10] Y. Roiter, O. Trotsenko, V. Tokarev, S. Minko, J.
Am. Chem. Soc. 2010, 132, 13660.
[11] A. Kiriy, G. Gorodyska, S. Minko, W. Jaeger, P. Stepanek, M. Stamm, J. Am. Chem. Soc. 2002,
124, 13454.
[12] Y. Roiter, W. Jaeger, S. Minko, Polymer 2006,
47, 2493.
[13] M. Rief, M. Gautel, F. Oesterhelt, J. M. Fernandez, H. E. Gaub, Science 1997, 276, 1109.
[14] L. Grebikova, M. Radiom, P. Maroni, D. A. Schlüter, M. Borkovec, Polymer 2016, 102, 350.
[15] M. Geisler, R. R. Netz, T. Hugel, Angew. Chem.,
Int. Ed. 2010, 49, 4730.
[16] L. Livadaru, R. R. Netz, H. J. Kreuzer,
Macromolecules 2003, 36, 3732.
[17] W. Q. Shi, M. I. Giannotti, X. Zhang, M. A. Hempenius, H. Sconherr, G. J. Vancso, Angew.
Chem., Int. Ed. 2007, 46, 8400.
[18] M. Radiom, M. R. Paul, W. A. Ducker,
Nanotechnology 2016, 27, 255701.
[19] T. Auletta, M. R. de Jong, A. Mulder, F. van Veggel, J. Huskens, D. N. Reinhoudt, S. Zou, S. Zapotoczny, H. Schonherr, G. J. Vancso, L. Kuipers, J. Am. Chem. Soc. 2004, 126, 1577. [20] S. Kado, K. Kimura, J. Am. Chem. Soc. 2003,
125, 4560.
[21] H. Skulason, C. D. Frisbie, J. Am. Chem. Soc.
2002, 124, 15125.
[22] A. Embrechts, A. H. Velders, H. Schoenherr, G. J. Vancso, Langmuir 2011, 27, 14272. [23] D. Schuetze, K. Holz, J. Mueller, M. K. Beyer,
U. Luening, B. Hartke, Angew. Chem. Int. Ed.
2015, 54, 2556.
[24] H. M. Klukovich, T. B. Kouznetsova, Z. S. Kean, J. M. Lenhardt, S. L. Craig, Nature
Chem. 2013, 5, 110.
[25] K. Palczewski, J. Biol. Chem. 2012, 287, 1612. [26] R. E. Dawson, S. F. Lincoln, C. J. Easton,
Chem. Commun. 2008, 3980.
[27] S. K. Sharma, V. K. Srivastava, R. V. Jasra, J.
Mol. Catal. A-Chem. 2006, 245, 200.
[28] M. Radiom, P. Kong, P. Maroni, M. Schafer, A. Kilbinger, M. Borkovec, Phys. Chem. Chem.
Phys. 2016, 18, 31202.
[29] M. A. Ayer, Y. C. Simon, C. Weder,
Macromolecules 2016, 49, 2917.
[30] M. Schaefer, N. Hanik, A. F. M. Kilbinger,
Macromolecules 2012, 45, 6807.
[31] T. Odijk, J. Polym. Sci. B 1977, 15, 477. [32] J. Skolnick, M. Fixman, Macromolecules
1977, 10, 944.
[33] R. R. Netz, H. Orland, Eur. Phys. J. B 1999,
8, 81.
[34] M. Ullner, J. Phys. Chem. B 2003, 107, 8097. [35] A. Mikhaylov, S. Sekatskii, G. Dietler, J. Adv.
Microscopy Res. 2013, 8, 241.
[36] T. Hugel, M. Rief, M. Seitz, H. E. Gaub, R. R. Netz, Phys. Rev. Lett. 2005, 94.
[37] L. Grebikova, P. Maroni, B. Z. Zhang, D. A. Schlüter, M. Borkovec, ACS Nano 2014, 8, 2237.
[38] M. I. Giannotti, G. J. Vancso, ChemPhysChem
2007, 8, 2290.
[39] J. L. Magee, W. Shand, H. Eyring, J. Am. Chem.
Soc. 1941, 63, 677.
[40] J. Wang, T. B. Kouznetsova, Z. Niu, M. T. Ong, H. Klukovich, A. L. Rheingold, T. J. Martinez, S. L. Craig, Nature Chem. 2015, 7, 323. [41] M. Grandbois, M. Beyer, M. Rief, H.
Clausen-Schaumann, H. E. Gaub, Science 1999, 283, 1727.
[1] G. Binnig, C. F. Quate, C. Gerber, Phys. Rev.
Lett. 1986, 56, 930.
[2] L. Gross, F. Mohn, N. Moll, P. Liljeroth, G. Meyer, Science 2009, 325, 1110.
[3] Y. Roiter, S. Minko, J. Am. Chem. Soc. 2005,
127, 15688.
[4] A. Japaridze, D. Vobornik, E. Lipiec, A. Cerreta, J. Szczerbinski, R. Zenobi, G. Dietler,
Macromolecules 2016, 49, 643.
[5] A. M. O. Brett, A. M. C. Paquim,
Bioelectrochemistry 2005, 66, 117.
[6] A. Kiriy, G. Gorodyska, N. Kiriy, R. Sheparovych, R. Lupytsky, S. Minko, M. Stamm, Macromolecules 2005, 38, 501.
Acknowledgement
The research leading to these results has received funding from the National Center of Competence in Research (NCCR) for Bio-Inspired Materials, University of Geneva, and the European Research Council under the European Union’s Seventh Framework
Programme (FP7/2007-2013)/ERC grant
agreement no291490-MERESPO. Received: December 1, 2016 -1.0 -0.8 -0.6 -0.4 -0.2 0.0 0.2 0.4 Force (nN) 70 60 50 40 30 20 10 0 Extension (nm) P2VP Approach Retraction 1.2 1.0 0.8 0.6 0.4 -1.0 -0.8 -0.6 -0.4 -0.2 0.0 Force (nN) Normalized extension (x/L) 0.0 0.2 Experiment FJC P2VP -2.0 -1.5 -1.0 -0.5 0.0 1.2 1.0 0.8 0.6 0.4 Normalized extension (x/L) 0.0 0.2 60 50 40 30 20 10 0 Extension (nm) -2.0 -1.0 -0.5 0.0 0.5 Force (nN) -1.5 PU Approach Retraction FJCExperiment PU
Fig. 4. Molecular elasticity of P2VP and PU obtained from single molecule pulling. Experiments with P2VP were performed in 1 mM, pH 3.0 solution. Experiments with PU were performed in dimethylsulfoxide (DMSO). Using the FJC model, a persistence length lK= 0.52±0.07 nm and a
force constant K = 9.5±0.2 nN were obtained for P2VP. These values were respectively, 0.30±0.02 nm and 27.1±3.3 nN for PU.
50 nm 1n N Force Distance Approach Retraction
?x
ctF
ct (a) -1.6 -1.2 -0.8 -0.4 0.0 Force (nN) 1.2 1.1 1.0 0.9 0.8 0.7 Normalized extension (x/L) Experiment FJC (b)Fig. 5. (a) Force versus extension profiles of P1 showing isomerization events. The onset of cis-to-trans isomerization is denoted by the isomerization force that accompanies an extension increase. (b) Force versus normalized extension profiles of P1 together with the post-isomerization sections. Using the FJC model, a persistence length lK= 0.53±006 nm and a force constant K = 20±3 nN.
![Fig. 2. The investigated polymers include poly(2-vinyl pyridine) (P2VP), a poly(urethane) made from poly(tetrahydrofuran), 1,4-butanediol, and methylene diphenyl diisocyanate (PU), [29] and a triblock copolymer of N-(2-aminoethyl)-5-norbornene-2,3-dicarbox](https://thumb-eu.123doks.com/thumbv2/123doknet/14933851.665477/2.892.314.837.778.1077/investigated-tetrahydrofuran-butanediol-methylene-diisocyanate-copolymer-aminoethyl-norbornene.webp)