HAL Id: insu-01493833
https://hal-insu.archives-ouvertes.fr/insu-01493833
Submitted on 22 Mar 2017
HAL is a multi-disciplinary open access
archive for the deposit and dissemination of
sci-entific research documents, whether they are
pub-lished or not. The documents may come from
teaching and research institutions in France or
abroad, or from public or private research centers.
L’archive ouverte pluridisciplinaire HAL, est
destinée au dépôt et à la diffusion de documents
scientifiques de niveau recherche, publiés ou non,
émanant des établissements d’enseignement et de
recherche français ou étrangers, des laboratoires
publics ou privés.
and validation
Christopher Sioris, Landon Rieger, Nicholas Lloyd, Adam Bourassa, Chris
Roth, Douglas Degenstein, Claude Camy-Peyret, Klaus Pfeilsticker, Gwenaël
Berthet, Valéry Catoire, et al.
To cite this version:
Christopher Sioris, Landon Rieger, Nicholas Lloyd, Adam Bourassa, Chris Roth, et al.. Improved
OSIRIS NO2 retrieval algorithm: description and validation. Atmospheric Measurement Techniques,
European Geosciences Union, 2017, 10 (3), pp.1155 - 1168.
�10.5194/amt-10-1155-2017�.
�insu-01493833�
www.atmos-meas-tech.net/10/1155/2017/ doi:10.5194/amt-10-1155-2017
© Author(s) 2017. CC Attribution 3.0 License.
Improved OSIRIS NO
2
retrieval algorithm:
description and validation
Christopher E. Sioris1, Landon A. Rieger2, Nicholas D. Lloyd2, Adam E. Bourassa2, Chris Z. Roth2, Douglas A. Degenstein2, Claude Camy-Peyret3, Klaus Pfeilsticker4, Gwenaël Berthet5, Valéry Catoire5, Florence Goutail6, Jean-Pierre Pommereau6, and Chris A. McLinden1
1Air Quality Research Division, Environment and Climate Change Canada, Toronto, Canada 2University of Saskatchewan, Saskatoon, Canada
3Institut Pierre Simon Laplace, Paris, France
4Institute of Environmental Physics, University of Heidelberg, Heidelberg, Germany 5LPC2E, Centre National de la Recherche Scientifique, Université Orléans, Orléans, France 6Centre National de la Recherche Scientifique, Guyancourt, France
Correspondence to:Christopher E. Sioris ([email protected]) Received: 23 August 2016 – Discussion started: 10 October 2016
Revised: 8 February 2017 – Accepted: 20 February 2017 – Published: 21 March 2017
Abstract. A new retrieval algorithm for OSIRIS (Optical Spectrograph and Infrared Imager System) nitrogen dioxide (NO2) profiles is described and validated. The algorithm
re-lies on spectral fitting to obtain slant column densities of NO2, followed by inversion using an algebraic
reconstruc-tion technique and the SaskTran spherical radiative trans-fer model (RTM) to obtain vertical profiles of local number density. The validation covers different latitudes (tropical to polar), years (2002–2012), all seasons (winter, spring, sum-mer, and autumn), different concentrations of nitrogen diox-ide (from denoxified polar vortex to polar summer), a range of solar zenith angles (68.6–90.5◦), and altitudes between 10.5 and 39 km, thereby covering the full retrieval range of a typical OSIRIS NO2profile. The use of a larger spectral
fitting window than used in previous retrievals reduces re-trieval uncertainties and the scatter in the retrieved profiles due to noisy radiances. Improvements are also demonstrated through the validation in terms of bias reduction at 15–17 km relative to the OSIRIS operational v3.0 algorithm. The diur-nal variation of NO2 along the line of sight is included in
a fully spherical multiple scattering RTM for the first time. Using this forward model with built-in photochemistry, the scatter of the differences relative to the correlative balloon NO2profile data is reduced.
1 Introduction
Nitrogen oxides, such as NO and NO2, are the reactive
nitrogen-containing species in the middle atmosphere and are produced mainly from the breakdown of nitrous oxide in the stratosphere (Crutzen, 1971). Oxides of nitrogen dominate ozone loss in the middle stratosphere, whereas in the lower stratosphere they react with oxides of chlorine and bromine, such as ClO and BrO, to reduce the halogen-catalyzed de-struction of ozone (Salawitch et al., 2005; Wennberg et al., 1994).
The partitioning between NO and NO2depends on several
factors such as the local ozone concentration and the pho-tolysis frequency of NO2. Reactive nitrogen is chemically
converted at night to N2O5and, upon hydrolysis, can be
fur-ther sequestered into unreactive “reservoir” species such as HNO3. NO2increases steadily during daylight hours due to
the UV photolysis of N2O5(e.g. Wetzel et al., 2012).
The photochemistry of NO2, which is particularly rapid
near the day–night terminator, leads to horizontal gradients within the field of view, particularly for limb sounders such as OSIRIS (Optical Spectrograph and Infrared Imager Sys-tem) (Llewellyn et al., 2004) on the Odin satellite or for solar occultation instruments operating in either the UV– visible or mid-infrared (e.g. Kerzenmacher et al., 2008). Be-sides OSIRIS, other space-borne limb scattering instruments
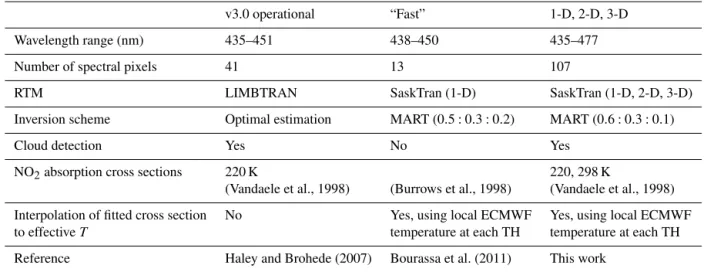
Table 1. Main features of OSIRIS NO2algorithms compared in this work.
v3.0 operational “Fast” 1-D, 2-D, 3-D Wavelength range (nm) 435–451 438–450 435–477 Number of spectral pixels 41 13 107
RTM LIMBTRAN SaskTran (1-D) SaskTran (1-D, 2-D, 3-D) Inversion scheme Optimal estimation MART (0.5 : 0.3 : 0.2) MART (0.6 : 0.3 : 0.1) Cloud detection Yes No Yes
NO2absorption cross sections 220 K 220, 298 K
(Vandaele et al., 1998) (Burrows et al., 1998) (Vandaele et al., 1998) Interpolation of fitted cross section No Yes, using local ECMWF Yes, using local ECMWF to effective T temperature at each TH temperature at each TH Reference Haley and Brohede (2007) Bourassa et al. (2011) This work
that have measured NO2 vertical profiles include Scanning
Imaging Absorption spectrometer for Atmospheric Char-tography (SCIAMACHY) (Bovensmann et al., 1999), Solar Mesosphere Explorer (Mount et al., 1984), and Stratospheric Aerosol and Gas Experiment (SAGE) III (Rault et al., 2004; Rault, 2004).
The OSIRIS operational NO2retrieval algorithm was
de-veloped and validated by Haley and Brohede (2007) and the current version is 3.0. The work of Kerzenmacher et al. (2008) is the only other publication comparing version 3.0 OSIRIS NO2data to correlative profile measurements.
Ear-lier versions (e.g. 2.x; Haley et al., 2004) were more thor-oughly validated, for example by Brohede et al. (2007). The pseudo-spherical forward model used in the opera-tional OSIRIS NO2 retrieval algorithm is less accurate
than the SaskTran spherical radiative transfer model (RTM) (Bourassa et al., 2008; Zawada et al., 2015) currently used as a forward model in the operational retrieval algorithm for OSIRIS ozone and aerosol extinction data products. Re-cently, Bourassa et al. (2011) developed an alternative NO2
algorithm which relied on four wavelengths covering a single NO2 absorption band. This was later modified to 13
wave-lengths covering three adjacent NO2 bands (438–450 nm)
and used to process the entire OSIRIS data record and is re-ferred to here as the “fast” OSIRIS NO2product. While the
spectral information content is reduced relative to the opera-tional OSIRIS algorithm and the algorithm described below (see Table 1), the “fast” algorithm has two key common ele-ments to the one described herein:
1. The forward model is the successive-orders-of-scattering version of SaskTran.
2. MART (Multiplicative Algebraic Reconstruction Tech-nique) (Degenstein et al., 2009) is used for inversion. In this work, we provide a detailed description of the new retrieval algorithm whose heritage is the “fast” algorithm
(Bourassa et al., 2011) as well as the algorithm developed in a series of papers (Sioris et al., 2003, 2004, 2007). The cur-rent algorithm was developed to demonstrate that improved accuracy is possible through the combination of a better for-ward model and better forfor-ward model inputs than used by Sioris et al. (2007) and additional wavelengths longer than those selected by Sioris et al. (2003). The main focus is on the lower stratosphere (and upper troposphere).
We then compare NO2profiles retrieved from OSIRIS
ob-servations to balloon-borne NO2profile measurements
dur-ing the decade (2002–2012) when dozens of balloon-borne limb measurements were performed. Balloon profiles are chosen for the validation for many reasons, of which the most important is the expected accuracy of these data. The accu-racy is due to two main factors: very high signal-to-noise ratio afforded by the luxury of long exposure times (which can be traded for higher vertical and/or spectral resolution) and superior altitude determination, which for balloon-borne limb geometry is due to the sensor being an order of mag-nitude closer to the tangent point than for satellite limb sounders, thereby reducing the impact of imperfect viewing angle knowledge. Profile measurements from balloons are preferable to those from satellite for the purpose of validation because of their high vertical resolution, generally match-ing or exceedmatch-ing the ∼ 2 km vertical resolution of OSIRIS NO2(e.g. Sioris et al., 2003) (see below). Balloon
measure-ments exploit a greater diversity of methods as in situ tech-niques are used in addition to remote sensing. Furthermore, one balloon-borne remote sensing technique relies on occul-tation during balloon ascent/descent, which is not possible for satellite instruments, and provides very accurate altitude registration, offers potentially finer vertical resolution than limb geometry for instruments observing the full solar disk (see Sect. 2.3), and smaller errors due to the neglect of diur-nal NO2gradients.
2 Method
2.1 Algorithm description and settings
The algorithm is a classic two-step approach of spectral fit-ting of optical depth spectra with absorption cross sections to determine slant column densities (SCDs), followed by verti-cal fitting to invert the SCD profile (e.g. Ogawa et al., 1981). This two-step approach is used by many groups (e.g. Pom-mereau, 1982; Ferlemann et al., 1998; Renard et al., 2000) including some of the balloon remote sensing teams provid-ing data used in this study. The profile is retrieved by itera-tively updating it based on MART (see below) such that the simulated NO2SCDs agree with the observed ones. A
gen-erally appropriate diagram of the algorithm described here appears in the work of Haley et al. (2004).
The first step of the data analysis, namely the spectral fit-ting, involves a reference spectrum as in Eq. (1) of Sioris et al. (2003). The reference spectrum is the co-addition of spec-tra at tangent heights (THs) in the 50–70 km range (Sioris et al., 2003). Spectral fitting refers to a multiple linear re-gression including the following basis functions: a fourth-order closure polynomial which is justified based on an ad-justed R2test, and temperature-dependent NO2(Vandaele et
al., 1998) and O3(Serdyuchenkov et al., 2014) absolute
ab-sorption cross sections interpolated to the temperature (T ) of the tangent layer using the European Centre for Medium-Range Weather Forecasting (ECMWF) analysis and con-volved with a Gaussian to OSIRIS spectral resolution. Water vapour absorption is neglected despite maximal absorptions of > 0.1 % in the fitting window (434.8–476.7 nm) in the up-per troposphere as it is not spectrally correlated with NO2
ab-sorption over this window and would greatly increase the for-ward modelling computational burden. SaskTran treats wa-ter vapour as a line-by-line absorber assuming a Voigt line shape and spectroscopic parameters from the HITRAN 2008 database (Rothman et al., 2009).
The spectral fitting is exactly the same for observed and simulated normalized radiances. For example, the actual OSIRIS wavelengths and tangent heights are inputs into the simulation and any spectral pixels which are rejected due to radiation hits or detector saturation at the Level 1 processing stage (i.e. observed radiances) are also omitted from the fit of the SaskTran-simulated radiances. The longest wavelength in the fitting window is extended to 476.7 nm, raising the num-ber of spectral pixels to 107, thereby increasing the spec-trally integrated signal-to-noise ratio and the penetration of the lower atmosphere relative to both existing OSIRIS NO2
algorithms mentioned above. Both of these benefits of an extended fitting window have been demonstrated for SCIA-MACHY limb scattering (Sioris et al., 2004), but OSIRIS has a glass filter that prevents the detection of higher or-ders of light reflected off the grating, which was positioned such that the 477–530 nm region is not usable (Warshaw et al., 1996). Thus the 434.8–476.7 nm window is used here and
spectral fitting residuals are shown in Fig. 1. Using a dis-continuous fitting window that included wavelengths greater than 530 nm is not beneficial. The NO2 SCD uncertainties
are improved relative to those obtained by Sioris et al. (2003) who used a 434.8–449.0 nm fitting window and the “tilt” pseudo-absorber. The improved NO2 number density
pre-cision is illustrated below. The “tilt” basis function is now excluded from the spectral fitting. We also tested an alterna-tive approach of fitting an NO2spectral weighting function to
the normalized radiances, as is used to fit the ozone absorp-tion signal in nadir reflectance spectra (Coldewey-Egbers et al., 2005) and the spectral fits did not improve significantly.
The retrieval upper altitude limit is defined by the lowest TH in a limb scan for which the NO2SCD error is < 100 %
for all THs below. This can be as high as 49 km but is typi-cally ∼ 40 km and typitypi-cally a few kilometres higher than the upper altitude of the “fast” NO2 product. The lower limit
of the retrieval is often determined by cloud tops as Odin generally scans the limb into the upper troposphere; cloud-contaminated observations are excluded as they can lead to biases and poor retrieval convergence. Cloud top detection is particularly important for MART since spectra from succes-sive THs immediately below a given altitude are used in a weighted fashion to retrieve the NO2number density at that
altitude. We assume, for OSIRIS geometry (scattering angles of 90±30◦), that an observed scene near a cloud top sampled by the ∼ 1 km tall instantaneous field of view has larger limb radiance at ∼ 810 nm than if it were cloud free. A scene is deemed to be cloudy if the ∼ 810 nm radiance scale height is <2.4139. This threshold is lowered from an overly stringent value of 3.84 (Sioris et al., 2007). The new threshold is cho-sen to allow NO2retrievals (and validation) to extend below
2–3-month old volcanic aerosol layers due to Sarychev Peak and Nabro, two of the eruptions during the OSIRIS mission which led to the largest stratospheric aerosol optical depth.
Algebraic reconstruction techniques have been used to recover the vertical (and along-track) distribution of atmo-spheric constituents for over 4 decades (Thomas and Don-ahue, 1972; Fesen and Hays, 1982). Chahine’s (1968) relax-ation method, used by Sioris et al. (2007) for the retrieval of OSIRIS NO2vertical profiles, is a variant of MART in which
only the tangent layer is used to retrieve the local number density and is also tested (see Sect. 4). The MART retrieval in this work uses a 0.6 : 0.3 : 0.1 weighting following the OSIRIS aerosol extinction retrieval (see Eq. 8 of Bourassa et al., 2007). Exactly 15 retrieval iterations are used, which appears to be adequate for most cases and, with MART, does not lead to overfitting. The radiance is summed over five or-ders of scattering, which is sufficient for non-cloudy cases (Sioris et al., 2004) and also leads to ≤ 6 % errors over the retrieval range for a case with a solar zenith angle (SZA) of 75◦with an optically thick ice cloud occupying two altitude levels within the boundary layer. The NO2profile is retrieved
on a 1 km altitude grid, although the NO2vertical resolution
sam-Figure 1. Measured and fitted differential optical depth (DOD) as a function of tangent height (“Alt”) in the spectral window used for NO2
retrieval. The residual is calculated as measured DOD minus fitted DOD.
pling provided by Odin. Above the retrieval range, NO2
pro-files are scaled every iteration using a Chahine-like update based on the highest TH within the retrieval range. Below the retrieval range, the NO2profile is assumed to have a constant
number density down to the ground, equal to the number den-sity at the lowest retrieved altitude. The air number denden-sity profile is from ECMWF. The retrieval uses OSIRIS-retrieved ozone and aerosol extinction profiles (version 5.07, v5.07 hereafter), as well as the 675 nm scene albedo (Bourassa et al., 2007) to provide more realistic forward model inputs into SaskTran.
The NO2retrieval uncertainty is obtained by perturbation
as described by Sioris et al. (2010), with the NO2SCD
stan-dard errors and an altitude-independent NO2number density
perturbation serving as inputs. Profile retrieval including the error calculation using a forward model that neglects diurnal gradients (see Sect. 2.2) takes ∼ 5 min on a desktop computer with eight 3.4 GHz processors.
2.2 Modelling diurnal gradients within SaskTran McLinden et al. (2006) developed the capability to account for diurnal chemical gradients in a pseudo-spherical RTM. The high spatial resolution capability which is required for
modelling (horizontal) diurnal gradients of NO2within the
fully spherical SaskTran RTM is described by Zawada et al. (2015). This capability comes at the price of a large in-crease in computing time (see also Sect. 3). SaskTran is now capable of modelling radiation fields with the atmosphere varying along the line of sight (LOS) as well as along the incoming solar beam (referred to as “2-D mode” and “3-D mode”, respectively, hereafter). The 1-“3-D forward model and associated retrieval (Table 1) completely neglects diur-nal gradients in NO2. In 2-D mode, the atmosphere consists
of sectors along the LOS (with 1◦, angular resolution) but
the diurnal variation of NO2along the incoming solar beam
is not considered. In 3-D mode, the atmosphere essentially consists of stacked triangular prisms of increasing horizon-tal extent with increasing distance from the tangent point as illustrated by Zawada et al. (2015) and diurnal gradients are simulated for any light path from its point of entry into the atmosphere to its exit.
To provide realistic diurnal gradients in the atmosphere of the forward model, SaskTran has been linked to the PRATMO stratospheric gas-phase photochemical box model (McLinden et al., 2000). PRATMO is configured to converge to 0.5 % between the start and end of each 1-day run. The de-fault number of time steps per day is 35. The latitudinal and
vertical resolutions are 2.5◦ and ∼ 2 km, respectively. The atmosphere is aerosol free for photolysis frequency calcula-tions. More details are available in McLinden et al. (2006) and references therein. The accuracy of PRATMO at various altitudes, latitudes, seasons, and SZAs is in evidence in the work of Brohede et al. (2008).
The diurnal variation within the SaskTran atmosphere is then simulated by scaling the NO2 number density in each
sector by the ratio of NO2number density in that sector
rel-ative to the tangent sector. NO2number density is linearly
interpolated from the SZAs in PRATMO to the SZAs of the SaskTran sectors based on the cosine of the SZA. The sectors and the vertical grid in SaskTran are defined independently of the PRATMO latitudinal and vertical grid.
Note that the typical horizontal sampling of OSIRIS limb scans of ∼ 5◦ is too sparse to allow for a tomographic re-trieval (Hultgren et al., 2013). A two-dimensional tomo-graphic retrieval of NO2from a special set of SCIAMACHY
limb scattering measurements with finer horizontal sampling was performed by Puk¸¯ıte et al. (2008). Their tomographic retrieval provides an alternative approach to account for the diurnal gradient of NO2 in the orbital plane (i.e. along the
LOS).
2.3 Validation approach and datasets
Even though the OSIRIS profiles retrieved with the 2-D and 3-D mode of SaskTran account, to varying degrees, for the diurnal gradients expected for the OSIRIS viewing geom-etry, photochemical modelling is also required to scale all of the OSIRIS NO2profiles to the local time of the balloon
measurement. The PRATMO box model is also used for this purpose.
Balloon correlative data are used from the following instruments: Differential Optical Absorption Spectroscopy (DOAS; Butz et al., 2006; Kreycy et al., 2013, and references therein), mini-DOAS (Weidner et al., 2005), Limb Profile Monitor of the Atmosphere (LPMA; Butz et al., 2006), Spec-tromètre Infra-Rouge d’Absorption par Lasers Embarqués (SPIRALE; Kerzenmacher et al., 2008; Moreau et al., 2005), Système d’Analyse par Observation Zénithale (SAOZ; Pom-mereau and Piquard, 1994; Wetzel et al., 2007), SAOZ-BrO (Pundt et al., 2002), mini-SAOZ (Vicomte and Pom-mereau, 2011), MkIV (Toon et al., 2002), and Spectroscopie d’Absorption Lunaire pour l’Observation des Minoritaires Ozone et NOx – Nacelle 2 (SALOMON-N2) operating in
solar occultation mode (Jégou et al., 2013). Table 2 provides information on these correlative datasets. The five balloon-borne instruments not previously used in OSIRIS NO2
val-idation are LPMA, mini-DOAS, SPIRALE, SALOMON-N2, and MkIV. DOAS and SAOZ had been used previ-ously (Brohede et al., 2007; Haley et al., 2004; Sioris et al., 2003). SPIRALE, LPMA, and SALOMON-N2 data were obtained from the CNES/CNRS-INSU Ether website (http: //www.pole-ether.fr).
Coincidence criteria are within 1000 km (Brohede et al., 2007) and on the same calendar day (using UT time). Only daytime correlative measurements are considered. The closest spatial coincidence is used if located within a 1000 km range. Comparisons between OSIRIS NO2and
bal-loon correlative data are performed only down to the lower altitude limit of each profile retrieved with the v3.0 algorithm in an effort to keep the number of balloon-coincident alti-tudes the same between that algorithm and the algorithm de-buting here. The upper limit for validation is determined in all cases by the balloon float altitude.
The best opportunities for validation of a denoxified pro-file come on 4 and 16 March 2003 in Kiruna, Sweden, when the NO2 number density measured by LPMA and SAOZ,
respectively, did not exceed 109molec cm−3at any altitude. These peak number densities are the lowest in the validation dataset. Note that OSIRIS does not measure in the northern polar region until late February due to a lack of sunlight at ∼06:00 and 18:00. NO2 profiles at southern high latitudes
have not been measured by balloon-borne instruments dur-ing the OSIRIS mission.
Averaging kernels are not taken into account since the vertical resolution is similar between the NO2profiles from
most of the selected validation instruments and from the three OSIRIS algorithms, namely the operational v3.0, “fast”, and the algorithm described herein. Results from the current al-gorithm will be treated separately for each of the forward model modes (1-D, 2-D, and 3-D) described in Sect. 2.2.
In Sect. 3, the 1-D profiles used in the validation are those processed by a network of computers (using a SZA cutoff of <90◦). The entire OSIRIS data record has now been pro-cessed using the 1-D algorithm and is currently available (University of Saskatchewan, 2017). One time-saving ap-proximation is used to process the entire record: multiple scattering (MS) is only calculated at 21 wavelengths cor-responding to the peaks and troughs of the NO2
absorp-tion cross secabsorp-tion across the spectral fitting window rather than the entire set of 107 wavelengths. Radiance ratios be-tween multiple scattering and single scattering simulations at these 21 wavelengths are linearly interpolated to the re-maining 86 wavelengths, where they are used to scale the single-scattering radiances. The radiance error due to the MS approximation is typically < 0.05 % at all wavelengths and all THs used in the NO2retrieval.
3 Results
One difference in the method described above (Sect. 2) com-pared to previous OSIRIS NO2 algorithms (e.g. Haley and
Brohede, 2007; Bourassa et al., 2011) is the use of spectral information at longer wavelengths, which allows the NO2
ab-sorption optical depth to be more precisely quantified. Two sources of random error in retrieved NO2are shot noise, a
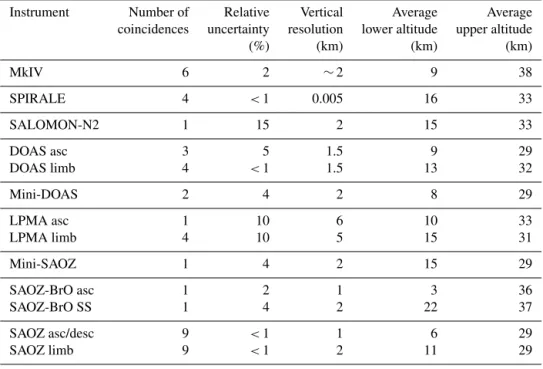
Table 2. Summary of validation data based on OSIRIS coincidences. The minimum relative uncertainty is reported on the native vertical grid. Vertical resolution is quoted or calculated for an altitude of 16 km. The vertical resolution is provided by Butz (2006) for LPMA and DOAS, Weidner et al. (2005) for mini-DOAS, available at http://mark4sun.jpl.nasa.gov/m4data.html for MkIV, and calculated for limb occultation for the SAOZ-type instruments, including SALOMON-N2 (Jégou et al., 2013), assuming vertical resolution equal to the vertical extent of the solar disk at the tangent point. Uncertainties are for a 1 km vertical grid, except for SPIRALE (0.005 km) and mini-DOAS (2 km).
Instrument Number of Relative Vertical Average Average coincidences uncertainty resolution lower altitude upper altitude (%) (km) (km) (km) MkIV 6 2 ∼2 9 38 SPIRALE 4 <1 0.005 16 33 SALOMON-N2 1 15 2 15 33 DOAS asc 3 5 1.5 9 29 DOAS limb 4 <1 1.5 13 32 Mini-DOAS 2 4 2 8 29 LPMA asc 1 10 6 10 33 LPMA limb 4 10 5 15 31 Mini-SAOZ 1 4 2 15 29 SAOZ-BrO asc 1 2 1 3 36 SAOZ-BrO SS 1 4 2 22 37 SAOZ asc/desc 9 <1 1 6 29 SAOZ limb 9 <1 2 11 29
the detector by impinging limb-scattered photons, as well as radiation hits by energetic particles (e.g. protons) that are not filtered in the Level 1 data. The extended fitting win-dow tends to reduce the susceptibility of the retrieved NO2
to these noise sources. Using the 1-D forward model de-scribed above, the 33 OSIRIS limb scans used in validation are processed with the extended fitting window and the one used in the operational algorithm (Haley and Brohede, 2007). The standard deviation in retrieved NO2number density for
each set (i.e. fitting window) is calculated over the common altitude range for each of the 33 scans. Natural variability of NO2 is identical since the same limb scans and altitude
ranges are used, so any difference in the standard deviation is due solely to the different spectral fitting windows. Fig-ure 2 (left panel) shows the slight but systematic reduction in NO2variability at all altitudes with the extended fitting
win-dow. Note that the NO2profiles retrieved from the two fitting
windows do not have a significant bias (±1 standard error) between themselves, which points to the self-consistency of NO2spectral cross section between the two windows.
Other benefits of the extended fitting window are that the NO2retrieval uncertainty is improved by ∼ 20 % and the
up-per altitude limit of the retrieval moves slightly higher, as shown in the right panel of Fig. 2 for a sample case. For this tropical case, only at the NO2number density minimum
at 15.5 km is the current retrieval unable to measure NO2
with uncertainty of < 100 %, whereas with the fitting
win-dow of the operational algorithm the measurements are be-low the be-lower detection limit between 11.5 and 17.5 km and at 7.5 km (Fig. 2). The significant upper tropospheric NO2
enhancement at ∼ 10 km is also observed by the mini-SAOZ (not shown).
Figure 3 shows that the impact of the different forward model modes: the 1-D retrieval overestimates NO2by 29 %
relative to the one using the 3-D forward model mode at 17.5 km. Note that relative diurnal gradients are expected to be largest below 18 km. The overestimate for this sample case is due to the larger NO2concentrations that are present
on the far side of the limb (yet neglected by a 1-D model) for a SZA (86.6◦) that is small enough to allow significant far side contribution to the radiance. The increasing NO2
gradient toward the far side of the limb occurs because of the decreasing photolysis frequency of NO2with increasing
SZA. The retrieval using the 2-D forward model underes-timates slightly since the slightly lower NO2concentrations
along the incoming solar beam are not included in that model version. The 3-D forward model clearly reduces the bias vs. SAOZ relative to the 1-D forward model at altitudes below 18 km. This improved precision is demonstrated below for a large ensemble of profiles by contrasting the correlation of the retrievals using the 1-D and 2-D forward model modes and the standard error of the biases relative to coincident bal-loon data. The slightly lower NO2number density at 20.5 km
0 1 2 3 4 5 6 7 Standard deviation of NO2 [molec cm − 3] ×108 10 15 20 25 30 35 40 Altitude [km] 434.8 451 nm 434.8 476.7 nm 0.0 0.2 0.4 0.6 0.8 1.0 1.2 1.4 Number density [molec cm−3] ×10 9 − − 434.8 451 nm 434.8 476.7 nm −
Figure 2. Left: comparison of the standard deviation of the NO2number density profiles retrieved with the new algorithm using the
de-fault window (435–477 nm, green) vs. the fitting window used in the OSIRIS v3.0 operational algorithm (Haley and Brohede, 2007; blue). Right: comparison of a single NO2profile retrieved from scan 20 of orbit 60346 with the algorithm described above using the default window
(435–477 nm) vs. the fitting window used in the OSIRIS v3.0 operational algorithm. The retrieval uncertainty for each profile is bound by a shaded area of matching colour.
0.0 0.5 1.0 1.5 2.0 2.5
Number density [molec cm−3] ×109
10 15 20 25 30 35 Altitude [km] 3-D 2-D 1-D SAOZ
Figure 3. NO2profile retrieved from scan 44 of orbit 16011 us-ing the 1-D, 2-D, and 3-D retrievals, all converted to sunset (tan-gent point SZA = 90◦), the local time of coincident SAOZ mea-surements at Bauru (22.35◦S, 49.03◦W). OSIRIS is on the day side with SZA = 86.6◦ (p.m.) and an azimuth difference angle of 99◦such that the far side of the limb is closer to the terminator.
a minor oscillation due to an overestimation immediately above at 22.5 km where a secondary NO2 number density
peak is observed by OSIRIS.
In order to compare the various OSIRIS NO2products to
the balloon correlative data, all profiles are linearly interpo-lated onto a 1 km grid (12.0–39.0 km) commonly used in the balloon data (see Supplement). The “fast” product tends to be limited in its vertical range at both extremes of the profile, relative not only to the other OSIRIS NO2products but also
to the coincident balloon profiles, and also the “fast” retrieval is not available for some coincidences (Fig. 4). The sample size is ≥ 20 between 13 and 31 km for all OSIRIS NO2
prod-ucts and thus, hereafter, the validation discussion focusses on this altitude range.
The v3.0 operational OSIRIS NO2 has proven to be of
high quality in the 15–42 km range from previous satellite intercomparisons (e.g. Haley and Brohede, 2007) and the same can also be inferred for the upper troposphere from the ability to detect small lightning-generated NO2
enhance-ments with the expected latitudinal and longitudinal distri-bution (e.g. Sioris et al., 2007). Thus, in Fig. 5, we examine the standard error of the coincident profiles for OSIRIS and balloon data to compare the variability of each dataset, simi-lar to Kerzenmacher et al. (2008). The upper altitude limit of the data obtained from balloons launched by CNES (Centre National d’Études Spatiales) is 31 ± 2 km (Table 2). This ex-cludes MkIV and SAOZ-BrO. From 31 down to 28 km, the balloon-borne NO2 profiles show more scatter than any of
the OSIRIS data products. This is likely due to the need to as-sume the NO2vertical distribution above float altitude for the
remote sensors, which is particularly problematic in the trop-ics where the NO2profile typically peaks at a higher altitude
ab-0 10 20 30 40 50
Coincident sample size
10 15 20 25 30 35 40 Altitude [km] v3.0 Fast 1-D
Figure 4. Sample size of coincident balloon data vs. altitude and as a function of retrieval algorithm. Sample size vs. height for 2-D mode is identical to that for 1-D mode.
sorption signal for the remotely sensing balloon instruments due to the short path lengths when observing altitudes near float. Below 16 km, the balloon data clearly exhibit less scat-ter than OSIRIS, thereby quantitatively supporting the choice of balloon validation data for reasons discussed in Sect. 1. Kerzenmacher et al. (2008) show that this is not true for NO2
at ∼ 15 km measured by the ACE (Atmospheric Chemistry Experiment) satellite instruments relative to OSIRIS v3.0 NO2. Between the three OSIRIS products, “fast” exhibits
the largest scatter at all altitudes, whereas the 2-D algorithm described here offers noticeably less scatter between 15 and 20 km as compared to the v3.0 product. The 3-D algorithm takes 1.5 h to retrieve a profile on the computer specified above and thus the entire set of balloon-coincident OSIRIS limb scans was not processed. The 2-D algorithm takes half of the processing time of the 3-D algorithm.
To determine whether OSIRIS NO2is biased relative to
the balloon data, we studied medians and means of individ-ual profile differences over all coincidences (as a function of altitude). These results are shown in Figs. 6 and 7. It is clear that all of the OSIRIS NO2 algorithms have a statistically
significant bias near the NO2peak (typically ∼ 30 km). This
overestimate near the peak is similar to the overestimate by OSIRIS v3.0 relative to ACE Fourier transform spectrom-eter and MAESTRO (Measurements of Aerosol Extinction in the Stratosphere and Troposphere Retrieved by Occulta-tion), which coincided with the NO2 peak altitude. Local
biases were +17 and 14 %, respectively (Kerzenmacher et al., 2008). Haley and Brohede (2007) found no such overes-timate at the peak vs. SAGE III and POAM (Polar Ozone and Aerosol Measurement) III, but a similar positive bias near
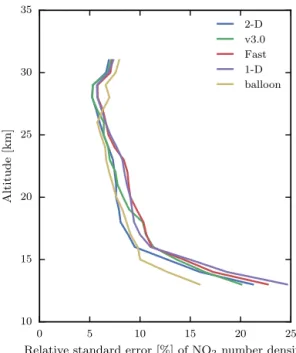
0 5 10 15 20 25
Relative standard error [%] of NO2number density
10 15 20 25 30 35 Altitude [km] 2-D v3.0 Fast 1-D balloon
Figure 5. Relative standard error of coincident NO2profiles. Note
that OSIRIS profiles have been scaled to various local times of the balloon measurements, which adds random error to the OSIRIS pro-files due to random variations between the photochemical model atmosphere and the true atmosphere.
∼28 km vs. HALOE (Halogen Occultation Experiment). The “fast” product has the largest overestimate at the peak, averaging ∼ 20 % with a sharp gradient in its bias, such that, at 18 km, there is a statistically significant ∼ 20 % underesti-mate. The retrieved profiles using the 2-D retrieval described above have a similar bias profile shape with “fast” (Figs. 6, 7) but are of smaller amplitude, with a ∼ +10 % typical median bias at the number density peak for the 2-D retrieval and a ∼10 % underestimation at 18 km, which is statistically in-significant in terms of the median bias (Fig. 6). The bias of the v3.0 product is similar to the alternative OSIRIS NO2
products above 20 km, but between 15 and 17 km there is a significant positive bias using both central tendency statis-tics (Figs. 6, 7). In contrast to “fast” and v3.0 products, there are no altitudes in the lower stratosphere (below 24 km) with statistically significant average and median biases for the 1-D and 2-1-D products. This conclusion is not sensitive to the use of the MS approximation used for the 1-D product (see Sect. 2.3) (not shown).
While Figs. 6 and 7 address the systematic errors of the various OSIRIS products, it is also important to consider the precision of these data since a product whose biases in indi-vidual profiles average to zero could still fail to adequately capture the variability. This is potentially a greater concern for the v3.0 product since it relies slightly on a priori NO2
and vertically smooths the retrieved NO2when measurement
precision is lacking. However, Haley and Brohede (2007) and Haley et al. (2004) show that these are very minor concerns
−40 −20 0 20 40 10 15 20 25 30 35 40 Altitude [km] 2-D −40 −20 0 20 40 v3.0 −40 −20 0 20 40 Fast −40 −20 0 20 40 1-D (OSIRIS-balloon)/OSIRIS
Figure 6. Median of individual biases vs. balloon data. The error bar shows ±1 standard error of the median NO2bias profile. The median
and standard error of the individual biases are converted to relative quantities by dividing by the corresponding median OSIRIS NO2profile
(scaled to balloon local time). The relative median bias profiles for the other three algorithms are shown in grey for comparison.
−40 −20 0 20 40 10 15 20 25 30 35 40 Altitude [km] 2-D −40 −20 0 20 40 v3.0 −40 −20 0 20 40 Fast −40 −20 0 20 40 1-D (OSIRIS-balloon)/OSIRIS
Figure 7. Same as Fig. 6, but the bias is an average over individual differences between OSIRIS and balloon correlative data. The average and standard error of the individual biases are converted to relative quantities by dividing by the corresponding average OSIRIS NO2profile
(scaled to balloon local time).
as the measurement response and vertical resolution do not deteriorate significantly down to an altitude of 12 km. Fig-ure 8 shows that the v3.0 product captFig-ures the variability of the balloon measurements down to ∼ 22 km as well as the 2-D and 1-D products and better than “fast” NO2, but then
has larger scatter below 20 km than the 2-D and “fast” prod-ucts. The “fast” retrieval benefits from more accurate forward modelling than the v3.0 algorithm. The reduced scatter for the “fast” NO2product in the lower stratosphere is unlikely
to be a difference between inversion approaches (MART vs. the optimal estimation approach used in the v3.0 algorithm)
as discussed above. The new product also may have an edge over the v3.0 product by virtue of using SaskTran as its for-ward model. For the 2-D mode, there is also the specific ben-efit of the forward model accounting for diurnal gradients in NO2. This can be seen clearly between 13 and 16 km where
profiles retrieved with the 2-D forward model mode tend to be more precise than those retrieved using the 1-D mode due to this built-in photochemical modelling capability. This con-firms the better precision of the 2-D retrieval suggested by Fig. 3 and is only expected for large SZAs (McLinden et al., 2006). Note that errors due to the neglect of diurnally
0.0 0.2 0.4 0.6 0.8 1.0 1.2 1.4
Standard error of differences
[molec cm−3] ×108 10 15 20 25 30 35 40 Altitude [km] 2-D v3.0 Fast 1-D
Figure 8. Standard error of the individual biases relative to balloon correlative data for different OSIRIS NO2products. The curves here correspond to the half-widths of the error bars in Figs. 6 and 7.
varying chemical gradients can alternate in sign depending on the viewing geometry (McLinden et al., 2006; Brohede et al., 2007), so mean or median biases may not be significantly affected by switching from the 1-D to the 2-D RTM mode (Figs. 6, 7), even though the standard error of the individual biases is reduced (Fig. 8).
Correlation can be used as an alternative statistic to verify whether an OSIRIS product captures the variability observed by coincident balloon data. It is different from the standard error statistic used in Fig. 8 since multiplicative or additive biases do not affect the correlation but do affect the standard error of the individual biases. The correlation is calculated over the 46 coincident balloon profiles at each available alti-tude (Fig. 4). Figure 9 shows a general decrease in correlation between OSIRIS and coincident balloon data with decreas-ing altitude. There is higher correlation with balloon NO2
data for the 2-D mode retrieval over the 1-D mode retrieval at the lowest altitudes, consistent with Fig. 3. The correlation of the v3.0 product is comparable with the 1-D and 2-D mode products down to the lowest validated altitudes, whereas the “fast” product has generally lower correlations above 22 km than the OSIRIS NO2products relying on spectral fitting.
Finally, since the coverage of balloon is limited to latitudes north of −22◦S, Fig. 10 is included to illustrate the climato-logical (2001–2015) vertical, meridional, and seasonal vari-ation of stratospheric NO2volume mixing ratio in the
South-ern Hemisphere during austral spring and summer. For each NO2vertical profile, the conversion to mixing ratio uses the
local air density profile from the ECMWF analysis.
0.0 0.2 0.4 0.6 0.8 1.0 Correlation coefficient 10 15 20 25 30 35 40 Altitude [km] 2-D v3.0 Fast 1-D
Figure 9. Correlation between various OSIRIS NO2products and
the balloon validation dataset.
4 Discussion
Next, we review and discuss the sensitivity of the retrieval to forward model parameters. There is a slight sensitivity of the retrieved NO2to changes in aerosol extinction. Previous
sensitivity studies (Sioris et al., 2003; Haley et al., 2004) are consistent with the current findings. The scene albedo in the visible can vary from < 0.03 for calm ocean to almost unity for fresh snow, although the NO2retrieval is, by design,
in-sensitive to surface albedo by virtue of the high-TH normal-ization of the radiance spectra (Sioris et al., 2003). Use of the retrieved scene albedo (instead of the default value of 0.3) and of the v5.07 aerosol extinction profile further reduce these sensitivities. Finally, use of OSIRIS-observed (v5.07) ozone instead of the default ozone climatology in SaskTran (McPeters et al., 2007) is expected to have a minor impact on retrieved NO2via errors in modelling the atmospheric
ex-tinction based on Sioris et al. (2007).
With a method that involves simulating spectra at high THs for the purpose of normalizing radiances simulated for THs within the retrieval range, the forward model must accu-rately compute the radiance over a large range of THs. The NO2retrieval error due to the pseudo-spherical
approxima-tion is expected to have its largest impact at low altitudes because of the vertical gradient in pseudo-spherical RTM er-rors (Griffioen and Oikarinen, 2000). At the top of the re-trieval range (40 km), the error due to this approximation is cancelled by the use of the high altitude reference.
While not included in Figs. 5–9, Chahine’s relaxation method tends to produce sharper extrema in the retrieved NO2 profile than MART that tend to be slightly displaced
Figure 10. Climatological map of zonal mean NO2volume mixing
ratio (ppb) with 10◦latitudinal binning and 1 km vertical binning centred at altitudes between 9.5 and 39.5 km for November (2001– 2014, top), January (2002–2014, middle), and March (2002–2014, bottom).
the coincidence criterion of 1000 km in distance, but it may also relate to the ∼ 2 km vertical sampling of OSIRIS and the 1 km altitude grid used for the retrieval. If the vertical grid of the retrieval is finer than the vertical sampling, a ver-tically narrow layer at 19 km, for example, would be retrieved as peaking at 18 km when the available radiance spectra are measured at THs of 18 and 20 km. The comparison of MART and Chahine inversion approaches is worth revisiting with the 1 km vertical sampling offered by the Ozone Mapping Profiler Suite (Jaross et al., 2014).
In order to rigorously validate this new retrieval algorithm in the upper troposphere, tropospheric chemistry must be added to the photochemical model used to scale the OSIRIS observations to balloon local time. The reaction of NO2
with the hydroxyl radical to form HNO3drives the diurnal
variation of tropospheric NO2 more than N2O5 photolysis
(Boersma et al., 2009). Accurate knowledge of the seasonal
variation of the OH concentration is required for modelling the diurnal variation of upper tropospheric NO2.
5 Conclusions
Profiles of NO2retrieved from OSIRIS have been improved
in terms of reduced bias and scatter vs. the current v3.0 op-erational algorithm in the lower stratosphere (e.g. 15 km) as determined using highly accurate balloon measurements as truth. The median bias is within ∼ ±10 % between 14 and 37 km.
The benefits of spectral fitting and extending the fitting window to longer wavelengths are evident at the highest al-titudes where the photoelectron shot noise tends to be large relative to the NO2absorption signal, as well as at the lowest
altitudes where the retrieved profile shape is largely driven by small differences in NO2SCDs obtained from spectra at
adjacent tangent heights. Algorithms that exploit the richness of the NO2absorption spectrum are shown to better capture
the mid-stratospheric variability of this key constituent. The use of a fully spherical forward model is an important advan-tage, particularly at lower altitudes since, while the pseudo-spherical RTM errors are largest at the top of the retrieval range, the largest NO2 retrieval errors due to the use of a
pseudo-spherical RTM occur at low altitudes because a high tangent height reference is used in the retrieval.
A model capable of modelling diurnal gradients in NO2
also helps to improve the precision of the retrieved number density profile, particularly at the lowest altitudes where the horizontal gradients in NO2are sharpest and where the
radi-ance is predominantly from the near side of the limb.
Data availability. The OSIRIS NO2data record is currently
avail-able at ftp://odin-osiris.usask.ca/Level2/no2_v6.0.2 following reg-istration.
The Supplement related to this article is available online at doi:10.5194/amt-10-1155-2017-supplement.
Competing interests. The authors declare that they have no conflict of interest.
Acknowledgements. This work was supported by Environment and Climate Change Canada through a contribution to the University of Saskatchewan. The OSIRIS project is supported by the Canadian Space Agency. Daniel Zawada (University of Saskatchewan) is acknowledged for helpful discussions regarding the high spatial resolution version of the SaskTran model. Alexei Rozanov (Univer-sity of Bremen) is acknowledged for sharing his experience with the weighting-function DOAS method. Patrick Sheese (University
of Toronto) provided the idea to use correlation as a statistic for validation. SALOMON-N2, SPIRALE, SAOZ, mini-SAOZ, and LPMA data were obtained from CNES/CNRS-INSU Ether website. Edited by: M. Weber
Reviewed by: two anonymous referees
References
Boersma, K. F., Jacob, D. J., Trainic, M., Rudich, Y., DeSmedt, I., Dirksen, R., and Eskes, H. J.: Validation of urban NO2
concen-trations and their diurnal and seasonal variations observed from the SCIAMACHY and OMI sensors using in situ surface mea-surements in Israeli cities, Atmos. Chem. Phys., 9, 3867–3879, doi:10.5194/acp-9-3867-2009, 2009.
Bourassa, A. E., Degenstein, D. A., Gattinger, R. L., and Llewellyn, E. J.: Stratospheric aerosol retrieval with optical spectrograph and infrared imaging system limb scatter measurements, J. Geo-phys. Res., 112, D10217, doi:10.1029/2006JD008079, 2007. Bourassa, A. E., Degenstein, D. A., and Llewellyn, E. J.: SaskTran:
A spherical geometry radiative transfer code for efficient esti-mation of limb scattered sunlight, J. Quant. Spectrosc. Ra., 109, 52–73, 2008.
Bourassa, A. E., McLinden, C. A., Sioris, C. E., Brohede, S., Bath-gate, A. F., Llewellyn, E. J., and Degenstein, D. A.: Fast NO2 retrievals from Odin-OSIRIS limb scatter measurements, Atmos. Meas. Tech., 4, 965–972, doi:10.5194/amt-4-965-2011, 2011. Bovensmann, H., Burrows, J. P., Buchwitz, M., Frerick, J., Noël,
S., Rozanov, V. V., Chance, K. V., and Goede, A. P. H.: SCIA-MACHY: Mission objectives and measurement modes, J. Atmos. Sci., 56, 127–150, 1999.
Brohede, S., McLinden, C. A., Urban, J., Haley, C. S., Jonsson, A. I., and Murtagh, D.: Odin stratospheric proxy NOy
mea-surements and climatology, Atmos. Chem. Phys., 8, 5731–5754, doi:10.5194/acp-8-5731-2008, 2008.
Brohede, S. M., Haley, C. S., McLinden, C. A., Sioris, C. E., Murtagh, D. P., Petelina, S. V., Llewellyn, E. J., Bazureau, A., Goutail, F., Randall, C. E., Lumpe, J. D., Taha, G., Thoma-son, L. W., and Gordley, L. L.: Validation of Odin/OSIRIS stratospheric NO2 profiles, J. Geophys. Res., 112, D07310,
doi:10.1029/2006JD007586, 2007.
Burrows, J. P., Dehn, A., Deters, B., Himmelmann, S., Richter, A., Voigt, S., and Orphal, J.: Atmospheric remote-sensing reference data from GOME: 1. Temperature-dependent absorption cross-sections of NO2in the 231–794 nm range, J. Quant. Spectrosc.
Ra., 60, 1025–1031, 1998.
Butz, A.: Case studies of stratospheric nitrogen, chlorine and io-dine photochemistry based on balloon borne UV/visible and IR absorption spectroscopy, PhD thesis, Université Paris 6, Paris, 254 pp., 2006.
Butz, A., Bösch, H., Camy-Peyret, C., Chipperfield, M., Dorf, M., Dufour, G., Grunow, K., Jeseck, P., Kühl, S., Payan, S., Pepin, I., Pukite, J., Rozanov, A., von Savigny, C., Sioris, C., Wagner, T., Weidner, F., and Pfeilsticker, K.: Inter-comparison of strato-spheric O3and NO2abundances retrieved from balloon borne
di-rect sun observations and Envisat/SCIAMACHY limb measure-ments, Atmos. Chem. Phys., 6, 1293–1314, doi:10.5194/acp-6-1293-2006, 2006.
Chahine, M. T.: Determination of the temperature profile in an at-mosphere from its outgoing radiance, J. Opt. Soc. Am., 58, 1634– 1637, 1968.
Coldewey-Egbers, M., Weber, M., Lamsal, L. N., de Beek, R., Buchwitz, M., and Burrows, J. P.: Total ozone retrieval from GOME UV spectral data using the weighting function DOAS approach, Atmos. Chem. Phys., 5, 1015–1025, doi:10.5194/acp-5-1015-2005, 2005.
Crutzen, P. J.: Ozone production rates in an oxygen-hydrogen-nitrogen oxide atmosphere, J. Geophys. Res., 76, 7311–7327, 1971.
Degenstein, D. A., Bourassa, A. E., Roth, C. Z., and Llewellyn, E. J.: Limb scatter ozone retrieval from 10 to 60 km using a multiplicative algebraic reconstruction technique, Atmos. Chem. Phys., 9, 6521–6529, doi:10.5194/acp-9-6521-2009, 2009. Ferlemann, F., Camy-Peyret, C., Fitzenberger, R., Harder, H.,
Hawat, T., Osterkamp, H., Schneider, M., Perner, D., Platt, U., Vradelis, P., and Pfeilsticker, K.: Stratospheric BrO profiles mea-sured at different latitudes and seasons: Instrument description, spectral analysis and profile retrieval, Geophys. Res. Lett., 25, 3847–3850, 1998.
Fesen, C. G. and Hays, P. B.: Two-dimensional inversion technique for satellite airglow data, Appl. Optics, 21, 3784–3791, 1982. Griffioen, E. and Oikarinen, L.: LIMBTRAN: A pseudo
three-dimensional radiative transfer model for the limb-viewing imager OSIRIS on the ODIN satellite, J. Geophys. Res., 105, 29717– 29730, 2000.
Haley, C. S. and Brohede, S. M.: Status of the Odin/OSIRIS strato-spheric products O3and NO2data products, Can J. Phys., 85,
1177–1194, 2007.
Haley, C. S., Brohede, S. M., Sioris, C. E., Griffioen, E., Murtagh, D. P., McDade, I. C., Eriksson, P., Llewellyn, E. J., Bazureau, A., and Goutail, F.: Retrieval of stratospheric O3and NO2
pro-files from Odin Optical Spectrograph and Infrared Imager Sys-tem (OSIRIS) limb-scattered sunlight measurements, J. Geo-phys. Res., 109, D16303, doi:10.1029/2004JD004588, 2004. Hultgren, K., Gumbel, J., Degenstein, D., Bourassa, A., Lloyd,
N., and Stegman, J.: First simultaneous retrievals of horizon-tal and vertical structures of Polar Mesospheric Clouds from Odin/OSIRIS tomography, J. Atmos. Sol.-Terr. Phy., 104, 213– 223, 2013.
Jaross, G., Bhartia, P. K., Chen, G., Kowitt, M., Haken, M., Chen, Z., Xu, P., Warner, J., and Kelly, T.: OMPS Limb Profiler instru-ment performance assessinstru-ment, J. Geophys. Res.-Atmos., 119, 4399–4412, doi:10.1002/2013JD020482, 2014.
Jégou, F., Berthet, G., Brogniez, C., Renard, J.-B., François, P., Haywood, J. M., Jones, A., Bourgeois, Q., Lurton, T., Auriol, F., Godin-Beekmann, S., Guimbaud, C., Krysztofiak, G., Gaubicher, B., Chartier, M., Clarisse, L., Clerbaux, C., Balois, J. Y., Ver-waerde, C., and Daugeron, D.: Stratospheric aerosols from the Sarychev volcano eruption in the 2009 Arctic summer, Atmos. Chem. Phys., 13, 6533–6552, doi:10.5194/acp-13-6533-2013, 2013.
Kerzenmacher, T., Wolff, M. A., Strong, K., Dupuy, E., Walker, K. A., Amekudzi, L. K., Batchelor, R. L., Bernath, P. F., Berthet, G., Blumenstock, T., Boone, C. D., Bramstedt, K., Brogniez, C., Brohede, S., Burrows, J. P., Catoire, V., Dodion, J., Drummond, J. R., Dufour, D. G., Funke, B., Fussen, D., Goutail, F., Grif-fith, D. W. T., Haley, C. S., Hendrick, F., Höpfner, M., Huret, N.,
Jones, N., Kar, J., Kramer, I., Llewellyn, E. J., López-Puertas, M., Manney, G., McElroy, C. T., McLinden, C. A., Melo, S., Mikuteit, S., Murtagh, D., Nichitiu, F., Notholt, J., Nowlan, C., Piccolo, C., Pommereau, J.-P., Randall, C., Raspollini, P., Ri-dolfi, M., Richter, A., Schneider, M., Schrems, O., Silicani, M., Stiller, G. P., Taylor, J., Tétard, C., Toohey, M., Vanhellemont, F., Warneke, T., Zawodny, J. M., and Zou, J.: Validation of NO2and
NO from the Atmospheric Chemistry Experiment (ACE), At-mos. Chem. Phys., 8, 5801–5841, doi:10.5194/acp-8-5801-2008, 2008.
Kreycy, S., Camy-Peyret, C., Chipperfield, M. P., Dorf, M., Feng, W., Hossaini, R., Kritten, L., Werner, B., and Pfeilsticker, K.: Atmospheric test of the J(BrONO2)/ kBrO + NO2ratio:
impli-cations for total stratospheric Bry and bromine-mediated ozone loss, Atmos. Chem. Phys., 13, 6263–6274, doi:10.5194/acp-13-6263-2013, 2013.
Llewellyn, E. J., Lloyd, N. D., Degenstein, D. A., Gattinger, R. L., Petelina, S. V., Bourassa, A. E., Wiensz, J. T., Ivanov, E. V., McDade, I. C., Solheim, B. H., McConnell, J. C., Haley, C. S., von Savigny, C., Sioris, C. E., McLinden, C. A., Griffioen, E., Kaminski, J., Evans, W. F., Puckrin, E., Strong, K., Wehrle, V., Hum, R. H., Kendall, D. J. W., Matsushita, J., Murtagh, D. P., Brohede, S., Stegman, J., Witt, G., Barnes, G., Payne, W. F., Piché, L., Smith, K., Warshaw, G., Deslauniers, D.-L., Marc-hand, P., Richardson, E. H., King, R. A., Wevers, I., McCreath, W., Kyrölä, E., Oikarinen, L., Leppelmeier, G. W., Auvinen, H., Mégie, G., Hauchecorne, A., Lefèvre, F., de La Nöe, J., Ricaud, P., Frisk, U., Sjoberg, F., von Schéele, F., and Nordh, L.: The OSIRIS instrument on the Odin spacecraft, Can. J. Phys., 82, 411–422, 2004.
McLinden, C. A., Olsen, S. C., Hannegan, B. J., Wild, O., Prather, M. J., and Sundet, J.: Stratospheric ozone in 3-D Models: A sim-ple chemistry and the cross-tropopause flux, J. Geophys. Res., 105, 14653–14665, 2000.
McLinden, C. A., Haley, C. S., and Sioris, C. E.: Diurnal effects in limb scatter observations, J. Geophys. Res., 111, D14302, doi:10.1029/2005JD006628, 2006.
McPeters, R. D., Labow, G. J., and Logan, J. A.: Ozone climatolog-ical profiles for satellite retrieval algorithms, J. Geophys. Res., 112, D05308, doi:10.1029/2005JD006823, 2007.
Moreau, G., Robert, C., Catoire, V., Chartier, M., Camy-Peyret, C., Huret, N., Pirre, M., Pomathiod, L., and Chalumeau, G.: SPI-RALE: a multispecies in situ balloonborne instrument with six tunable diode laser spectrometers, Appl. Optics, 44, 5972–5989, 2005.
Mount, G. H., Rusch, D. W., Zawodny, J. M., Barth, C. A., and Noxon, J. F.: Measurements of stratospheric NO2
from the Solar Mesosphere Explorer satellite. 1. An overview of the results, J. Geophys. Res., 89, 1327–1340, doi:10.1029/JD089iD01p01327, 1984.
Ogawa, T., Shibasaki, K., and Suzuki, K.: Balloon observation of the stratospheric NO2profile by visible absorption spectroscopy,
J. Meteorol. Soc. Jpn., 59, 410–415, 1981.
Pommereau, J.-P.: Observation of NO2 diurnal variation in the
stratosphere, Geophys. Res. Lett., 9, 850–853, 1982.
Pommereau, J.-P. and Piquard, J.: Ozone and nitrogen dioxide ver-tical distributions by uv-visible solar occultation from balloons, Geophys. Res. Lett., 21, 1227–1230, 1994.
Puk¸¯ıte, J., Kühl, S., Deutschmann, T., Platt, U., and Wagner, T.: Ac-counting for the effect of horizontal gradients in limb measure-ments of scattered sunlight, Atmos. Chem. Phys., 8, 3045–3060, doi:10.5194/acp-8-3045-2008, 2008.
Pundt, I., Pommereau, J.-P., Chipperfield, M. P., Van Roozendael, M., and Goutail, F.: Climatology of the stratospheric BrO vertical distribution by balloon-borne UV–visible spectrometry, J. Geo-phys. Res., 107, 4806, doi:10.1029/2002JD002230, 2002. Rault, D. F.: Ozone, NO2 and aerosol retrieval from SAGE III
limb scatter measurements, Proc. SPIE, 5571, 205–216, doi:10.1117/12.564899, 2004.
Rault, D. F., Loughman, R., and Sioris, C: Retrieval of atmo-spheric ozone and nitrogen dioxide vertical distribution from SAGE III limb scattering measurements, Proc. SPIE, 5235, 298– 309, doi:10.1117/12.509827, 2004.
Renard, J.-B., Chartier, M., Robert, C., Chalumeau, G., Berthet, G., Pirre, M., Pommereau, J.-P., and Goutail, F.: SALOMON: a new, light balloonborne UV–visible spectrometer for nighttime obser-vations of stratospheric trace-gas species, Appl. Optics, 39, 386– 392, 2000.
Rothman, L. S., Gordon, I. E., Barbe, A., Benner, D. C., Bernath, P. F., Birk, M., Boudon, V., Brown, L. R., Campargue, A., Cham-pion, J.-P., Chance, K., Coudert, L. H., Dana, V., Devi, V. M., Fally, S., Flaud, J.-M., Gamache, R. R., Goldman, A., Jacque-mart, D., Kleiner, I., Lacome, N., Lafferty, W. J., Mandin, J.-Y., Massie, S. T., Mikhailenko, S. N., Miller, C. E., Moazzen-Ahmadi, N., Naumenko, O. V., Nikitin, A. V., Orphal, J., Perevalov, V. I., Perrin, A., Predoi-Cross, A., Rinsland, C. P., Rotger, M., Šimeˇcková, M., Smith, M. A. H., Sung, K., Tashkun, S. A., Tennyson, J., Toth, R. A., Vandaele, A. C., and Van-der Auwera, J.: The HITRAN 2008 molecular spectroscopic database, J. Quant. Spectrosc. Ra., 110, 533–572, 2009. Salawitch, R. J., Weisenstein, D. K., Kovalenko, L. J., Sioris, C. E.,
Wennberg, P. O., Chance, K., Ko, M. K. W., and McLinden, C. A.: Sensitivity of ozone to bromine in the lower stratosphere, Geophys. Res. Lett., 32, L05811, doi:10.1029/2004GL021504, 2005.
Serdyuchenko, A., Gorshelev, V., Weber, M., Chehade, W., and Burrows, J. P.: High spectral resolution ozone absorption cross-sections – Part 2: Temperature dependence, Atmos. Meas. Tech., 7, 625–636, doi:10.5194/amt-7-625-2014, 2014.
Sioris, C. E., Haley, C. S., McLinden, C. A., von Savigny, C., Mc-Dade, I. C., McConnell, J. C., Evans, W. F. J., Lloyd, N. D., Llewellyn, E. J., Chance, K. V., Kurosu, T. P., Murtagh, D., Frisk, U., Pfeilsticker, K., Bösch, H., Weidner, F., Strong, K., Stegman, J., and Mégie, G.: Stratospheric profiles of nitrogen dioxide observed by Optical Spectrograph and Infrared Imager System on the Odin satellite, J. Geophys. Res., 108, 4215, doi:10.1029/2002JD002672, 2003.
Sioris, C. E., Kurosu, T. P., Martin, R. V., and Chance, K.: Strato-spheric and tropoStrato-spheric NO2observed by SCIAMACHY: First results, Adv. Space Res., 34, 780–785, 2004.
Sioris, C. E., McLinden, C. A., Martin, R. V., Sauvage, B., Ha-ley, C. S., Lloyd, N. D., Llewellyn, E. J., Bernath, P. F., Boone, C. D., Brohede, S., and McElroy, C. T.: Vertical profiles of lightning-produced NO2 enhancements in the upper
tropo-sphere observed by OSIRIS, Atmos. Chem. Phys., 7, 4281–4294, doi:10.5194/acp-7-4281-2007, 2007.
Sioris, C. E., Zou, J., McElroy, C. T., McLinden, C. A., and Vömel, H.: High vertical resolution water vapour profiles in the upper troposphere and lower stratosphere retrieved from MAESTRO solar occultation spectra, Adv. Space Res., 46, 642–650, 2010. Thomas, R. J. and Donahue, T. M.: Analysis of Ogo 6 observations
of the O I 5577-A tropical nightglow, J. Geophys. Res., 77, 3557-3565, 1972.
Toon, G., Sen, B., Blavier, J.-F., Sasano, Y., Yokota, T., Kan-zawa, H., Ogawa, T., Suzuki, M., and Shibasaki, K.: Compari-son of ILAS and MkIV profiles of atmospheric trace gases mea-sured above Alaska in May 1997, J. Geophys. Res., 107, 8211, doi:10.1029/2001JD000640, 2002.
University of Saskatchewan, ftp://odin-osiris.usask.ca/Level2/no2_ v6.0.2/, last access: 3 March 2017.
Vandaele, A. C., Hermans, C., Simon, P. C., Carleer, M., Colin, R., Fally, S., Mérienne, M. F., Jenouvrier, A., and Coquart, B.: Measurements of the NO2 absorption cross-section from
42 000 cm−1 to 10 000 cm−1 (238–1000 nm) at 220 K and 294 K, J. Quant. Spectrosc. Ra., 59, 171–184, 1998.
Vicomte, M. and Pommereau, J. P.: Mini SAOZ: A Light UV-visible spectrometer sonde for studying convective transport in the stratosphere, in: Proc. 20th ESA Symposium on European Rocket and Balloon Programmes and Related Research, Hyères, France, 22–26 May 2011, ESA SP-700, 321–326, 2011. Warshaw, G. D., Desaulniers, D.-L., and Degenstein, D.: Optical
design and performace of the Odin UV/Visible spectrograph and infrared imager instrument, in: 10th Annual AIAA/USU Con-ference on Small Satellites, Technical Session XII: Instruments & Sensors, American Institute of Aeronautics and Astronautics (AIAA), Logan, Utah, 1996.
Weidner, F., Bösch, H., Bovensmann, H., Burrows, J. P., Butz, A., Camy-Peyret, C., Dorf, M., Gerilowski, K., Gurlit, W., Platt, U., von Friedeburg, C., Wagner, T., and Pfeilsticker, K.: Balloon-borne limb profiling of UV/vis skylight radiances, O3, NO2,
and BrO: technical set-up and validation of the method, At-mos. Chem. Phys., 5, 1409–1422, doi:10.5194/acp-5-1409-2005, 2005.
Wennberg, P. O., Cohen, R. C., Stimpfle, R. M., Koplow, J. P., Anderson, J. G., Salawitch, R. J., Fahey, D. W., Woodbridge, E. L., Keim, E. R., Gao, R. S., Webster, C. R., May, R. D., Toohey, D. W., Avallone, L. M., Proffitt, M. H., Loewenstein, M., Podolske, J. R., Chan, K. R., and Wofsy, S. C.: Science, 266, 398–404, 1994.
Wetzel, G., Bracher, A., Funke, B., Goutail, F., Hendrick, F., Lambert, J.-C., Mikuteit, S., Piccolo, C., Pirre, M., Bazureau, A., Belotti, C., Blumenstock, T., De Mazière, M., Fischer, H., Huret, N., Ionov, D., López-Puertas, M., Maucher, G., Oel-haf, H., Pommereau, J.-P., Ruhnke, R., Sinnhuber, M., Stiller, G., Van Roozendael, M., and Zhang, G.: Validation of MIPAS-ENVISAT NO2operational data, Atmos. Chem. Phys., 7, 3261–
3284, doi:10.5194/acp-7-3261-2007, 2007.
Wetzel, G., Oelhaf, H., Kirner, O., Friedl-Vallon, F., Ruhnke, R., Ebersoldt, A., Kleinert, A., Maucher, G., Nordmeyer, H., and Orphal, J.: Diurnal variations of reactive chlorine and nitrogen oxides observed by MIPAS-B inside the January 2010 Arctic vortex, Atmos. Chem. Phys., 12, 6581–6592, doi:10.5194/acp-12-6581-2012, 2012.
Zawada, D. J., Dueck, S. R., Rieger, L. A., Bourassa, A. E., Lloyd, N. D., and Degenstein, D. A.: High-resolution and Monte Carlo additions to the SASKTRAN radiative transfer model, At-mos. Meas. Tech., 8, 2609–2623, doi:10.5194/amt-8-2609-2015, 2015.


![[PDF] Cours de Microsoft Office Word Perfectionnement | Cours informatique](data:image/gif;base64,R0lGODlhAQABAIAAAP///wAAACH5BAEAAAAALAAAAAABAAEAAAICRAEAOw==)