Development of a Co-Dispersion Binder for the
Three-Dimensional Printing Process to Facilitate Handling
of Ceramic Casting Shells in the Green State
by
Richard Li-Chao Yu
B.S. Mechanical Engineering, 1992
University of California, Berkeley, CA
Submitted to the
Department of Mechanical Engineering
in Partial Fulfillment of the Requirements for the Degree of
Master of Science in Mechanical Engineering
at the
Massachusetts Institute of Technology
May, 1994
@ Massachusetts Institute of Technology, 1994. All rights reserved.
Signature of Author
Departmeni wMechanical Engineering May, 1994
Certified by_
Emanuel M. Sachs Associate Professor, Mechanical Engineering Thesis Supervisor Accepted by WITHDRAWN MAF891ý - INSTIT MIT
LfRAI!fW
IAUGn1g994g
Ain A. Sonin Chairman, Graduate CommitteeLi_ j
FnA,
I
Certified by
Development of a Co-Dispersion Binder for the
Three Dimensional Printing Process to Facilitate Handling of
Ceramic Casting Shells in the Green State
by
Richard Li-Chao Yu
Submitted to the Department of Mechanical Engineering in partial fulfillment of the requirements for the degree of
Master of Science in Mechanical Engineering May, 1994
Abstract
Three Dimensional Printing, a rapid prototyping technology, fabricates ceramic casting shells directly from 3-D CAD models. To create a shell, loose alumina powder in thin layers is joined by selectively depositing a colloidal silica binder. Firing fuses the sil-ica to the alumina, and subsequent processing removes the unbound powder from the cast-ing cavity. In some instances, it may be advantageous to perform powder removal before firing. This requires higher green strength than what is obtainable with the current binder.
An alternative binder consisting of 18 vol.% colloidal silica co-dispersed with 10 vol.% acrylic emulsion in an aqueous medium was developed. The polymeric compo-nent imparts higher green strength to the part (3.6 vs. 0.4 MPa), yet decomposes during fir-ing to minimize interference with the fusion of silica to alumina. The reduction of fired strength in samples printed with co-dispersions was less than 10%.
Through designed experiments, performance of the co-dispersion was quantified by additional criteria such as shrinkage, warping, and binder stability. Average linear shrink-age in parts printed with co-dispersions was 0.05% after firing at 9000C. A simple model
for warping, based on elastic response of a plate to free thermal strain, predicts that flat plates tend to warp into a paraboloid after firing. The experimental results correlated well with this prediction.
Thesis Supervisor: Dr. Emanuel M. Sachs
Dedication
This is for my parents Peter and Angel, my brother Leon, and my grandmother Womin. Thank you for supporting and believing in me every step of the way.
Acknowledgments
The author gratefully acknowledges the support of the National Science Foundation under the Strategic Manufacturing Initiative and the support of ARPA. The support from the members of the of the 3D Printing Consortium (United Technologies, Howmet, Johnson & Johnson, Boeing, AMP, Proctor and Gamble, Sandia National Labs, Hasbro, Ashland Chemical, and Draper Labs) is also gratefully acknowledged. The author also wishes to thank the MIT Leader for Manufacturing Program.
Ely Sachs, thank you for your guidance in the past years. You always found time in your busy schedule for my questions and problems.
Thank you, Mike Cima, for helping me stumble through that black magic known as material science. Your advice has been invaluable.
To all of the 3DP'ers past and present, thank you for creating this wonderful technology. In particular, I wish to thank:
Jain Charnnarong for the team effort on shrinkage and warping. Start working on your thesis now!
Jim Bredt for putting up with my never ending questions and for harassing me in my final hours of thesis writing.
Jim Serdy for the late night print sessions. Break a leg, Jim!
Dave Brancazio for telling everyone what not to do in the lab. Good luck with the house search, Dave.
Tim Anderson for knowing every conceivable UNIX command and program and the non-sequitur comments.
Steve Michaels for complaining about the proto machine. Live long and prosper! Alain Curodeau and Tailin Fan for our rap session in 35-336.
Chris Shutts for the sanity checks at Flat Top Johnny's. When are you going to get that free cue?
Satbir Khanuja and Jae Yee for teaching me how to destroy every piece of equip-ment in Building 12.
John Lee for the 3DP figures and for being the only other guy in the lab from Cali-fornia. Too bad you went to Stanford.
Tom Nowak, thanks for the reality checks and the procrastination sessions. To Jon Tom, your friendship has made Boston more bearable, but just a little bit!
My deepest thanks goes to Lauren Lao. I wouldn't have made it without your support and understanding.
Contents
A bstract ... ... 2
D edication ... ... 3
A cknow ledgm ents ... ... 4
C ontents ... ... 5
List of Figures ... ... 7
L ist of T ables ... 10
1 Three Dimensional Printing ... 12
1.1 Overview ... 12
1.1.1 Current Applications ... ... 12
1.2 G reen Strength ... ... 13
1.3 Development Approach ... ... 14
2 Infiltration Studies ... ... 16
2.1 Process Concepts and Technique ... ... 16
2.2 Microscopic Examination ... 18 2.2.1 Sample Preparation ... 18 2.2.2 Observations ... ... ... 20 2.3 Strength Measurements ... ... 28 2.3.1 Measurement Procedure ... ... 28 2.3.2 Strength Results ... ... 29 2.4 Conclusions on Infiltration ... 31 3 C o-D ispersions ... ... 33
3.1 Process Concept and Technique ... ... 34
3.2 Overview of the Printhead ... 34
3.3 Prelim inary Investigation ... 36
3.3.1 The Nozzle Test Stand ... 37
3.3.2 Jet Stability Results ... 38
3.3.3 Printing Test Bars ... 40
3.3.4 R esults ... ... 41
3.4 Reform ulation ... ... 45
3.4.1 MOR Results ... ... 46
3.5 Commercial Green Strength Additives ... ... 49
3.5.1 Compatibility Issues ... 50
3.5.2 Ludox SK ... ... 50
3.5.3 Printing Procedure ... 51
3.6 Conclusions on Co-Dispersions ... ... 54 4 Post Processing ... ... 56 4.1 Firing Schedule ... ... 56 4.1.1 Thermo-Gravimetric Analysis ... ... 57 4.1.2 Firing Temperature ... 60 4.1.3 Conclusions on Firing ... 61 4.2 Powder Removal ... 61 4.2.1 Microwave Boiling ... 62 4.2.2 Temperature Considerations ... ... 62
4.2.3 Soda Water Technique ... 62
4.2.4 Refinements ... 63 5 Dimensional Control ... 67 5.1 Shrinkage ... ... 68 5.1.1 Contributing Factors ... 68 5.1.2 Experimental Procedure ... ... 70 5.1.3 Results ... ... 72 5.1.4 Conclusions on Shrinking ... 78 5.2 W arping ... 79 5.2.1 Working Model ... ... 79 5.2.2 Experimental Procedure ... 81 5.2.3 R esults ... ... 83 5.2.4 Conclusions on Warping ... 93 5.3 D rooping ... ... 100 5.3.1 Experimental Procure ... 100 5.3.2 R esults ... ... 10 1 6 Conclusions ... 103 R eferences ... ... 107
A Metal Matrix Composites ... ... ... 108
B List of Binder Material ... 110
List of Figures
Figure 1.1: Figure 1.2: Figure 2.1: Figure 2.2: Figure 2.3: Figure 2.4: Figure 2.5: Figure 2.6: Figure 2.7: Figure 2.8: Figure 2.9: Figure 2.10: Figure 2.11: Figure Figure Figure Figure Figure Figure Figure Figure Figure Figure Figure Figure Figure Figure Figure Figure Figure 2.12: 2.13: 2.14: 2.15: 2.16: 3.1: 3.2: 3.3: 3.4: 3.5: 3.6: 3.7: 3.8: 3.9: 3.10: 3.11: 3.12:The Three Dimensional Printing Process Cycle ... 13
Shell produced by 3D Printing with the Resulting Casting ... 14
Flowchart of the steps in the Infiltration Process ... 17
Two Possible Configurations for Necks After Infiltration. ... 18
Layout of the Proto-3D Printing Machine ... 20
Micrograph of Necks in Crosslinked Rhoplex Test bars ... 21
Closeup of a Crosslinked Rhoplex Neck ... 21
Necks printed with Rhoplex and infiltrated with Nyacol 9950 colloidal sili-ca after drying at room temperature. ... ... 22
A Rhoplex neck enclosed in dried silica. ... 23
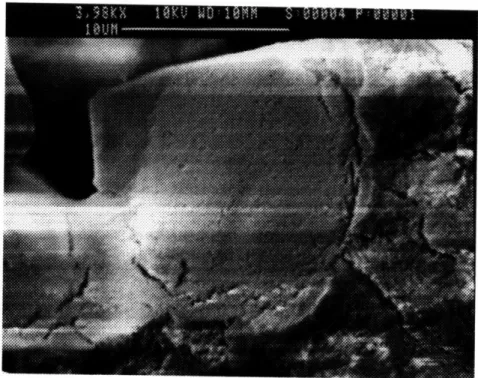
A fracture surface of a neck in an infiltrated test bar after firing at 7500C...23
A "ring" of silica, after Rhoplex has decomposed by firing at 7500C ... 24
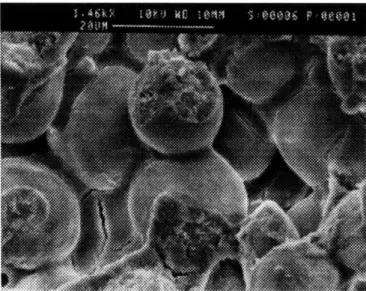
Necks in a sample printed with silica binder, fired at 7500C. The necks are well formed and exhibit good wetting of silica on alumina. ... 24
Fracture surface of a neck in a sample printed with silica binder. The neck is solid with silica ... 25
Neck in an infiltrated sample after firing at 9000C ... 26
Silica "blob" showing poor wetting in infiltrated sample fired at 9000C ....26
Neck in a sample printed with silica binder and fired to 9000C ...27
Sample made by infiltration and fired to 1100C ... 27
Sketch of four-point bend test apparatus ... 29
Flowchart of printing ceramic casting shells with co-dispersions ... 35
Schematic of the nozzle test stand ... ... 37
Flowrate versus time, 1:1 co-dispersion ... ... 39
Stream position versus time, 1:1 co-dispersion, with final filter. ... 39
Stream position versus time, 1:1 co-dispersion, no final filter. ... 40
Necks of test bar printed with co-dispersion, fired at 7500C ... 41
Close-up of a neck in a co-dispersion bar fired at 7500C. ... 42
MOR data for infiltration with Nyacol 9950, 1:1 co-dispersion. ... 43
MOR for 1) 1:1 co-dispersion in spherical powder ... 44
Green MOR versus percent polymer for HA-16 ... 48
MOR versus percent HA-16 polymer, fired at 9000C ... 48
Comparison of good droplet formation (on the left) and poor droplet forma-tion (on the right) ... 52
Figure 3.13: Figure 3.14: Figure 3.15: Figure 4.1: Figure 4.2: Figure 4.3: Figure 4.4: Figure 4.5: Figure 4.6: Figure 4.7: Figure 4.8: Figure 4.9: Figure 5.1: Figure 5.2: Figure 5.3: Figure 5.4: Figure 5.5: Figure 5.6: Figure 5.7: Figure 5.8: Figure 5.9: Figure 5.10: Figure 5.11: Figure 5.12: Figure 5.13: Figure 5.14: Figure 5.15:
Green MOR for HA-16 and AC-604 co-dispersions. ... 54
MOR (fired @ 9000C) for co-dispersion containing 10 vol.% HA-16 and co-dispersion containing 10 vol.% AC-604. ... 55
Comparison of green MOR for various binders ... 55
TGA for stock Rhoplex HA-16 in air ... ... 57
Standard Rhoplex binder for printing metal parts, TGA performed in nitro-gen. ... ... ... 59
TGA of 1:1 mixture of Standard silica binder and Standard Rhoplex binder. TGA performed in air. ... ... 59
MOR vs. firing temperature for Standard binder/powder ... 60
First part for testing powder removal ... 63
Schematic of powder removal setup using soda water ... 64
Picture of the new powder removal part showing the internal channels...65
Powder removal part printed using co-dispersion in powder with 0.3% citric acid ... ... 66
Powder removal part printed using co-dispersion in powder with 0.5% citric acid ... ... 66
Schematic view of a side section of shrinkage bars with markers. ... 71
Shrinkage of bars printed with 10-17 vol.% Rhoplex-silica co-dispersion in powder with 0.3 wt.% citric acid. ... ... 73
Shrinkage of bars printed with Standard silica binder in powder with 0.3 wt.% citric acid. ... 74
Shrinkage of bars printed with 10-17 vol.% Rhoplex-silica co-dispersion in powder with 0.5 wt.% citric acid. ... ... 75
Shrinkage of bars printed with Standard silica binder in powder with 0.5 wt.% citric acid. ... 76
Shrinkage after firing in bars printed with co-dispersion (10% Rhoplex- 18% silica) in powder with 0.3 wt.% compared to bars printed in 0.5 wt.% citric acid. ... ... 77
Shrinkage of bars printed with the Standard Rhoplex binder. ... 78
The plate used for warping measurements. All dimensions are given in mil-lim eters ... ... 82
Contour plot and regression data for silica plate, fired at 9000C, sample #1 (right side of powder bed) ... ... 85
Contour plot and regression data for silica plate, fired at 9000C, sample #2 (middle of powder bed). ... 86
Contour plot and regression data for silica plate, fired at 9000C, sample #3 (left side of the powder bed). ... 87
Contour plot and regression data for TRIS co-dispersion plate, crosslinked at 1600C, sample #1 (right side of powder bed). ... 88
Contour plot and regression data for TRIS co-dispersion plate, crosslinked at 1600C, sample #2 (middle of powder bed). ... 89
Contour plot and regression data for TRIS co-dispersion plate, crosslinked at 1600C, sample #3 (left side of the powder bed). ... 90
Contour plot and regression data for ammonia co-dispersion plate, crosslinked at 1600C, sample #1 (right side of powder bed). ... 91
Figure 5.16: Figure 5.17: Figure 5.18: Figure 5.19: Figure 5.20: Figure 5.21: Figure 5.22: Figure 5.23:
Contour plot and regression data for ammonia co-dispersion plate, crosslinked at 1600C, sample #3 (right side of powder bed). ... 92 Contour plot and regression data for TRIS co-dispersion plate, fired at 9000C, sample #1 (right side of powder bed). ... 94 Contour plot and regression data for TRIS co-dispersion plate, fired at 9000C, sample #2 (middle of powder bed). ... 95
Contour plot and regression data for TRIS co-dispersion plate, fired at 9000C, sample #3 (left side of powder bed). ... 96 Contour plot and regression data for the top surface of silica plate, fired at 9000C, sample #1 (right side of powder bed). ... 97
Contour plot and regression data for the top surface of silica plate, fired at 9000C, sample #2 (middle of powder bed). ... 98
Contour plot and regression data for the top surface of silica plate, fired at 9000C, sample #3 (left side of powder bed). ... 99 Drooped bar fired at 9000C for 2 hours in a two-point simply supported con-figuration versus straight bar fired fully supported in unprinted powder .. 101
List of Tables
Table 2.1: Composition of the "Standard" Binder for Metal Parts ... 19
Table 2.2: MOR of infiltration samples made with 30 gm spherical powder ... 30
Table 3.1: MOR of HA-16 co-dispersions with varying polymer content ... 47
Table 3.2: Commercial Green Strength Products ... ... 49
Chapter 1
Three Dimensional Printing
1.1 Overview
To remain competitive in today's global community, manufacturers must constant-ly improve their development process by reducing time to market and increasing flexibility of manufacturing processes. A new technology that addresses these issues and aids in streamlining the product development cycle is Three Dimensional Printing (3D Printing or 3DP®).
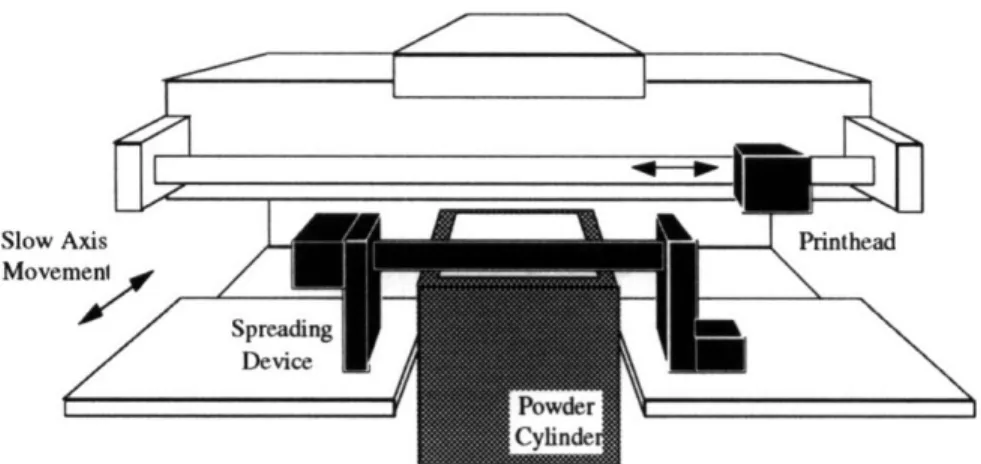
One of a group of manufacturing processes collectively known as Rapid Prototyp-ing, Three Dimensional Printing fabricates parts directly from computer models. A "slic-ing" algorithm first generates two-dimensional layers from a 3-D CAD model. To create these slices, regions in a thin layer of fine powder are selectively joined together by the dep-osition of a binder via a rastering ink-jet printhead. The powder bed, which rests on a mov-ing piston, lowers so that a fresh layer of powder can be spread and printed. Sequential layers laminate to form the solid object. A heat treatment bonds and strengthens the printed regions. Subsequent processing removes the unbound powder from the fabricated part. Figure 1.1 illustrates these steps.
1.1.1
Current Applications
Three Dimensional Printing works with ceramics, metals, polymers, and biological substances. The most frequently used system is aluminum oxide powder with colloidal
sil-1
Spread Powder Layer
F
Print Selected Area
1
F
Lower Platform Repeat Cycle
Last Layer Printed Completed Part
Figure 1.1: The Three Dimensional Printing Process Cycle
ica binder.
Due to its additive nature, 3D Printing can produce parts with complex curvatures, unsupported overhangs, internal features, and cross-directional voids. No specific tooling is required. The process is ideally suited for direct fabrication of metal tooling for injection molding, porous ceramic pre-forms for metal-matrix composites, and ceramic shells for metal castings. A shell made by 3D Printing and a casting from an identical shell are shown in Figure 1.2.
1.2 Green Strength
The alumina/silica material system requires high temperature firing to fuse the sil-ica to the alumina. Before firing, only a weak network of gelled silsil-ica particles holds a part together. The green strength, defined as the modulus of rupture in this state, is on the order of 0.4 MPa. This makes unfired parts fragile and difficult to handle.
Figure 1.2: Shell produced by 3D Printing with the Resulting Casting
Low green strength complicates removal of the printed part from the powder bed and the removal of loose powder from the internal cavities. As a result, the part is fired while encased in a large amount of unprinted powder. This increases cycle time in the
fur-nace.
Recycling of the unprinted powder is also a concern. The powder requires repro-cessing after firing, adding time and cost to the process. Increasing the green strength al-lows removal of unprinted powder from parts before firing.
There are other applications of 3D Printing where high green strength is not only desirable, but necessary. One example is the printing of pre-forms for metal matrix com-posite applications, which is discussed in Appendix A.
This thesis presents the development of a binder system to achieve higher green strength in ceramic parts produced by Three Dimensional Printing.
1.3 Development Approach
Three Dimensional Printing also make metal parts using an acrylic latex emulsion binder. This latex provides good green strength, but thermally decomposes at elevated
tem-peratures. Therefore it is unsuitable as the only binder in a casting shell. The motivation for this research is to combine the low-temperature strength of latexes with the high-tempera-ture characteristics of silica to create a new binder system.
Two possible strategies were devised. The first technique prints parts with latex and subsequently infiltrates them with colloidal silica. The second approach prints a co-disper-sion of the two binders. These methods are referred to as "infiltration" and "co-disperco-disper-sion".
The performance of infiltration and co-dispersion were rated by the following cri-teria with the current silica binder as baseline:
1. Improvement in green strength 2. Effect on fired strength
3. Stability, which means the binder will remain dispersed for a reasonable period of time.
4. Printability, which involves stability of the binder jet, binder/powder interac-tion, and filtration considerations.
5. Ease of powder removal
Chapter 2
Infiltration Studies
The ink-jet printhead used in Three Dimensional Printing works with several dif-ferent binders. For example, metal tooling for injection molding are printed with Rhoplex@ HA- 16, tradename for a self-crosslinking acrylic polymer emulsion produced by the Rohm and Hass Company (Philadelphia, PA). Since these parts can be readily handled after dry-ing, they must be stronger than unfired parts printed with colloidal silica. Crosslinking at 1600C imparts additional water resistance to these parts for post processing. A printing and post processing strategy was devised to utilize these properties of Rhoplex.
2.1 Process Concepts and Technique
Alumina parts can be printed with Rhoplex binder and removed from the powder bed before firing. After heating to the crosslinking temperature (1600C), the shells should
be strong enough to be handled. The unprinted powder in the internal cavities can also be removed at this point.
To produce the refractory characteristics required for a metal casting shell, silica is introduced after powder removal. Dipping a dried shell into colloidal silica allows infiltra-tion via capillary acinfiltra-tion. Firing at high temperature causes silica to soften and fuse to the alumina particles. The shell is then ready for metal pouring. A flowchart of the process is shown in Figure 2.1.
Figure 2.1: Flowchart of the steps in the Infiltration Process
After infiltration, both polymer and silica are present at the necks, or the points of contact between alumina particles. Questions remained as to the physical configuration of the necks. One hypothesis suggests an inner region of acrylic polymers surrounded by a layer of silica. A less likely possibility is a homogeneous distribution of polymer and silica particles. This can happen only if the infiltrant silica somehow dissolves and mixes with the crosslinked Rhoplex. Figure 2.2 depicts simplified schematics for both kinds of necks. Consisting mostly of hydrocarbons, the Rhoplex polymer decomposes into COx gases and water vapor at temperature above 3000C. This is also referred to as burnout, and
is an integral part of powder metallurgy and powder injection molding. We hoped that dur-ing the firdur-ing of an infiltrated part, Rhoplex will decompose. When the temperature passes 7500C, silica begins to soften and to fill the voids left by burnout. The shell strengthens as
Homogeneous distribution
homogeneous mixture
Figure 2.2: Two Possible Configurations for Necks After Infiltration.
the silica softens and fuses to the alumina particles.
2.2 Microscopic Examination
While infiltration is simple in theory, many issues remained. Burnout of the poly-mer might not be complete, and non-organic impurities can also be created. Impurities may affect the fusing of silica to alumina. In addition, unfilled voids in the necks may adversely affect the strength of the bond between silica and alumina. To address these issues, the necks of infiltrated parts were examined.
2.2.1
Sample Preparation
Stock Rhoplex@ HA-16 contains 45.5% solids and has a viscosity of 600 centi-poise. Diluting 1:1 by weight with distilled water decreases the viscosity to a point that is acceptable for 3D Printing. Experience with metal parts showed that the addition of 1% by weight (wt.%) of tetramethylammonium hydroxide ([CH3]4NOH), a base and humectant, aids in the stability of the binder stream. Samples were printed with this formulation, which is the "Standard" binder for printing metal parts.
While several type of alumina (A1203) powder have been used in 3D Printing, the
alumina ; alumina
Discrete Layers
Rhoplex coreI
Table 2.1: Composition of the "Standard" Binder for Metal Parts
Binder Components
Proportion
stock Rhoplex HA-16 49.5 weight% distilled water 49.5 weight%
TMAH
1.0 weight%
most common is Norton 7920 from the Norton Company (Waltham, MA). This is an elec-tronic grade (99+% pure) powder with platelet shaped particles that are 28 gm wide on av-erage. It is chemically produced, readily available, and relatively inexpensive. Another powder is Alunabeads CB-A30S, a spherical alumina powder produced by Showadenko (Japan) and distributed by ICD Group Inc. (Lyndhurst, NJ). This powder is not normally used in the production of shells because it is much more expensive than the 7920.
Past work showed that necks in spherical powders are more observable than those in platelet-shaped powders, since the particles only make point contact with each other. The platelet powder, on the other hand, forms irregularly shaped contact surfaces [Lauder
1992]. To facilitate locating and examining necks, the spherical powder was selected. A file was generated to print test bars nominally 1.0" long and 0.125" by 0.125" in cross section. The bars were made on the older, or proto, 3D Printing machine using 0.007" for both line-to-line separation and layer thickness. The printhead scanned at 65 in/sec and the binder flowrate was 1.2 ml/min. These are the standard machine parameters for printing ceramic shells. Figure 2.3 below is a schematic of the proto machine.
After crosslinking at 1600C and cooling to room temperature, some of the bars were
infiltrated by dipping. The infiltrant was Nyacol 9950, an aqueous silica dispersion con-taining 50 wt.% of 100 nm silica particles (Nyacol Products Inc., Ashland, MA). Driven by capillary forces, the dispersion wicks into the test bars and fills the pores. These samples were dried and fired at 7500C, 9000C, and 11000C for 2 hours.
To provide a basis of comparison, similar bars were printed using the "Standard" silica binder. This binder consists of Nyacol 9950 diluted with distilled water to a specific
Figure 2.3: Layout of the Proto-3D Printing Machine
gravity of 1.21. Tetramethylammonium hydroxide (TMAH) is added to increase the pH of to 10, since aqueous suspensions of colloidal silica are most stable in the >pH 8.5 range [Hler 1979]. These bars were also fired at 7500C, 9000C, and 11000C.
Breaking the bars revealed the necks in the internal regions. After mounting and gold coating, the samples were examined in a scanning electron microscope.
2.2.2 Observations
The following figures are high magnification micrographs of the observed necks. Figure 2.4 below shows typical interparticle necks formed by Rhoplex after crosslinking. They are smooth and narrow, with an average diameter of 5 gtm. A higher magnification view of a neck is shown in Figure 2.5.
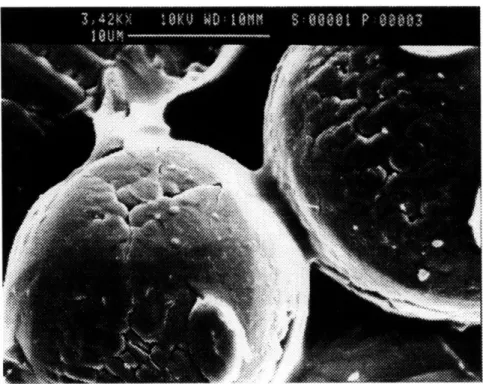
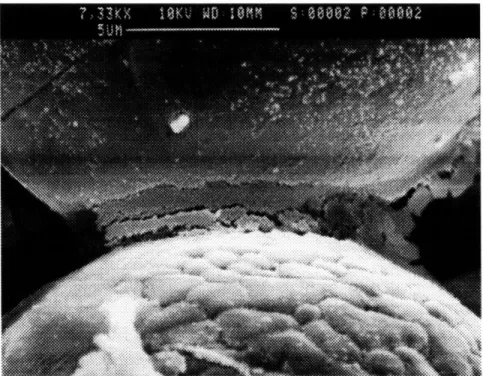
These micrographs indicate that necks formed by Rhoplex are solid, with no visible porosity. So it is unlikely that infiltration with silica will produce the homogeneous neck depicted in Figure 2.2, which the following micrographs confirm. The brighter areas in the infiltrated sample are silica deposits that have formed a ring around the Rhoplex (see Figure 2.6). A close-up view of a Rhoplex neck enclosed in silica is shown in Figure 2.7. The surface exhibits cracking that is typical of a dried gel. Compare the appearance of this neck to that of the pure Rhoplex.
Figure 2.4: Micrograph of Necks in Crosslinked Rhoplex Test bars
Figure 2.6: Necks printed with Rhoplex and infiltrated with Nyacol 9950 colloidal silica after drying at room temperature.
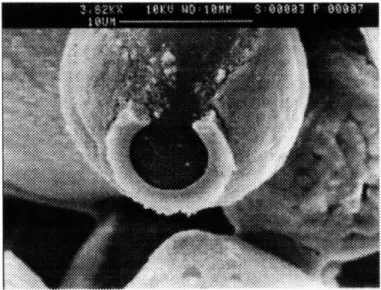
According to the hypothesis, the necks in fired bars should be filled with silica. This was not the case. While polymer did leave the necks, silica did not migrate into the resulting voids (Figure 2.8). The areas of the alumina particles that were in contact with Rhoplex are no longer wetted by silica. The silica has a contact angle greater than 900 on the alumina surface, an indicator of poor wetting. This is demonstrated by Figure 2.9, where an annulus of silica forms after firing at 7500
C. The inner area of the neck, where polymer had been, appears to be bare alumina.
Compared to the infiltrated parts, the neck in a sample printed with silica look solid after firing. The silica exhibits good wetting on alumina and did not form "rings". The fracture surface of necks has no large voids. Micrographs of this sample are shown in Figure 2.10 and Figure 2.11.
Figure 2.7: A Rhoplex neck enclosed in dried silica. Notice the cracking that is typical in a dried gel
Figure 2.8: A fracture surface of a neck in an infiltrated test bar after firing at 7500C. Notice the porosities in the center of the surface, indicating that silica had not filled in the space left by Rhoplex.
Figure 2.9: A "ring" of silica, after Rhoplex has decomposed by firing at 7500C
Figure 2.10: Necks in a sample printed with silica binder, fired at 7500C. The necks
are well formed and exhibit good wetting of silica on alumina.
Figure 2.12 and Figure 2.13 are micrographs of infiltrated bars that were fired at 9000C. The silica is still not wetting alumina, and the necks lack intimate bonding. The micrograph
Figure 2.11: Fracture surface of a neck in a sample printed with silica binder. The neck is solid with silica.
of samples printed with silica binder and fired to 9000C shows silica covering and wetting
the alumina spheres perfectly (Figure 2.14).
The adverse effects caused by Rhoplex persist even after firing at 1 1000C, as visible
in Figure 2.15. The silica still does not appear to be fused to the alumina spheres, and the contact angle is much greater than 900. In fact, the silica is separated from the alumina
par-ticles. This lack of cohesiveness at the microscopic level can lead to reduced strength in the bulk, which is supported by the following quantitative testing.
Figure 2.12: Neck in an infiltrated sample after firing at 9000C
Figure 2.14: Neck in a sample printed with silica binder and fired to 9000C
2.3 Strength Measurements
After microscopic examination revealed that polymers can affect the wetting char-acteristics of silica on alumina, data on the strength of these samples was collected. In ad-dition to quantifying the effect of the wetting phenomenon, these tests also measured the improvement in green strength.
Using a dispersion of smaller diameter silica particles to infiltrate may be benefi-cial, since it has been shown that less binder is needed to reach maximum strength with smaller particles [Rusher 1975]. Additional test bars were printed and infiltrated with Nya-col 830, another Nya-colloidal silica from NyaNya-col Products Inc. This aqueous dispersion has particles that are 8 nm in diameter. The smaller particle size will hopefully promote move-ment of silica into voids left by the decomposed polymer.
2.3.1
Measurement Procedure
In general, the brittleness of ceramics limit their strength in tension to low and un-predictable values. Their fracture properties are dictated by the largest surface flaws, which act as stress raisers. Therefore the strength of ceramics is usually characterized by bend testing [Richerson 1982]. A three or four-point bend test is used to measure the maximum tensile stress at failure. This value of this stress, also known as the cross-breaking strength or the modulus of rupture (MOR), defines the flexural strength of the sample. MOR from a three-point bend test is usually higher than that of a four-point bend test, since the prob-ability of a large surface flaw being directly under the load in a three-point bend test is much lower than the probability of a flaw being in the loaded area of a four-point bend test [Esterman 1990].
The more conservative four-point bend test was used due to the limited number of samples. Figure 2.16 illustrates the four-point bending apparatus. Test bars (1" by 0.125"
by 0.125") are placed on the lower support points, which are 0.750" apart. The upper plate,
.
Loading plate
b
,
hI
j4
Test sample
I = 0.250"j1
Support plate
Figure 2.16: Sketch of four-point bend test apparatus
sample.
While an Instron testing machine could be used to load the sample, a much simpler method was devised. Adding water to a beaker attached to the top plate increases the load until the test bar breaks. Given the nature of the material and the limited number of sam-ples, this technique provides equally valid results with a minimum of complication.
2.3.2 Strength Results
Analysis of the results from the four-point bend test is straightforward. A Mettler Electronic Balance measures the mass of the load that fractured the bar. The force applied (kg*m/sec2 or N) is calculated by multiplying the mass (gm) by the gravitational accelera-tion constant (9.81 m/sec2). Modelling the test bar as a beam under two point load with
simple supports, the maximum stress is described by: 3F1 Ymax =- (2.1)
max
bh2
L
I
ssr~~ss· ~ ~ ·t~s~I
.04
where
max
=
maximum stress
max
F = load at fracture
1 = distrance between load point to nearest support point
h = thickness of sample
b = width of sample
(2.2)
(2.3)
(2.4)(2.5)
(2.6)Statistical analysis of the data, given the limited sample size and the degree of scat-ter, is meaningful. For samples with more than one data point, a simple averaging was per-formed. Although these results are not as reliable as those quoted in other studies of ceramics, they are sufficient to point out important trends in the infiltration technique. Table 2.2 lists the average MOR (MPa) for all of the samples. Where applicable, the MOR is given as
mean(x) ± SDOM(x), N (2.7) where SDOM is the standard deviation of the mean defined as , and N is the number of samples.
Table 2.2: MOR of infiltration samples made with 30 gm spherical powder
Firing Infiltrated Infiltrated Printed with
Temps w/9950 w/830 Standard silica
13 vol.% 8 vol.% binder
silica in fired silica in fired 11 vol.% silica
bar bar in fired bar
crosslinked
----
5.4 MPa, N=1 5.4 MPa, N=1 N/A~~~~~-
·---
----
---
-_-·I···-··
7500C 0.2 MPa, N=1 0.7 MPa, N=1 2.5±0.2 MPa,
N=2
9000C 0.6±0.0 MPa, 1.2 MPa, N=l
3.3±0.2 MPa
N=2
N=2
11000C 1.2±0.2 MPa, N/A 6.8±0.0 MPa
From handling the test bars during the microscopic examination, it was obvious that samples printed with Rhoplex had much higher green strength than bars printed with silica. This observation is supported by measurements, which shows that bars printed with Rhop-lex has an MOR of 5.4 MPa. The strength of bars printed with silica could not be measured in the green state, since they virtually disintegrate when touched.
The fired strength has two clear trends. First, strength increases with firing temper-ature, regardless of how the bar was made (i.e. infiltration or directly printing with silica). Secondly, comparison of infiltrated and silica-printed samples fired at the same tempera-ture reveals that the infiltrated samples are always weaker. For example, bars fired at 9000C suffer a sixfold reduction in strength because of infiltration.
Finally, the strength of test bars infiltrated with Nyacol 830 (smaller particle size), although higher that of bars infiltrated with Nyacol 9950, was still lower than the strength of bars printed with silica.
2.4 Conclusions on Infiltration
SEM examinations showed that even after firing, the interparticle necks of bars made by infiltration were different from the necks of bars printed with silica. Silica in the infiltrated samples neither wets the surface of alumina particles nor fills the voids left by decomposed polymer. This produces "blobs" and "rings" of silica that are not fused to the alumina particles. This lack of bonding at the microscopic level degrades the bulk strength properties of ceramic parts.
Composed of only hydrocarbon polymers, Rhoplex@ HA-16 should fully decom-pose into gaseous oxides of carbon (COx) and water vapor (H20) when heated in an oxi-dizing environment. With the presence of silica (Si02) and alumina (A1203), however, the decomposition reaction may produce by-products such as silicon carbide (SiC), aluminum carbide (A14C3), and pure carbon. Since these residual compounds are refractory, they will remain in the necks after burnout. Their presence may contribute to the lack of
cohesive-ness in the necks by preventing silica from wetting the surface of alumina particles. A pos-sible solution is to reduce the ratio of Rhoplex to silica to minimize residue.
Looking at the micrographs of the bars made by infiltration, it is clear that silica is not filling the voids in the necks. In addition to poor wetting, another factor may be the physical distance that silica must travel. The average diameter of a Rhoplex neck is 5 ptm. Assuming that the polymer disappears completely during burnout, the silica must migrate across 2.5 gpm to fill the void. Reducing the amount of Rhoplex may also alleviate this phe-nomenon by shrinking the necks.
Migration of silica was be enhanced by infiltrating with Nyacol 830. The 8 nm sil-ica particles of this dispersion are more mobile than the 100 nm particles of Nyacol 9950. Although this is reflected in the measured strength of the 830 bars, the bars directly printed with silica were still much stronger.
Although printing ceramic part with Rhoplex@ HA-16 acrylic emulsion produces a significant increase in green strength, the resulting reduction in fired strength is unaccept-able. This marks the end of the infiltration study, and we turn our attention to printing co-dispersions.
Chapter 3
Co-Dispersions
Two binders currently used in Three Dimensional Printing are aqueous dispersions of colloidal silica (Si20) and acrylic polymer emulsions. Colloidal silica, used in the print-ing of ceramic castprint-ing shells, is incorporated into the end product and is therefore chosen for its refractory properties. Parts printed with this binder do not strengthen until they are fired at high temperatures (>7500C). On the other hand, metal parts are printed with
emul-sions because they require high green strength and must survive being handled in the green state. Combining the properties of both binders may produce casting shells that have high green strength.
In the last chapter, we found that the green strength of ceramic parts is dramatically improved by printing them with an acrylic emulsion and subsequently infiltrating with sil-ica. The downside of this technique is that the fired strength declines to an unacceptable level. This is due to the combined effect of:
1. separation of polymer and silica into discrete regions in the interparticle necks
2. poor wetting of silica on alumina caused by residue from decomposition
3. long migration paths for silica to fill the voids left by decomposition
4. lack of control over the proportion of polymer to silica
An alternative strategy, which addresses these issues, is to print a binder containing a co-dispersion of colloidal silica and polymeric sols.
3.1 Process Concept and Technique
Co-dispersions create new binders for printing ceramic shells by combining colloi-dal silica with polymeric emulsion. A co-dispersed binder addresses many of the issues raised by the infiltration technique. Since the polymer and the silica are pre-mixed and si-multaneously delivered to the powder bed, the interparticle necks will contain a more ho-mogeneous mixture. This reduces the size of the voids that are left when the polymer decomposes, which also shortens the distance that the silica must migrate in order to fill these voids. Pre-mixing the two materials also permits exact control over the ratio of poly-mer to silica. The amount of polypoly-mer in the necks can be reduced to minimize the produc-tion of residue and the impact on the wetting characteristics of silica.
The printing process is straightforward. First, a co-dispersed binder is formulated. A ceramic part is printed using the co-dispersion and alumina (A1203) powder. The part is removed from the powder bed in the green state. After crosslinking the polymer by heat-ing to 1600C, the unprinted powder can be removed. The polymer thermally decomposes in the course of the subsequent high temperature firing (>7500C), which also fuses the silica
to the alumina powder. A flowchart of the process is shown in Figure 3.1. In essence, the co-dispersion procedure differs from the infiltration technique only in the manner that the two binder components are delivered.
3.2 Overview of the Printhead
At this point, we need to describe the technology used in 3D Printing to deliver the binder. Borrowed from commercial ink-jet printing applications, the printhead operates by the continuous-drop method (the other is drop-on-demand, and is currently being tested for 3D Printing). In this system, the pressurized ink (or binder) continuously jets out of a small diameter nozzle or orifice. The jet is broken up into evenly sized and regularly spaced droplets by mechanical stimulation via a piezoelectric element. The train of droplets passes through a charging cell, which imparts a charge to each droplet. A set of high voltage plates
Figure 3.1: Flowchart of printing ceramic casting shells with co-dispersions
electrostatically deflects the droplets into a catching mechanism. By toggling the charging signal, the droplets can be made to either deflect into the catcher or pass through to the
tar-get surface.
The operation of the printhead dictates some basic requirements on the binder:
1. The binder must have an average particle size that is much smaller than the noz-zle or orifice diameter.
2. The binder must be stable, even under the higher shear rates of passing through an orifice, so that no agglomerates large enough to clog the orifice will be formed.
3. The viscosity of the binder must be sufficiently low such that it will flow through the orifice under reasonable pressure.
4. The binder must have a minimum conductivity, so the droplets can be electri-cally charged.
The printhead currently used by 3D Printing is an out-of-production tuned resonator made by the Diconix Corporation (ex-division of Kodak, now Scitex) for ink-jet applica-tions. The orifice has a 50 p.m diameter electroformed opening, and the resonance frequen-cy of the chamber is normally 78±1 kHz.
3.3 Preliminary Investigation
The stability of aqueous dispersions such as Nyacol 9950 can be achieved by two different techniques. The Nyacol product contains colloidal silica dispersed in an alkaline medium. Silanol groups on the silica particles produces a negative surface. Since the par-ticles are all negatively charged, they tend to repel each another. This is called electrostatic stabilization [Hunter 1991]. The other technique is known as steric or polymeric stabiliza-tion. In this scheme, polymers groups are added to the dispersion. They adsorb onto the surface of the dispersed particles and form a layer of polymer "cushion". These cushioning layers prevent the particles from coming close enough to stick together.
Both steric and electrostatic stabilization can fail if certain conditions, such as a crit-ical pH in electrostatic stabilization, are not satisfied. A breakdown in stability causes an electrostatically stabilized dispersion to coagulate or gel, and a sterically stabilized disper-sion to flocculate. In both cases, the colloidal particles form large clusters. Since the print-head orifice is only 50 p.m, in diameter, large flocculent can become lodged in the opening, resulting in a deflected or blocked binder stream. In addition, the viscosity of unstable binder can increase, reducing the flowrate at a given pressure.
To study the feasibility of a co-dispersed binder, a simple compatibility test was performed. At the time of the study, binders made with Nyacol 9950 and Rhoplex@ HA- 16 were regularly used to print alumina casting shells and metal tooling. These formulations, described in Section 2.2.1, were believed to have good stability. As the first attempt to cre-ate a co-dispersion, samples of these two "Standard" binders were simply poured together in a one-to-one volumetric ratio.
This approach, considering its simplicity, was remarkably successful. The mixture showed no immediate signs of flocculation or separation, and remained stable after three weeks. At this point, a large batch of this 1:1 co-dispersion was made for flowrate and jet stability tests.
3.3.1
The Nozzle Test Stand
The nozzle test stand consists of two 50X Direct Measuring microscopes (Edmond Scientific Co., Barrington, NJ) mounted so that their line of sight intersects at 900. A
Di-conix resonator is clamped onto the frame of the microscope assembly. The binder stream is aligned to be in the frame of view of both microscopes. A flashlight bulb illuminates the jet, and its position is measured using the scales in the scopes. By aligning the scopes at right angles, any axial shifting or "walk" of the jet can be recorded. A schematic of the test stand is shown in Figure 3.2.
binder stream
_ / / \II.\11/
rlightUJ•II % %I as.L ngu "! II%,CiroLcpes
Figure 3.2: Schematic of the nozzle test stand
Binder is supplied to the resonator from a two liter reservoir, which is pressurized !
"
with a helium tank. Using inert helium reduces the possibility of adverse reactions with the binder. The fluid passes through two Calyx capsule filters with polypropylene elements (Micro Separations Inc., Westborough, MA) plumbed in series. The first filter has statisti-cally 5 .tm openings, and the second filters down to 1.2 plm. As a final precaution, a sin-tered stainless steel pellet that filters down to 5 pm (Mott Metallurgical Corp., Farmington, CT) is placed immediately upstream of the entrance to the resonator. A water supply is sim-ilarly plumbed, with the exception of having only one 5 plm Calyx filter.
The flowrate of the binder jet is calculated by measuring the amount of time re-quired to collect a certain volume of binder in a graduated cylinder, and dividing that vol-ume by the elapsed time.
The purpose of the nozzle testing stand is to observe flowrate and axial shifts in the position of the jet over a period of time. An acceptable binder should have constant flow-rate and minimal stream walk.
3.3.2
Jet Stability Results
Results of the first run with the 1:1 co-dispersion are shown in Figure 3.3 and Figure 3.4. The pressure for both runs was kept at 25 psi. Although the flowrate dropped
by 0.38 mL/sec, or 36%, in 682 minutes, the position only varied by 0.001" to 0.002" in
either direction. This indicates that the reduction in flowrate is not the result of a clogged orifice, but rather a problem with the binder delivery system. The sintered final filter, with much less filtration capacity then the large capsule filters, was probably becoming loaded with captured particles. In another test without the sintered filter, the flowrate and jet po-sition are quite steady (Figure 3.3 and Figure 3.5). "S" and "T" are axes perpendicular to the line of view of the two microscopes.
This was a puzzling observation. After passing through the 1.2 pm polypropylene filter, why would the binder clog a 5 pm stainless filter? It is possible that the particles in
0
0
0 200
Figure 3.3: Flowrate versus constant at 25 psi.
400 600
Time (min.)
time, 1:1 co-dispersion. Pressure was held
0.060 0.055 -- - - ---0.050' - -- --- --- S-axis position 0.045 . . . -. .p T-axis position 0.040 200 400 600 800 Time (minutes)
Figure 3.4: Stream position versus time, 1:1 co-dispersion, with final filter. Pressure was constant at 25psi. The S and T axes are perpendicular to the line-of-sight of the two microscopes.
100 200 300 4 Time (minutes)
00 500 600
Figure 3.5: Stream position versus time, 1:1 co-dispersion, no final filter. Pressure was constant at 25psi. The S and T axes are perpendicular to the line-of-sight of the two microscopes.
the binder reacts differently to the two filter materials.
3.3.3 Printing Test Bars
After the initial success in achieving a stable jet, the next logical step was printing test bars with the 1:1 co-dispersion. Printing involves additional issues that are not exam-ined on the test stand, such as stimulation of the stream to form discrete droplets, charging of droplets, and electrostatic deflection of the charged droplets. Nonetheless, the 1:1 co-dispersion was loaded into the proto 3D Printing machine.
To allow comparison of data, the same test bars from the infiltration study were made using the standard printing parameters. The powder was 30 gm spherical alumina, with 0.3 wt.% citric acid mixed in. Citric acid lowers the alkalinity of the binder below pH 9, causing rapid aggregation of the silica and thus defining a finite line width [Iler 1979]. The optimal percentage of citric acid is still being studied, but at the time 0.3 wt.%
V.UD4 0.052' n,,j ( 0.048 V.U0O 0 S-axis position --- T-axis position 0....i.... (.V
I
_ __· __ I•• 1 ... i... .. ;... ......---. ...---...---...---...---...---...---...---...---...---...---...---...---...---...---.
....
' f "...
...
U.U4• '""..
...
...i.
i ...
i...
...
i ... i ... ...
)...
--- ··- ~---·i--·---)·---·--j..~.~.. .:~...~;....~ .. ... ... .... i I Iwas the accepted amount for printing with the Standard silica binder.
The test bars were removed from the powder bed and crosslinked at 1600C. After
removing unbound powder, samples were fired at 7500C, 900"C and 11000C. Four point
bend tests were performed on crosslinked and fired bars, and the fracture surfaces were ex-amined in a scanning electron microscope.
3.3.4 Results
On the whole, the printing was successful. Figure 3.6 and Figure 3.7 are micro-graphs of interparticle necks in co-dispersion bars fired at 7500C. In contrast to the samples made by infiltration, silica in these necks exhibits good wetting on alumina. The necks are narrow and solid, and appear to be intimately bonded to the alumina particles. There are no "blobs" of silica, as seen in the infiltrated samples. Examination of co-dispersion parts fired to 9000C and 11000C resulted in the same conclusion.
Figure 3.6: Necks of test bar printed with co-dispersion, fired at 7500C
A possible concern is the small surface pores that are visible in the close-up view
Figure 3.7: Close-up of a neck in a co-dispersion bar fired at 7500C. The neck exhibits a porous surface.
may weaken the integrity of the neck and reduce the fired strength of parts.
The modulus of rupture was surprisingly good. From the graph presented in Figure 3.8, it is obvious that co-dispersion out-performed infiltration in terms of fired strength for all temperatures. The green strength of co-dispersion bars was comparable to that of infiltrated bars. The fired strength increases with the firing temperature, a trend also observed during the infiltration study. This phenomenon will be discussed in more detail in Section 4.1.
In spite of the success in printing, the performance of the co-dispersion was not sat-isfactory. The MOR data indicates that the fired strength of co-dispersion bars is lower than that of bars printed with regular silica binder. Although there are no visible effects of res-idue from decomposed Rhoplex, fired strength may still suffer from unseen degradation. In addition, the reduced strength may be an artifact of reduced silica content in the co-dis-persion bars. Standard silica binder contains 18 vol.% silica. Co-disco-dis-persion, made by com-bining the Standard silica and Rhoplex binders in a 1:1 volumetric ratio, has only 9 vol.% silica.
Cts
a.
6 6-C. 4-O 2-0 0-0 200 400 600 800 1000 1200Crosslinking/Firing
temperature
(oC)
Figure 3.8: MOR data for infiltration with Nyacol 9950, 1:1 co-dispersion, and
Standard 18 vol.% silica binder. When given, the error bars represent the standard deviation of the mean for the data set. The data points without error bars came from only one sample.
To test the last hypothesis, bars were printed using Standard silica binder that was diluted to 9 vol.% solids. As shown in Figure 3.9, the fired strength of these bars, although lower than bars printed with 18% silica, was still greater than co-dispersion parts. There-fore the effects of Rhoplex residue and the reduced silica content both contribute to lower fired strength in the co-dispersion bars.
To establish the effect of using spherical alumina instead of the platelet-shaped powder normally used to print shells, test bars were printed in Norton 7920 powder using 9 vol.% silica binder. Spherical powder was suspected to lower the fired strength, since individual particles only make point contact with the neighboring particles, where as the irregularly shaped platelets can form necks that cover a larger area. These samples were fired at the same three temperatures, and measured by the four-point bend test. The results, shown in Figure 3.9, indicate that platelet-shaped powder has a positive impact on strength
A 0 0 E)Y -0 Infiltration o Co-dispersion A Silica binder
14 12 - 10-e - S8-L 6-O U) 5 4-0 2- 0-700 900 1100
Firing temperature
(oC)
Figure 3.9: MOR for 1) 1:1 co-dispersion in spherical powder, 2) binder with 9 vol.% silica in spherical powder, 3) binder with 18 vol.% silica in spherical powder, and 4) binder with 9 vol.% silica in 7920 platelet-shaped powder. When given, the error bars represent the standard deviation of the mean for the data set. The data points without error bars came from only one sample.
only after firing at 11000C.
Up to this point, we have only worked with the 1:1 co-dispersion. The next step of the investigation is to utilize another advantage of co-dispersions: the ability to control the ratio of silica to polymer in the parts.
o Co-dispersion
* 9 vol.% silica
a 18 vol.% silica binder
. 9 vol.% silica w/platelet powder
T
E
1
3.4 Reformulation
Although the preliminary investigation of co-dispersions was successful, the fired strength still needs improvement. The results so far indicate that adjusting the relative amounts of silica and polymer in the binder should alleviate the reduction in strength. Therefore, new co-dispersions containing various ratios of Rhoplex® HA-16 and Nyacol 9950 were formulated.
Two new requirements were set for the co-dispersion. First, the binder must contain 18 vol.% silica, regardless of the amount of Rhoplex. This is to maintain silica content in the fired parts at the same level as parts printed with the Standard silica binder. Simplicity, the second rule, reduced the composition of the co-dispersion down to silica, Rhoplex, wa-ter, and an additive to stabilize the mixture.
As received from the manufacturer, Rhoplex@ HA-16 is acidic and has a pH of 4. Since this is below the range where colloidal silica is stable, Rhoplex must be made basic before the two can be mixed. It was discovered that by adding enough ammonium hydrox-ide (NH40H) to stock Rhoplex to increase its alkalinity to pH 10, a stable co-dispersion can be created.
Calculation of the relative proportions of Rhoplex, silica, and distilled water to pro-duce a given Rhoplex/silica ratio is straight-forward. For example, to make a co-dispersion containing 10 vol.% Rhoplex and 17.5 vol.% silica, start with the following expression:
1.OL = 0.1 L Rhoplex solids + 0.175 L silica solids + 0.75 L water (3.1) This is the desired final composition of the binder. Analysis of stock 9950 and HA-16 re-veal that
stock 9950 silica= 30 vol.% silica solids + 70 vol.% water (3.2) stock HA-16= 43 vol.% Rhoplex soilds +57 vol.% water (3.3) Using these volume percentages, the volume of stock solutions required to obtain the de-sired solid contents can be calculated. For example, 0.223 liters of Rhoplex containing
43 vol.% solids is needed for 0.1 liter of Rhoplex solids, i.e.
0.223
Lx
0.43
=
0.1L
(3.4)
Similar calculations for silica reveals that 0.583 liters of stock silica is needed to produce 0.175 L of silica solids. Combining the above expressions and adding water to make 1.0 L of final product gives:
1.0 L = 0.233 L(0.43 Rhoplex+0.57 water) (3.5)
+ 0.583L (0.3 silica+0.7 water)+0. 184 water
This gives the relative proportions of the ingredients by volume: 1 part water, 1.27 parts stock Rhoplex (pH modified w/ammonia), and 3.17 parts stock 9950 colloidal silica. This produces a co-dispersion containing 10 vol.% Rhoplex and 17.5 vol.% silica.
To mix these ingredients, first add the water to beaker and start stirring with a mag-netic stirrer. Gradually pour in the silica and allow to mix for 5 minutes. Slowly add the pH modified Rhoplex and stir for at least one-half hour.
Three different co-dispersions were made for testing. The silica content was main-tained at 17.5 vol.%, while the amounts of Rhoplex were 2 vol.%, 5 vol.%, and 10 vol.%. To recap, this new formulation of co-dispersion contains:
1. Stock Rhoplex® HA-16 emulsion
2. Ammonium hydroxide to increase the pH of Rhoplex to 10 3. Nyacol 9950 colloidal silica dispersion
4. Distilled water
3.4.1
MOR Results
The 1.0" by 0.125" by 0.125" test bars were chosen for expedience of printing. The samples were made on the proto machine using the standard printing conditions. The goal was to observe the effects that varying the amount of Rhoplex has on the green and fired strength of ceramic parts.
to use the Norton 7920 Electronic Grade powder that is normally used in printing shells. The platelet-like particles in this powder have an average diameter of 30 microns. 0.2 wt.%
citric acid was added as a gelling agent.
After crosslinked at 1600C, samples were fired at 7500C, 9000C, and 11000C. Test bars were also printed with the Standard silica binder (18 vol.% silica) to provide a control for the experiment. Flexural strength for green and fired samples were measured by the four point bend test. The results of these tests are shown in Table 3.1. As before, the results are presented as "mean(x)±SDOM(X)", where the mean values are taken of three samples.
Table 3.1: MOR of HA- 16 co-dispersions with varying polymer content
Firing 2 vol.% i5 vol.% 10 vol.% Standard
sili-Temp ca binder
18 vol.%
"green" 1.00. 1 MPa 2.5±0.1 MPa 3.8±0.1 MPa 0.39±0.04 MPa 7500C 2.8±0.5 MPa 2.6±0.6 MPa 2.3±0.4 MPa 3.5±0.1 MPa 9000C 3.5±0.1 MPa 4.2±0.3 MPa 3.6±0.3 MPa 4.0±0.3 MPa
11000C 23±2 MPa 30±3 MPa 29±5 MPa 32±5 MPa
With 10 vol.% Rhoplex, the green strength was 3.8 MPa; a 900% increase from 0.4 MPa for the green silica parts. By plotting green strength against volume percentage of Rhoplex, we see that the green MOR increases monotonically with increasing polymer con-tent (Figure 3.10). This suggests that adding more Rhoplex to the co-dispersion will further improve the green strength. But fired strength may decrease with increasing polymer con-tent, as suggested by Figure 3.11. In addition, we discovered that the viscosity of the co-dispersion increases rapidly with polymer content. Therefore the amount of Rhoplex in the co-dispersion was capped at 10 percent by volume.
00. Co
CL
2-cl ci 0 0n 0 2 4 6 8 10 12Amount of polymer (volume
%)
Figure 3.10: Green MOR versus percent polymer for HA-16
10 000 IL-
==$
CL 00 O Mg 01 0 Ii....
.·-·.···-....-... ...*... 6% of
I...
2 4Volume
8 10polymer
Figure 3.11: MOR versus percent HA-16 polymer, fired at 9000C
48
---
---
... ... i...i --- ·...;... ... " i ... ... I ·...
---- ... ..--...---...,... M-I 1 I IThe key result of this experiment is that a co-dispersion containing 10 vol.% Rhop-lex produces parts that:
1. have higher green strength than parts printed with silica (3.8±0.1 MPa versus 0.4±0.1 MPa)
2. have strength comparable to parts printed with silica after firing at 9000C
(3.6±0.3 MPa versus 4.0±0.3 MPa).
3.5
Commercial Green Strength Additives
In light of the success with co-dispersion made with Rhoplex® HA-16 we decided to explore some commercial green strength enhancers from the investment casting indus-try. A survey showed that there are two categories of products. The first type of additives are emulsions of various polymers, similar to the HA-16. The other product is a colloidal silica that contains a polymer in solution. The following table lists the samples that were obtained. A special case is the Customcoat binder from Ransome & Randolph, which is an emulsion already co-dispersed with colloidal silica.
Table 3.2: Commercial Green Strength Products
Name Manufacturer Polymer Contains
silica?
Tylac 68138 Reichhold styrene-butadiene No Chemicals, Inc. copolymer
disper-sion
Adbond BV Remet Corp. proprietary dis- No persion
Rhoplex AC-604 Rhom & Hass Co. acrylic emulsion No Customcoat Ransom & proprietary dis- Yes
Randolph persion
3.5.1
Compatibility Issues
With the exception of Ludox SK 215 and Customcoat, the green strength enhancer are intended to be added to a slurry of colloidal silica and alumina powder for investment casting purposes. Two criteria were used to select candidates for further testing. The ad-dition of these products to Nyacol 9950 must not cause instability in the resulting mixture. These additives must also be compatible with the more complex problem of passing through a 50 pm orifice.
A simple test was conducted by mixing these additives with the 9950 dispersion in various ratios. The pH of the additives were first increased to 10 by adding ammonia. Mix-ing was done in a test tube by dropwise addition of the polymer to silica. The test tubes were capped and inverted several times to insure thorough mixing.
Incompatible samples were readily observed due to immediate flocculation or co-agulation. Flocculation of the binder leads to separation and settling of the dispersed par-ticles from the aqueous medium. Coagulation is indicated by a large increase in viscosity
of the fluid to a level comparable to that of heavy-cream or cottage cheese.
To our disappointment, all but one of the additives failed these compatibility crite-ria. The only successful candidate was Rhoplex@ AC-604, another emulsion from Rohm and Hass. Co-dispersion containing 18 vol.% silica and 2 vol.%, 5 vol.%, and 10 vol.% AC-604 particles were formulated for additional experiments
3.5.2 Ludox SK
Since Ludox SK already contains 7 vol.% colloidal silica, it bypasses the first com-patibility criterion. Initial attempts to print this binder failed because the binder stream could not be properly deflected. This lead to a more detailed look into the nature of the stream.
Using a technique developed by members of the group, the droplets were captured by stop-motion video. The binder stream is backlit by a strobing light-emitting diode