HAL Id: hal-00305658
https://hal.archives-ouvertes.fr/hal-00305658
Submitted on 3 May 2007HAL is a multi-disciplinary open access archive for the deposit and dissemination of sci-entific research documents, whether they are pub-lished or not. The documents may come from teaching and research institutions in France or abroad, or from public or private research centers.
L’archive ouverte pluridisciplinaire HAL, est destinée au dépôt et à la diffusion de documents scientifiques de niveau recherche, publiés ou non, émanant des établissements d’enseignement et de recherche français ou étrangers, des laboratoires publics ou privés.
basins
Hong Xu, J. Corte-Real, Budong Qian
To cite this version:
Hong Xu, J. Corte-Real, Budong Qian. Developing daily precipitation scenarios for climate change im-pact studies in the Guadiana and the Tejo basins. Hydrology and Earth System Sciences Discussions, European Geosciences Union, 2007, 11 (3), pp.1161-1173. �hal-00305658�
© Author(s) 2007. This work is licensed under a Creative Commons License.
Developing daily precipitation scenarios for climate change
impact studies in the Guadiana and the Tejo basins
Hong Xu
1, João Corte-Real
2and Budong Qian
11Eastern Cereal and Oilseed Research Centre, Agriculture and Agri-Food Canada, Ottawa, ON, Canada 2University of Évora, 7000-671 Évora, Portugal
Email for corresponding author: qianb@agr.gc.ca
Abstract
Hydrological models to evaluate the impacts of climate change in the water resources sector require spatially correlated daily precipitation scenarios as model inputs. This paper presents a practical procedure for developing such precipitation scenarios using multisite stochastic weather models or generators conditional on large-scale daily circulation patterns, based on GCM-simulated future mean sea level pressure (MSLP) fields. The procedure is demonstrated on the basis of HadCM3 and HadAM3H simulations with an example for two river basins in the Iberian Peninsula. Changes in daily precipitation scenarios for the region generated by stochastic models are consistent with large-scale precipitation scenarios from direct GCM outputs; however, more localised characteristics have to be found from downscaled precipitation scenarios rather than from direct GCM outputs. This may imply that possible changes in downscaled precipitation reflect the underlying physics in GCMs, so that downscaled daily precipitation scenarios may be more suitable for impact models than the coarse GCM outputs.
Keywords: climate scenarios, impact study, downscaling; precipitation, water resources, multisite stochastic weather generator, Iberian
Peninsula
Introduction
Water resources are vital for sustainable development, especially in arid and semi-arid areas. Rivers in the southern part of the Iberian Peninsula, such as the Guadiana and the Tejo (Tagus) , flow from Spain to southern Portugal through a semi-arid area lacking in precipitation, especially in summer. Precipitation in the catchment of the Tejo, one of the largest rivers in Europe, passing Lisbon before reaching the Atlantic, would be affected by any northward shift of the north Atlantic storm track in a changing or changed climate. Furthermore, management of the water resources of these trans-boundary international water bodies in support of sustainable socio-economical development in both countries may well be critical in a future climate drier than the present. The European research project SWURVE (Sustainable Water: Uncertainty, Risk and Vulnerability in Europe) designed case studies for each of these river basins focusing, in the case of the Guadiana, on management aspects for trans-boundary rivers under a climate change
scenario and, in the case of the Tejo, on municipal water supply for Lisbon. Future daily precipitation scenarios covering river basins are necessary inputs to hydrological models, in evaluating the impacts of climate change on these water resources.
As precipitation simulated by general circulation models (GCMs) is available only at a very coarse resolution (typically on 3.75° longitude × 2.5° latitude grids), daily precipitation scenarios from climate change simulations conducted by GCMs are inappropriate for direct use as inputs to impact models because of the mismatch in spatial resolutions. Statistical downscaling models, as well as dynamical methodologies, have been developed to bridge the gap between GCMs and the impact models. Most statistical models use regression techniques to derive precipitation from large-scale atmospheric circulation (Wigley et al., 1990; von Storch et al., 1993; Corte-Real et al., 1995; Conway et al., 1996; Wilby, 1998). However, regression models are more appropriate for monthly rather than daily precipitation because the high variability of daily precipitation might result in regression models explaining
only a limited part of the variance.
Stochastic models, often known as weather generators, may be more adequate than linear regression models for daily precipitation because the high variability of daily precipitation can be simulated well by stochastic weather generators. Conventional weather generators (Richardson, 1981; Semenov et al., 1998; Hayhoe, 2000) can be used to obtain future climate scenarios only through perturbing weather generator parameters based on GCM-simulated changes in the statistics of some climate variables (Wilks, 1992; Katz, 1996; Mearns et al., 1997; Semenov and Barrow, 1997). However, the reliability of the future climate scenarios thus generated depends very much on the reliability of GCM-simulated changes in surface climate variables, such as precipitation on coarse grids. Large-scale atmospheric circulation is generally believed to be more reliable than precipitation in GCM simulations (Corte-Real et al., 1999a); thus, the use of conditional weather generators (Schubert, 1994; Goodess and Palutikof, 1998; Corte-Real et al., 1999b) may be more straightforward for developing future daily precipitation scenarios on the basis of GCM simulations of future large-scale atmospheric circulation.
In developing daily climate scenarios for river basins, the spatial correlations of the weather variables must be preserved because, in simulating floods and recharges, these spatial relationships can be essential for hydrological models. Most weather generators are developed for generating weather variables at a single site, although for a region such as a river catchment, scenarios may be generated, site by site; however, in generating synthetic precipitation data in this way, spatial correlations cannot be retained (Qian et al., 2002). The development by Wilks (1998, 1999) of a multi-site version of the Richardson-type weather generator to preserve spatial correlations of the weather variables in a region was extended by Qian et al. (2002) to a conditional version; applying the conditional models to the Portuguese side of the Guadiana River basin, proved the efficiency of the conditional multisite stochastic models by preserving spatial correlations in addition to other important statistical properties of the observed weather series.
This paper demonstrates the development of future daily precipitation scenarios based on future large-scale atmospheric circulation through applying the conditional multisite stochastic models (Qian et al., 2002) to a region covering both the Guadiana and the Tejo River basins. In developing precipitation scenarios, all the steps necessary were introduced, from linking precipitation and large-scale atmospheric circulation to analysing generated precipitation. Large-scale atmospheric circulations simulated by the Hadley Centres third generation climate models (HadCM3
and HadAM3H) (Pope et al., 2000; Johns et al., 2003) forced by different greenhouse gases emission scenarios, were used to develop multiple climate scenarios to present uncertainties resulting from models and emission scenarios.
Data and strategy
For the period 19611990, daily precipitation series at 42 stations over the two river basins were provided by the national meteorological services of Portugal and Spain. Four daily circulation patterns were identified from large-scale atmospheric circulation in the mean sea level pressure (MSLP) fields over the north-eastern Atlantic and western Europe by K-means clustering algorithm plus principal component analysis (Corte-Real et al., 1998). The four daily circulation patterns were classified initially to distinguish precipitation status at Évora, one of the stations in the Guadiana River basin. The four circulation patterns are also effective in linking local precipitation at other stations in Portugal to large-scale atmospheric circulation (Corte-Real et al., 1998).
Daily GCM outputs for the MSLP fields and precipitation were obtained from the Climatic Research Unit of the University of East Anglia, UK, through the Climate Impacts LINK project (http://www.cru.uea.ac.uk/link/). For the period 19611990, daily MSLP fields and precipitation for the present climate in the GCMs were obtained from control runs of HadCM3 and HadAM3H for 19611990. Daily MSLP fields and precipitation for the future climate of 2070 2099 were extracted from climate change experiments by HadCM3 and HadAM3H forced separately by greenhouse gases emission scenarios SRES A2 and B2 (Nakicenovic and Swart, 2000). HadCM3 is the third generation coupled atmosphericocean GCM with a spatial resolution of 2.5º latitude × 3.75° longitude grids. HadAM3H is the atmospheric GCM driven by HadCM3 with a higher grid resolution of 1.25º latitude × 1.875° longitude. HadAM3H provides the atmospheric response to the global sea-surface temperature (SST) and sea-ice changes simulated by HadCM3; the regional climate is simulated more accurately because of the doubling of the resolution compared to HadCM3 and of a more accurate simulation of the strength and position of the north Atlantic storm track coupled with a more realistic representation of clouds and atmospheric humidity with consequent impacts on radiation and precipitation.
Because the spatial resolutions in HadCM3 and HadAM3H simulations differ from the grids for observed MSLP fields, daily MSLP fields from HadCM3 and HadAM3H were interpolated to 5° × 5° grids, on the same grids of the observed MSLP fields. Daily MSLP fields over
the north-eastern Atlantic and western Europe from GCMs were then projected to the first 20 Empirical Orthogonal Functions (EOF) of the observed MSLP fields to obtain the principal components (PCs). Finally, the 20 PCs were used as variables to determine the shortest distance to the four observed daily circulation patterns. (Corte-Real et al., 1999a). The sequences of daily circulation patterns were then applied to operate the multi-site daily precipitation weather generator for generating daily precipitation scenarios.
Using GCM-simulated daily circulation patterns to generate daily precipitation requires that the GCM simulation should be capable of reproducing observed daily circulation patterns (Corte-Real et al., 1999a) as was done for the HadCM2 model (Johns et al., 1997). Since HadCM3 is the new generation climate model improved from HadCM2 and HadAM3H is the atmospheric model driven by HadCM3 with a higher spatial resolution, it was assumed, without further validation in this study, that the capability of HadCM3 and HadAM3H is superior to HadCM2.
To use the four daily circulation patterns in generating daily precipitation scenarios for the two river basins, the ability of the circulation patterns to distinguish daily precipitation status (i.e. a wet day or dry day and precipitation amount if it is wet) in the two river basins was verified. Then, for the precipitation models, the multi-site stochastic weather models (Qian et al., 2002) were extended to cover the two river basins. The calibrated stochastic models were validated by comparing the statistics of the synthetic precipitation data with those of the observations. Daily precipitation scenarios for the present climate (1961 1990), generated with HadCM3 and HadAM3H simulated daily circulation patterns, verified the ability of the stochastic models to reproduce the present climate of the observed precipitation in the region. Finally, to have a better understanding of the changes, differences between future precipitation scenarios for 20702099 and those for the present-day climate were compared with corresponding changes estimated from the direct output of the GCM for daily precipitation.
Linking daily precipitation to daily
circulation patterns and their future
changes
Four daily circulation patterns, the blocking-like pattern (CP1), the summer dry pattern (CP2), the winter dry pattern (CP3) and the rainy pattern (CP4), were identified from daily MSLP fields in the Euro-Atlantic sector (Corte-Real et al., 1998, 1999a,b; Qian et al., 2002), initially to link the daily
precipitation distribution in southern Portugal to the large-scale atmospheric circulation; to test the validity of extending these patterns to a larger region, the Spanish sides of the Guadiana and the Tejo basins were included in the analysis, later.
Figure 1 shows the spatial distribution of the probability of precipitation occurrence and mean daily precipitation on a wet day, in winter (DecemberJanuaryFebruary) from observations for 19611990. In principle, probabilities both of rain and mean amounts of precipitation on wet days decrease from the western coastal area to the eastern inland region, except for local factors such as topographic features. Figure 1 also demonstrates lower probabilities of rain and less intense precipitation amounts on wet days under the winter dry pattern (CP3); the probability of a wet day is only about half of the wintertime-mean values. In contrast, higher probabilities of rain and more intense precipitation amounts occur under the rainy pattern (CP4), approximately doubling the wintertime-mean values of the probability of a wet day at most stations. This analysis indicated that daily precipitation distributions over the whole of the two river basins were distinguishable under the four daily circulation patterns. Hence, the patterns identified for southern Portugal could be applied to the multi-site conditional precipitation weather generators as the link between local precipitation and large-scale atmospheric circulation. While summer precipitation in the region was less well related to large-scale circulation, it is usually very dry so that summer precipitation is relatively unimportant. Therefore, further discussion is focused only on the winter part of the year.
As future daily precipitation scenarios would be generated on the basis of future occurrence of the four daily circulation patterns, any changes in daily precipitation would result only from changes in the occurrence of the circulation patterns. To verify whether the changes in the frequencies of occurrence of daily circulation patterns are significant in GCM simulations, observed daily circulation patterns were projected to daily MSLP fields simulated by HadCM3 A2a and B2a, as well as HadAM3H A2a and B2a experiments and their corresponding control runs. Statistical tests checked the significance levels at which future (20702099) frequencies of occurrence of daily circulation patterns differed from their present (19611990) values simulated by the GCM experiments. The t-test for uneven variance was used to test if the mean frequencies of occurrence of daily circulation patterns for 20702099 are different from those for 1961-1990. The F-test was applied to test changes in variance. It should be noted that significant differences are referred only to the model simulations between the two reference periods, i.e. the possibility could not be excluded that the model simulations were in error and the differences
Fig. 1. December-January-February mean (a) probability of rain; and (b) precipitation amount (mm) on wet days; (c) conditional probability
of rain on the occurrence of the winter dry pattern (CP3); (d) conditional wet-day precipitation amount (mm) on the occurrence of the winter dry pattern (CP3); (e) conditional probability of rain on the occurrence of the rainy pattern (CP4); (f) conditional wet-day precipitation amount (mm) on the occurrence of the rainy pattern (CP4)
(a) (b) (d) (e) (c) (f)
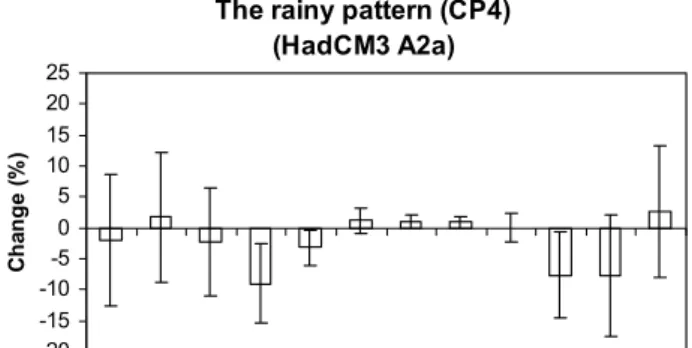
might not be related to the forcings introduced to the models. Figure 2 shows modelled changes in the frequencies of occurrence of daily circulation patterns between 20702099 and 19611990 in HadCM3 and HadAM3H simulations. Error bars indicate intervals at the 0.05 significance level. It is apparent that the scenarios from HadCM3 are quite
different for the two experiments forced by two different greenhouse gases emission scenarios. The frequency of the rainy pattern (CP4) decreases significantly in April and October, for experiment A2a, while that of the summer dry pattern (CP2) increases significantly in October, which may imply less and weaker precipitation in October. However,
Fig. 2. Changes in the frequencies of occurrence of daily circulation patterns between 20702099 and 19611990 from HadCM3 and
HadAM3H simulations (20702099 minus 19611990, error bars showing intervals for the 0.05 significance level)
The winter dry pattern (CP3) (HadCM3 A2a) -20 -15 -10 -5 0 5 10 15 20 25
Jan Feb Mar Apr May Jun Jul Aug Sep Oct Nov Dec
C h a nge (% )
The summer dry pattern (CP2) (HadCM3 A2a) -20 -15 -10 -5 0 5 10 15 20 25
Jan Feb Mar Apr May Jun Jul Aug Sep Oct Nov Dec
Ch a n g e (% )
The rainy pattern (CP4) (HadCM3 A2a) -20 -15 -10 -5 0 5 10 15 20 25
Jan Feb Mar Apr May Jun Jul Aug Sep Oct Nov Dec
C h a nge ( % )
The rainy pattern (CP4) (HadCM3 B2a) -20 -15 -10 -5 0 5 10 15 20 25
Jan Feb Mar Apr May Jun Jul Aug Sep Oct Nov Dec
C h a nge (% )
The blocking-like pattern (CP1) (HadCM3 B2a) -20 -15 -10 -5 0 5 10 15 20 25
Jan Feb Mar Apr May Jun Jul Aug Sep Oct Nov Dec
C h an g es ( % )
The rainy pattern (CP4) (HadAM3 A2a) -20 -15 -10-5 0 5 10 15 20 25
Jan Feb Mar Apr May Jun Jul Aug Sep Oct Nov Dec
C h a nge s ( % )
The winter dry pattern (CP3) (HadCM3 B2a) -20 -15 -10 -5 0 5 10 15 20 25
Jan Feb Mar Apr May Jun Jul Aug Sep Oct Nov Dec
C h a nge (% )
The summer dry pattern (CP2) (HadAM3 A2a) -20 -15 -10 -5 0 5 10 15 20 25
Jan Feb Mar Apr May Jun Jul Aug Sep Oct Nov Dec
C h a nge s ( % )
there is a significant increase in the frequency of the rainy pattern in March, accompanied by a significant decrease in the frequency of the blocking-like pattern (CP1), for the B2a experiment.
Unlike those from HadCM3, the simulations from HadAM3H show very similar scenarios for the changes in the frequencies of daily circulation patterns under the forcings of SRES A2 and B2 emission scenarios. Some differences in the scenarios between A2a and B2a experiments from HadCM3 may be errors introduced by the coarse spatial resolution which leads to an inaccurately presented storm track. No significant changes in the frequencies of occurrence were found for the winter dry pattern (CP3) at the 0.05 significance level between 2070 2099 and 19611990 in HadAM3H simulations; however, a significant decrease was found for the rainy pattern (CP4) in May and November as well as a significant increase in the frequency of occurrence of the summer dry pattern (CP2) in May. These changes may indicate that, in the region under global warming, climate in a transition season can be influenced more significantly. These influences suggest that the summer dominant circulation pattern will prevail for longer than in the present climate and that the north Atlantic storm track may retreat earlier in spring and expand southward later in autumn. Only the results for daily circulation patterns CP2 and CP4 are presented in Fig. 2 for HadAM3H A2a simulation since the results from HadAM3H B2a are similar.
Potential changes of large-scale atmospheric circulation in the region, which have been indicated above, may affect daily precipitation scenarios generated by stochastic weather models. This means that changes in future daily precipitation scenarios result only from the changes in the frequencies of occurrence of daily circulation patterns, whether these changes are due to enhanced greenhouse effects or are just introduced by model errors in GCMs. This also implies that errors in large-scale GCM outputs can still be conveyed into down-scaled daily precipitation scenarios; thus the use of future daily precipitation scenarios requires caution.
Stochastic models and validations
Stochastic multi-site daily precipitation models for the two river basins in this study are simply extended versions of Qian et al. (2002) so that, to cover the two river basins, a total of 42 stations can be included in the models. Model parameters were conditional on the four daily circulation patterns being calibrated with monthly observations for 19611990. Daily precipitation occurrence was simulated by first-order two-state Markov chains and daily precipitation amounts on wet days were modelled withmixed exponential distributions. Spatial correlations in precipitation occurrences and amounts between the stations were preserved in the models. Details of the model structures appear in Qian et al. (2002), derived mainly from Wilks (1998), with conditional structures on daily circulation patterns.
Two validations are required before the stochastic models can be used to generate future precipitation scenarios. The first checks that the models can reproduce the observed characteristics of daily precipitation in the region by generating synthetic daily precipitation data from the observed sequences of daily circulation patterns (Qian et al., 2002). It was found that all basic statistical properties, including spatial correlations, of the observed daily precipitation distributions in the region could be reproduced well by the stochastic models
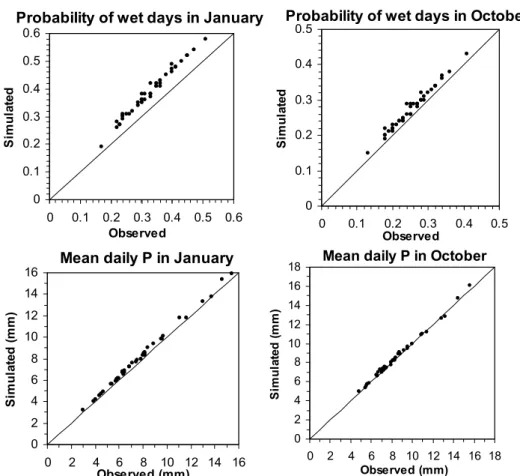
The second validation verifies whether the models can reproduce the present-day climate (say, 19611990) of daily precipitation in the region by generating synthetic daily precipitation from the sequences of daily circulation patterns obtained from GCM-simulated daily MSLP fields. Such validation is also important because the frequencies of daily circulation patterns from GCM-simulated MSLP fields might be systematically biased from observed ones. Figures 3 and 4 show some validation results for the multi-site daily precipitation weather generators with the sequences of daily circulation patterns projected to the Euro-Atlantic MSLP fields simulated by HadCM3 and HadAM3H for 1961 1990. Only results for January and October are shown. Comparisons made with all 42 stations in the two river basins indicated that the simulations were fairly realistic. For January, very slight over-estimates of precipitation occurrences were observed for HadCM3, while for HadAM3H, there were under-estimates; such systematic biases may reflect inaccurate representation of the location and strength of the north Atlantic storm track in the GCMs. Nevertheless, the simulations appeared quite satisfactory.
Simulated changes in precipitation
Future daily precipitation scenarios for the region were generated by the multi-site stochastic weather models with the sequences of the four circulation patterns projected to GCM- simulated MSLP fields for 20702099, respectively, from HadCM3 A2a, B2a and HadAM3H A2a, B2a simulations. Therefore, four future daily precipitation scenarios were developed for the region. Parameters of the stochastic models were kept the same as for the present-day climate. This implies that no changes were assumed in the future to the observed link between daily precipitation in the region and daily circulation patterns. This assumptionProbability of wet days in January 0 0.1 0.2 0.3 0.4 0.5 0.6 0 0.1 0.2 0.3 0.4 0.5 0.6 Observed Simu la te d
Probability of wet days in October
0 0.1 0.2 0.3 0.4 0.5 0 0.1 0.2 0.3 0.4 0.5 Observed Si m u la te d
Mean daily P in October
0 2 4 6 8 10 12 14 16 18 0 2 4 6 8 10 12 14 16 18 Observed (mm) S imu la te d ( mm)
Mean daily P in January
0 2 4 6 8 10 12 14 16 0 2 4 6 8 10 12 14 16 Observed (mm) S imu la te d ( mm)
Probability of wet days in October
0 0.1 0.2 0.3 0.4 0.5 0 0.1 0.2 0.3 0.4 0.5 Observed Si m u la te d
Probability of wet days in January
0 0.1 0.2 0.3 0.4 0.5 0.6 0 0.1 0.2 0.3 0.4 0.5 0.6 Observed Si m u la te d
Mean daily P in October
0 2 4 6 8 10 12 14 16 0 2 4 6 8 10 12 14 16 Observed (mm) S imu la te d ( mm)
Mean daily P in January
0 2 4 6 8 10 12 14 16 0 2 4 6 8 10 12 14 16 Observed (mm) S imu la te d ( mm)
Fig. 3. Probabilities of rain and mean precipitation amounts on wet days simulated by stochastic precipitation models with a sequence of
occurrence of the observed four daily circulation patterns based on HadCM3 simulated present-day MSLP fields against the observed values at 42 stations in the river basins for 19611990
was not completely guaranteed but previous work (Corte-Real et al., 1999a) on this aspect, based on HadCM2 simulations, suggested a positive expectation.
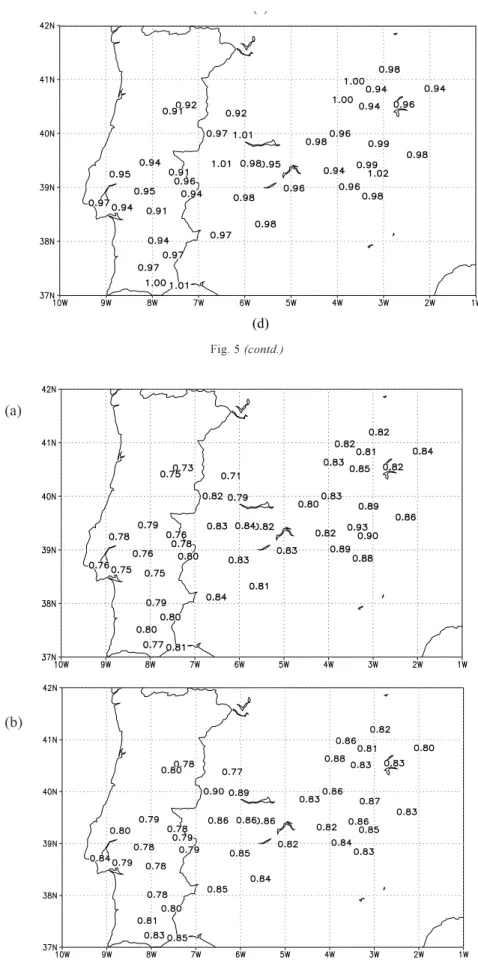
Changes in the probabilities of rain and the mean amounts on wet days in the two river basins were computed at individual stations as the ratios of their climate normals, 20702099 to 19611990. The ratios larger than 1.0 indicate more wet days and more intense rain while a less than 1.0 ratio implies drier and weaker precipitation. Statistical t and F tests were also applied to test the significance levels for the changes. Figure 5 shows a few examples only, indicating significant changes for the probabilities of rain and the mean amounts on wet days in the region. Probability of rain may decrease around 15% for all stations in October, based on HadCM3 A2a simulation. These changes are significant at the 0.05 significance level except at two stations in the eastern part of the river basins (not shown), but the corresponding intensity of daily precipitation decreases, usually less than 10% at most stations, with a few cases of increase. These changes are consistent with the corresponding changes observed in the frequencies of daily circulation patterns. A similar result to the October case of HadCM3 A2a simulation was found for November, based on the HadAM3H A2a experiment. One of the possible factors, which results in significant changes occurring in different months (October in HadCM3 and November in HadAM3H), can be related to the model performance in producing the location and strength of the north Atlantic storm track in the GCMs. Changes in precipitation scenarios based on HadCM3 B2a simulation are different from the A2a results (not shown), indicating uncertainty in precipitation changes due to different greenhouse gases emission scenarios. However, this uncertainty may be also related to the model performance of the GCMs since HadAM3H simulations did not show much difference in the responses to the two emission scenarios SRES A2 and B2.
Changes in monthly precipitation may also be observed, as a result of changes in daily precipitation. Figure 6 demonstrates changes in October monthly precipitation totals based on HadCM3 A2a simulation and in November precipitation totals based on HadAM3H A2a simulation, relevant to the changes in daily precipitation shown in Fig. 5. Monthly precipitation totals for 20702099 can be about 20% less than the values in the present-day climate; decreases are more significant on the Portuguese side. These decreases are significant at the 0.05 significance level with a couple of exceptions (not shown). Anyway, both GCM experiments indicated a decrease in autumn precipitation totals, either in October or November, depending upon models. These changes may have adverse consequences in
future water resources, as they may imply reduced availability of water supply after the dry summer.
It is interesting to check if the precipitation changes computed from daily precipitation scenarios of direct GCM output are mostly coherent with the aforementioned changes in the downscaled daily precipitation scenarios generated by stochastic precipitation models. Although the spatial resolutions in GCMs are too coarse to show any localised changes, precipitation changes in GCMs should be responding physically to any changes in large-scale atmospheric circulation. Although any precipitation changes in the downscaled daily precipitation scenarios are assumed to be associated only with changes in the frequencies of daily circulation patterns, differences may still be expected between direct GCM outputs and the downscaled scenarios. This is because the changes in direct GCM outputs are manifest in all possible changes in large-scale atmospheric circulation in the GCMs; for example, occurrence of new distinguishable circulation patterns that may not be represented by the observed daily circulation patterns in the present-day climate. This means that there may be more confidence in the underlying physics of the changes in the scenarios from the downscaling models if similar changes can be observed from daily precipitation scenarios of direct GCM outputs except for the localised details in the down-scaled precipitation scenarios. Similar changes also imply that precipitation changes in the GCMs are more likely to be related to the changes in the frequencies of occurrence of the observed daily circulation patterns rather than changes to the patterns or statistics of daily precipitation under a circulation pattern. The reliability of the assumption used for developing future scenarios with conditional stochastic weather models is therefore proven reliable.
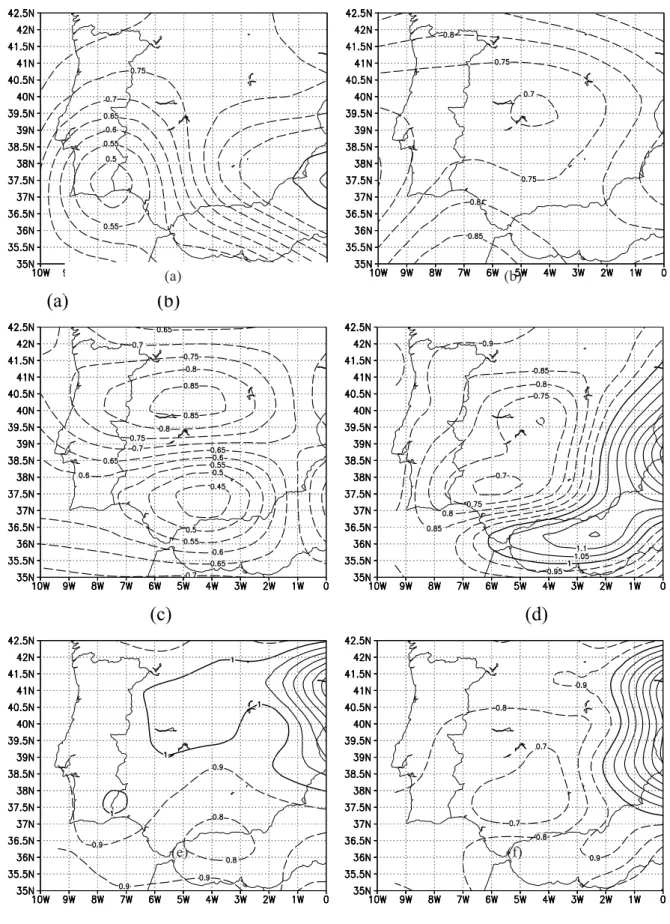
Daily precipitation scenarios are obtained directly from HadCM3 A2a, B2a and HadAM3H A2a, B2a simulations for 20702099 for the grids covering the two river basins. Corresponding monthly statistics are then compared with those values for the modelled present-day climate of 1961 1990 from the same GCM. Some examples are given below. Figure 7 shows ratios of the values of 20702099 to 1961 1990 for the probability of rain, the mean amount of daily precipitation on wet days and monthly precipitation totals in October, computed from daily precipitation simulated by HadCM3 A2a experiment with a coarse spatial resolution (3.75° × 2.5° grids). Relevant results for November, based on daily precipitation simulated directly by HadAM3H A2a on a higher resolution (1.875° × 1.25° grids), are also shown in Fig. 7. Similar patterns in the changes to the results from the downscaled precipitation could often be observed, but apparently the magnitudes of the ratios that present the changes could differ from a coarse grid to its neighbouring
(c) (a)
(b)
Fig. 5. Changes (ratios of 2070-2099 to 1961-1990) in probabilities of rain between 2070-2099 and 1961-1990 for (a) October, based on HadCM3 A2a; (b) November, based on HadAM3H A2a; and changes (ratios) in mean amounts of daily precipitation on wet days for (c) October, based on HadCM3 A2a; and (d) (overleaf) November, based on HadAM3H A2a
(d)
Fig. 5 (contd.)
Fig. 6. Changes in monthly precipitation totals as ratios of 20702099 to 19611990 for (a) October, based on HadCM3 A2a and (b)
November, based on HadAM3H A2a
(a)
(a) (b)
(c) (d)
(a) (b) (e) (f)
Fig. 7. Changes in October (a) probabilities of rain and (b) mean amounts of daily precipitation on wet days and (c) monthly precipitation
totals as ratios of 20702099 to 19611990, computed from HadCM3 A2a simulated daily precipitation on coarse grids; Changes in November (d) probabilities of rain and (e) mean amounts of daily precipitation on wet days and (f) monthly precipitation totals as ratios of 20702099 to 19611990, computed from HadAM3H A2a simulated daily precipitation on coarse grids
grids. This makes it difficult to estimate the changes at the locations between the two neighbouring GCM grids from direct GCM outputs. Results from direct GCM outputs also show that changes from the direct outputs of HadAM3H simulations resembled the downscaled ones much better than did the coarser resolution model HadCM3. The changes from direct GCM outputs are also statistically significant at the 0.05 significance level (not shown). Therefore, changes in the downscaled daily precipitation scenarios do reflect the modelled changes in weather regimes from the GCM simulations. Downscaled precipitation change scenarios are more similar to those from the higher resolution GCM (HadAM3H) than the corresponding results from the coarse resolution GCM (HadCM3). This indicates the effectiveness of the stochastic models for the purpose of downscaling daily precipitation from large-scale atmospheric circulation.
Conclusions and discussion
Rather than discuss future precipitation changes based on daily precipitation scenarios generated by multi-site stochastic weather models, this paper demonstrates how to develop daily precipitation scenarios for river basins through applying multi-site stochastic daily precipitation models to the Guadiana and Tejo basins on the Iberian Peninsula. The stochastic models were conditioned on daily circulation patterns, so that developing future precipitation scenarios with these models was straightforward. The complete development procedure for scenarios involves linking regional precipitation to large-scale atmospheric circulation; calibrating and validating stochastic daily precipitation models with observed large-scale atmospheric circulation; validating GCM- simulated large-scale atmospheric circulation in the region of concern; validating stochastic models with GCM-simulated large-scale atmospheric circulation for the present-day climate; and finally, generating future daily precipitation scenarios with GCM-simulated large-scale atmospheric circulation for a future period. A comparison between the downscaled precipitation scenarios and direct GCM outputs might be useful for analysing the effectiveness of the downscaling methods. Daily precipitation scenarios generated by stochastic weather models, based on projected daily circulation patterns from HadCM3 and HadAM3H simulations for the present-day climate, were fairly realistic in comparison with the observed precipitation statistics. This reflects the good capability of the Hadley Centres newest GCMs, especially HadAM3H, for simulating large-scale atmospheric circulation in the Euro-Atlantic sector. Mis-matches between the synthetic data and the observations might be caused by systematic biases in the frequencies of occurrence of the
observed daily circulation patterns in the GCMs. Hence, climate change impacts on water resources should be based on the differences between hydrological model outputs run with, as inputs, future daily precipitation scenarios and present-day precipitation scenarios, respectively. Future and present-day precipitation scenarios could be generated by stochastic weather models with GCM-simulated sequences of daily circulation patterns for a future climate as well as the present-day climate. Using present-day precipitation scenarios rather than the observed precipitation data would avoid conveying the systematic biases from GCM simulations to the impact results, assuming that such systematic biases could be eliminated in the differences.
Generating future daily precipitation scenarios is straightforward with stochastic weather models conditional on daily circulation patterns. However, it was assumed that the observed links between regional daily precipitation distribution and large-scale atmospheric circulation would still be valid in a future, even changed, climate; hence, changes in precipitation can be associated only with the changes in the frequencies of occurrence of certain daily circulation patterns. If this assumption is not valid, as might occur, e.g. if more precipitation in future is due to higher probabilities of rain under the rainy pattern rather than higher frequencies of occurrence of the rainy pattern, the parameters of the stochastic weather models may have to be modified, perhaps by increasing the probabilities of rain under the rainy pattern in stochastic models for generating future precipitation scenarios. Comparison between the downscaled precipitation scenarios and direct GCM outputs in this study showed that this assumption was reasonable.
Acknowledgements
The HadCM3 and HadAM3H data were supplied by the Climate Impacts LINK Project (DEFRA Contract EPG 1/1/ 154) on behalf of the Hadley Centre and U.K. Met Office. This research was sponsored by EC project SWURVE, under contract EVK1-CT-2000-00075. The authors thank Dr Xuebin Zhang and an anonymous reviewer for their critical comments which helped to improve the presentation of this manuscript. The authors are also indebted to Chris Kilsby for his great editorial effort.
References
Conway, D., Wilby, R.L. and Jones, P.D., 1996. Precipitation and air flow indices over the British Isles. Climate Res., 7, 169 183.
Corte-Real, J., Zhang, X. and Wang, X., 1995. Downscaling GCM information to regional scales: a non-parametric multivariate regression approach. Clim. Dynam., 11, 413424.
Corte-Real, J, Qian, B, Xu, H., 1998. Regional climate change in Portugal: precipitation variability associated with large-scale atmospheric circulation. Int. J. Climatol., 18, 619635. Corte-Real, J., Qian, B. and Xu, H., 1999a. Circulation patterns,
daily precipitation in Portugal and implications for climate change simulated by the second Hadley Centre GCM. Clim.
Dynam., 15, 921953.
Corte-Real, J., Xu, H. and Qian, B., 1999b. A weather generator for obtaining daily precipitation scenarios based on circulation patterns. Climate Res., 13, 6175.
Goodess, C. and Palutikof, J.P., 1998. Development of daily rainfall scenarios for southern Spain using a circulation-type approach to downscaling. Int. J. Climatol., 18, 10511083. Hayhoe, H.N., 2000. Improvements of stochastic weather data
generators for diverse climates. Climate Res., 14, 7587. Johns, T.C., Carnell, R.E., Crossley, J.F., Gregory, J.M., Mitchell,
J.F.B., Senior, C.A., Tett, S.F.B. and Wood, R.A., 1997. The second Hadley Centre coupled ocean-atmosphere GCM: model description, spinup and validation. Clim. Dynam., 13, 103134. Johns, T.C., Gregory, J.M., Ingram, W.J., Johnson, C.E., Jones, A., Lowe, J.A., Mitchell. J.F.B., Roberts, D.L., Sexton, D.M.H., Stevenson, D.S., Tett, S.F.B. and Woodage, M.J., 2003. Anthropogenic climate change for 1860 to 2100 simulated with the HadCM3 model under updated emission scenarios. Clim.
Dynam., 20, 583612.
Katz, R.W., 1996. The use of stochastic models to generate climate scenarios. Climatic Change, 32, 237255.
Mearns, L.O., Rosenzweig, C. and Goldberg, R., 1997. Mean and variance change in climate scenarios: methods, agricultural applications, and measures of uncertainty. Climatic Change 35, 367396.
Nakicenovic, N. and Swart, S., 2000. Emissions Scenarios. A
Special Report of Working Group III of the Intergovernmental Panel on Climate Change. Cambridge University Press,
Cambridge, U.K. and New York, U.S.A. 599pp.
Pope, V.D., Gallani, M.L., Rowntree, P.R. and Stratton, R.A., 2000. The impact of new physical parameterizations in the Hadley Centre climate model: HadAM3. Clim. Dynam., 16, 123146. Qian, B., Corte-Real, J. and Xu, H., 2002. Multisite stochastic weather models for impact studies. Int. J. Climatol., 22, 1377 1397.
Richardson, C.M., 1981. Stochastic simulation of daily precipitation, temperature, and solar radiation. Water Resour.
Res., 17, 182190.
Schubert, A., 1994. A weather generator based on the European Grosswetterlagen. Climate Res., 4, 191202.
Semenov, M.A. and Barrow, E.M., 1997. Use of a stochastic weather generator in the development of climate change scenarios. Climatic Change, 35, 397414.
Semenov, M.A., Brooks, R.J., Barrow, E.M. and Richardson, C.W., 1998. Comparison of the WGEN and LARS-WG stochastic weather generators for diverse climates. Climate Res., 10, 95 107.
von Storch, H., Zorita, E. and Cubasch, U., 1993. Downscaling of global climate change estimates to regional scales: an application to Iberian rainfall in wintertime. J. Climate, 6, 11611171. Wigley, T.M.L., Jones, P.D., Briffa, K.R. and Smith, G., 1990.
Obtaining sub-grid scale information from coarse resolution general circulation model output. J.Geophys. Res., 95, 1943 1953.
Wilby, R.L., 1998. Statistical downscaling of daily precipitation using daily airflow and seasonal teleconnection indices. Climate
Res., 10, 163178.
Wilks, D.S., 1992. Adapting stochastic weather generator algorithms for climate change studies. Climatic Change, 22, 6784.
Wilks, D.S., 1998. Multisite generalization of a daily stochastic precipitation generation model. J. Hydrol., 210, 178191. Wilks, D.S., 1999. Simultaneous stochastic simulation of daily
precipitation, temperature and solar radiation at multiple sites in complex terrain. Agr. Forest Meteorol., 96, 85101.