STUDY OF LAKE-RIVER-ATMOSPHERE INTERACTIONS FOR ORTHEAST CA ADA I CURRE T AND FUTURE CLIMATES
THESIS PRESE TED
AS PARTIAL REQ UIREME T
FOR PHD DEGREE IN EARTH A D ATMOSPHERIC SCIE CES
BY
OLEKSANDR HUZIY
Avertissement
La diffusion de cette thèse se fait dans le respect des droits de son auteur, qui a signé le formulaire Autorisation de reproduire et de diffuser un travail de recherche de cycles supérieurs (SDU-522 - Rév.07-20î î ). Cette autorisation stipule que «conformément à l'article î î du Règlement no 8 des études de cycles supérieurs, [l'auteur] concède à l'Université du Québec à Montréal une licence non exclusive d'utilisation et de publication de la totalité ou d'une partie importante de [son] travail de recherche pour des fins pédagogiques et non commerciales. Plus précisément, [l'auteur] autorise l'Université du Québec à Montréal à reproduire, diffuser, prêter, distribuer ou vendre des copies de [son] travail de recherche
à
des fins non commerciales sur quelque support que ce soit, y compris l'Internet. Cette licence et cette autorisation n'entraînent pas une renonciation de [la] part [de l'auteur] à [ses] droits moraux ni à [ses] droits de propriété intellectuelle. Sauf entente contraire, [l'auteur] conserve la liberté de diffuser et de commercialiser ou non ce travail dont [il] possède un exemplaire.••ÉTUDE DES I TERACTIO S LAC-RIVIÈRE-ATMOSPHÈRE DA S LE CLIMAT PRÉSE TET FUTUR SUR LE NORD-EST DU CA ADA
THÈSE
PRÉSENTÉE
COMME EXIGE CE PARTIELLE
DU DOCTORAT EN SCIE CES DE LA TERRE ET DEL AT ilOSPHÈRE
PAR
OLEKSA DR HUZIY
First, 1 would like to thank my upervi or, Laxmi Su hama, for introducing me to the domain of land surface modelling, for her patience, honesty, encouragement and kind advice.
I would lik to thank aveed Khaliq, for help and advice with statistical ques-tions Bernhard Lehner, for help with the development of the river flow direction upscaling algorithm and for sharing the high resolution dataset used by the a lgo-rithm, René Laprise and René Roy, for fruitful discus ion and advice at the start of the project.
I would al o like to thank SERC, Hydro-Québec and Ouranos for funding the project and centre ESCER for providing th infrastructure, which made thi proj ct possibl .
1 am very grat ful to my wife, Tanya, and on, Mark, for their love, encourag ment, patienc and understanding; to my parents, Misha and elya, for their support and tru t in me from the tart of my path into science.
Al o, pecial thanks to Andrey Martynov, who told m about UQÀM and made my tran ition to the n w 1 arning and re ar h nvironment quick and easy.
It was a pleasure to work with such helpful people like Michel Valin, Katja Winger, Bernard Dugas, adjet Labassi, George Huard, Adelina Alexandru and Delphine Per on. Thank you for your upport and help.
I would al o like to thank all my friends and colleagues at UQÀM for friendly talks and discussion .
LIST OF FIGURES Vll
LIST OF TABLES . Xlll
LIST OF ACRO YMS xv
RÉSUMÉ .. XVll
ABSTRACT XXI
I TRODUCTIO 1
CHAPTER I
ANALYSIS OF STREAMFLOW CHARACTERISTICS OVER T
ORTH-EASTER CA ADA I A CHANGING CLIMATE 7
1.1 Introduction . . . . . . . 9
1.2 Mode! and xperiments . 12
1.3 Methodology 15
1.4 Results . . . . 18
1.4.1 Mode! verification . 18
1.4.2 Projected changes based on en emble averaging approach . 24 1.4.3 Projected change ba ed on merged longer samples 39 1.5 Discussion and conclu ion ..
CHAPTER II
IMPACT OF LAKE-RIVER CO ECTIVITY AND I TERFLOW 0 r THE CA ADIA RCM SIMULATED REGlO AL CLIMATE A D
HY-43
DROLOGY FOR ORTHEAST CA ADA 47
2.1 Introduction . . . . . . . . . . . . 48 2.2 Models, experimental configuration and data . 51
2.2.1 River-lake routing model . . . .
2.2.2 Experimental configuration and observation data
52 53
2.3 Methodology 2.4 Results . . . .
2.4.1 Impact of lakes on regional climate and hydrology . 2.4.2 Direct impact of lakes on streamflow
2.4.3 Impact of interflow 57 59 59
66
712.5 Summary and conclusions 74
CHAPTER III
LAKE-RIVER AND LAKE-AT !J:OSPHERE I TERACTIO SI A
CHANG-! G CLIMATE OVER TQRTHEAST CANADA 77
3.1 Introduction . . . 79
3.2 Models and methods
3.2.1 Madel . . 3.2.2 M thods . 3.3 Results . . . .
3.3.1 Performance and boundary forcing rrors .
3.3.2 Projected regional climate and streamflow changes 3.3.3 Influence of lakes on projected climate change . . 3.3.4 Influence of interfiow on projected climate change 3.4 Conclu ion CONCLUSION REFERE CES 83 83 85 89 89 99
106
108
111 115 119Figure
I.1 Study region with basins of interest, topography [rn] and lakes. The lak s information was taken from the Levell of the Global Lakes
Page
and Wetlands Database (GLWD) (Lehner and Doll, 2004). . . . . 3 1.1 (a) Study domain with its 21 watersheds along with the flow
di-rections. Watersheds are marked using their abbreviated names (Table 1.1). Simulation domain of the CRCM is shawn in the in-set. (b) Location of the gauging stations (red triangles) used in the evaluation of CRCM simulated streamflow characteristics. Station identification numbers assigned by CEHQ are also shawn. . . . . . 14 1.2 Compari on of ob erved and modelled hydrograph
(rn
an dailystreamflows). The length of the observed record varies from 10-20 years within the 1970 to 1999 period. The values of the a h-Sutcliffe (ns) index and correlation coefficient (r) based on mean daily streamfl.ow comparisons, station identification number and longitude-latitude values of station location are also shawn. . . . . 21 1.3 Biases in the (a) mean winter (DJF) snow water equivalent (in mm)
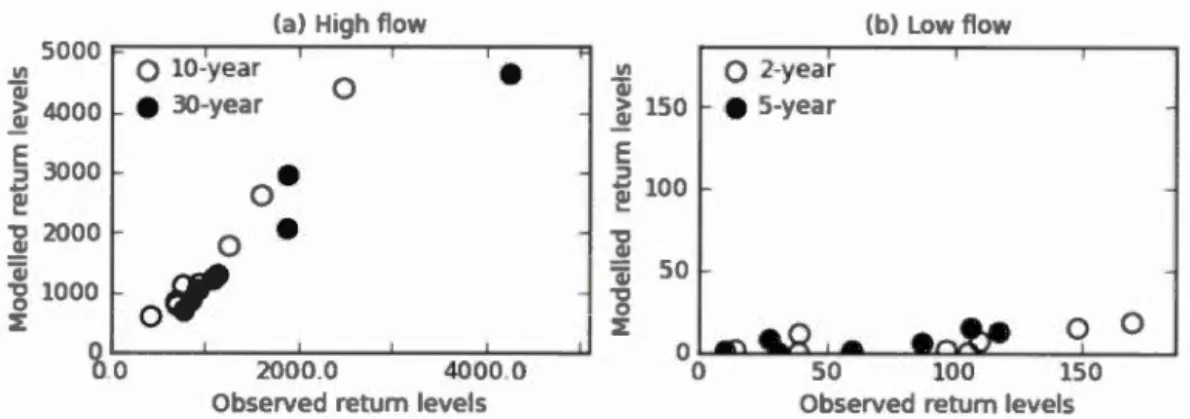
and (b) mean spring (MA if) 2-m temperature (in oc). . . . . . . 22 1.4 Scatter plots of selected ob erved and modelled (a) high and (b)
low flow ret urn levels (in
rn
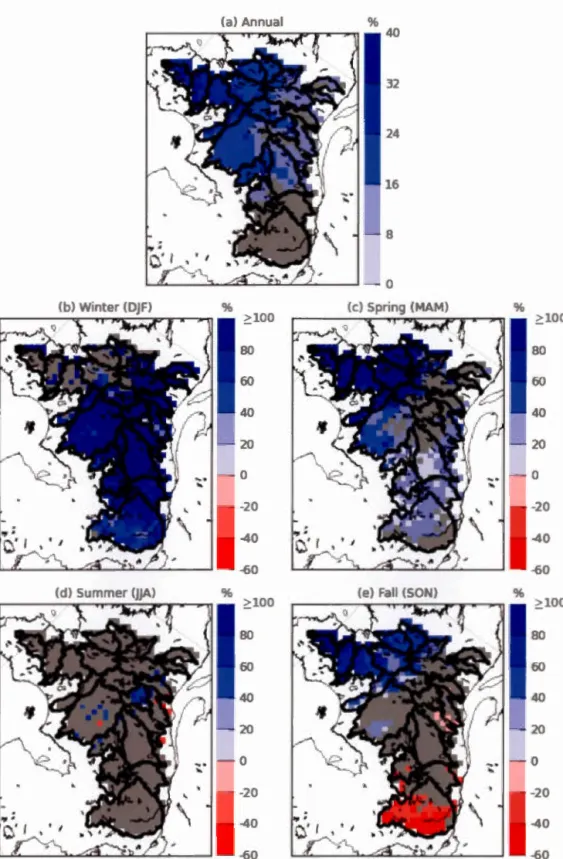
3/ s). . . . . . . . . . . . . . . 23 1.5 Ensemble averaged projected changes to mean a annual and b-eseasonal streamflow. Grid cells where the changes are not signifi-cant at the 5
%
significance level are masked in grey. . . . . . . . 29 1.6 Ensemble averaged projected changes to mean a-d seasonal 2-mtemperature. Grid cells where the changes are not significant at the 5 % significance level are masked in grey. . . . . . . . . . . 30 1.7 Ensemble averaged projected change to mean a-d seasonal
pre-cipitation (in mm/day), and e winter (DJF) SWE (in mm). Grid cells where the changes are not significant at the 5
%
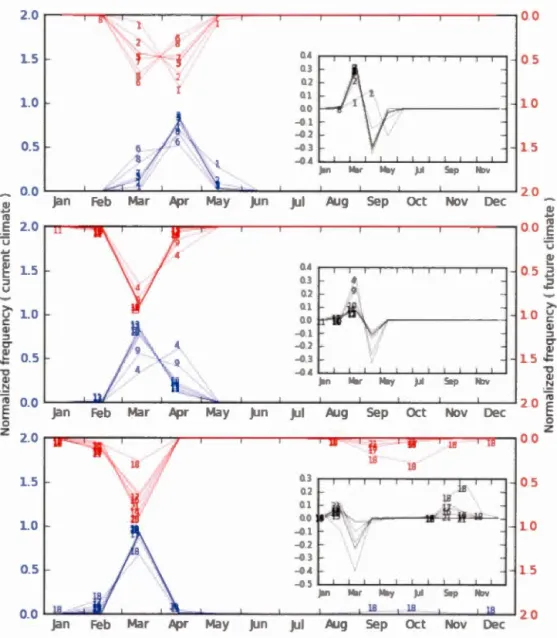
significance level are masked in grey. . . . . . . . . . . . . . . . . . . . . . . . 311.8 En emble averaged normalized frequency of occurrence of 1-day high flow events for current 1970-1999 (left y-axis) and future 2041-2070 (right y-axis) period for northern (top panel), c ntral (middle panel) and outhern (bottom panel) water heds. The num-bers correspond to watershed indices giv nin Table 1.1. In et shows changes to normalized frequency of o currence from current to fu-tur climat . . . . . . . . . . . . . . . . . 32 1.9 Same as in Fig. 1.8 but for low flow events. . 33 1.10 a-e Projected changes (in %) to 10-year return levels of 1-day high
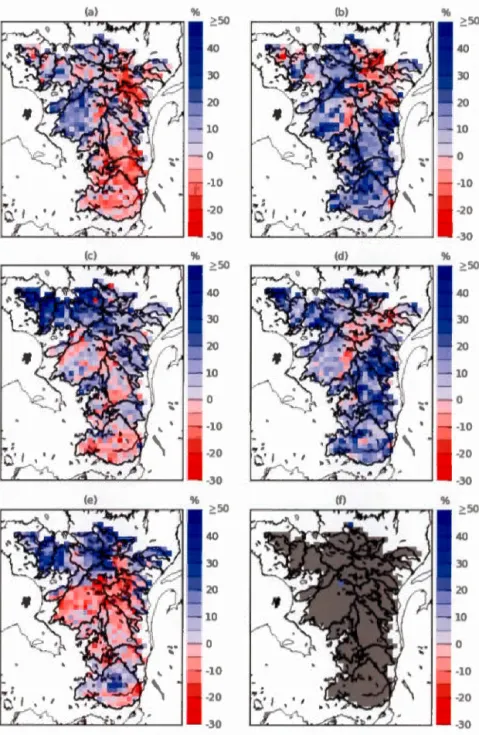
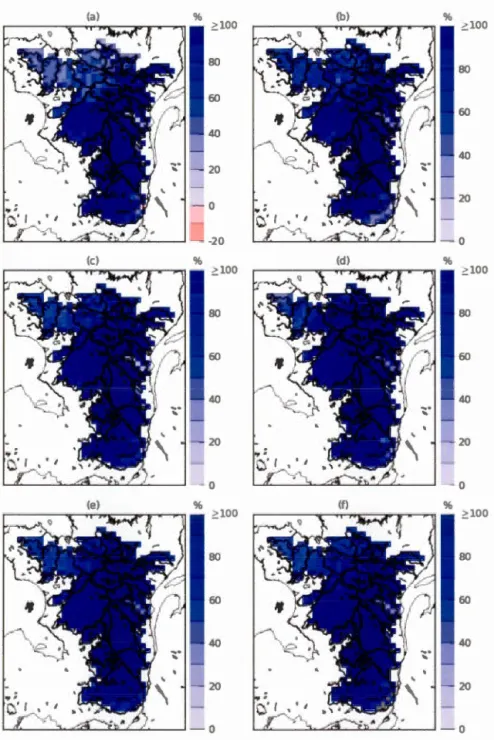
flow derived from five future and CUITent period simulation pairs (F1-C1, F2-C2, ... , F5-C5). f Ensemble averaged changes to 10-year return levels of high flows. Grid ce11s where the changes are not significant at the 5 % significance level are shawn in grey. 34 1.11 Same as in Fig. 1.10 but for 30-year return levels of high flows. 35 1.12 a-e Projected change: (in %) to 2-year return level of 15-day low
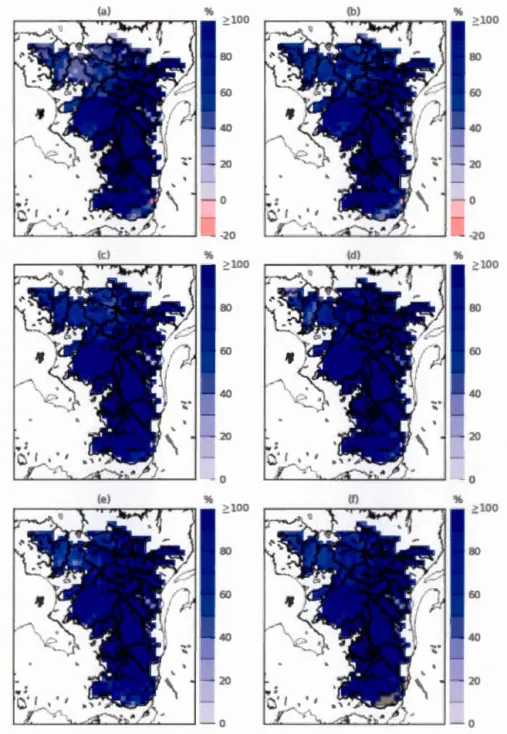
flows derived from five future and CUITent period imulation pairs (F1-C1 F2-C2, ... , F5-C5). f Ensemble av raged changes to 2-year return 1 v 1 of low flows. Grid ce11 where the changes are not significant at the 5 % significance level are shawn in grey. . . 36 1.13 Sam as in Fig. 1.12 but for 5-y ar r turn levels of low flow . 37 1.14 Coeffi.ci nt of variation (ratio of standard deviation to the mean
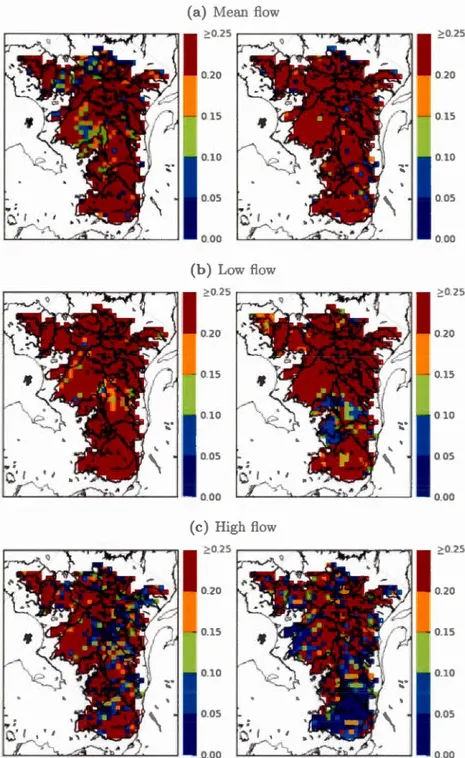
absolute valu bas d on the five nsemble memb rs) of projected changes to selected return levels of high and low flows. . . . . 38 1.15 p values of the Kruskal-Wa11is test for a mean annual flows, b
15-day low flows, and c 1-day high flows for current (left column) and future (right column) climates. . . . . . . . . . . . . . . 40 1.16 Proj cted changes (in %) to mean (a) ammal and (b-e) seasonal
streamflows. Criel ce11s where the changes are not significant at the 5% significance lev 1 are shawn in gr y. . . . . . . . 41 1.17 Project d changes (in %) to 10- and 30-y ar r turn lev 1 of high
flows (left column) and 2- and 5-year return levels of low flows (right column) derived using long r samples (consisting of 150 valu s) for each gTid-c 11 both for urrent and futur limat-s. Grid c 11 wh r the changes are not significant at the 5% significance level are shawn in grey. . . . . . . . . . . . . . . . . . . . . . . . . . . . . . . . . . 42
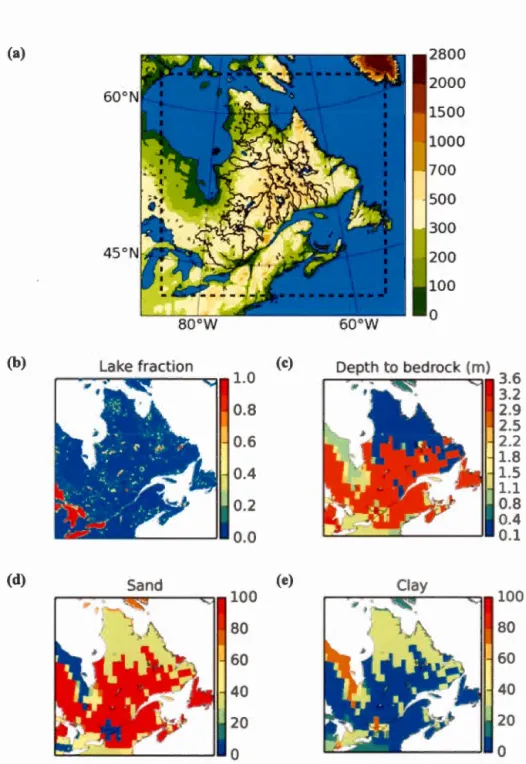
2.1 Representation of local and global lakes in the lake-riv r routing sch me. . . . . . . . . . . . . . . . . . . . . . . . . . . . . . . . . 52 2.2 (a) Simulation domain; the dash d lin separates th blending and
fr zone . The colours correspond to topography (rn). Ocean and inland water bodies ar shown in blue. Geophysical fields used in the simulation : (b) lake fraction, ( c) depth to bedrock, ( d) percentage of sand and ( e) percentage of clay. . . . . . . . . . . . 56 2.3 Inclined soil layer and aturation front at the critical time
(t
=
tc)
when the interfiow regime changes from linear to exponential function of time. . . . . . . . . . . . . . . . . . . . . . . . . . 57 2.4 Upper row: CRCM5- L imulated seasonal rn an 2-m airtem-peratures (0
C), for the 1991-2010 period. Lower row: difference betw n CRCM5-L1 and CRCM5-NL simulated mean asonal 2-m air t mperature. Black dots ar u d to show grid points where the differences are statisti ally significant at 10% significance level. 60 2.5 Same as Fig. 2.4 but for down-welling long-wav radiation at the
urface in W /m2
. . . 60 2.6 Same as Fig. 2.4 but for total precipitation (mmjseason).
2.7 Same as Fig. 2.4 but for streamfiow (m3/s).
2.8 (a) Locations of streamfiow gauging stations (red dots) and their corresponding up tream areas. (b) Differences between modelled (CRCM5-L1 and CRCM5- L simulations) and obs rved (Brown et al., 2003) SWE (mm) for wint r (DJF) and for spring 2-m tem-perature.
2. 9 Corn pari on of the climatologie streamfiow from experiments CRCM5-L, CRCM5-L1 and observations at select d gauging station . The pan ls are sorted according to the station latitude, i.e. the
north-rnmost (southernmost) stations are shown in th top (bottom) 61 61
64
panels. . . . . . . . . . . . . . . . . . . . . . . . . . . . 65 2.10 Mean seasonal streamfiow (upp r row, for imulation CRCM5-L1)
and changes to the mean streamfiow du to lake routing (bottom row, i.e. CRC 15-12 minus CRCM5-L1). All value are in m3
j
s.
Dots show grid cells wh re the differences ar statistically ignifi-cant at 10% significance level. . . . . . . . . . . . . . . . . . . . . 662.11 (a) Same as Fig. 2.9 but for imulations CRCM5-Ll and CRC 115-12, (b) Scatter plot of 90th (left) and lOt" p rcentile (right) of the daily mean climatologie streamflows derived from observed and modelled (CRCM5-Ll and CRCM5-L2) streamflows. . . . . . . . 69
2.12 (a) Locations and identification numbers of lake level gauging sta-tions. (b) Mean ea onal cycle of observed and simulated lake level variability. CRCM5-L2 (red), CRCM5-L2(P-E) (blue), and observed (black, taken from CEHQ dataset). . . . . . . . . . . . 70
2.13 Zonally averaged mean interflow rate for the first soillayer, for the 1991-2010 period, for CRCM5-L2I. . . . . . . . . . . . . . . . . . 71
2.14 Differences between CRCM5-L2I and CRCM5-L2 simulated fields; from top to bot tom are treamflow, surface runoff, mois ture in the first soillayer, total pr cipitation, ubsurface runoff and latent heat flux. Black dots indicate grid cells with statistically significant differences at lü% significance leve!. . . . . . . . . . . . . . . . . 72
2.15 Correlations between CRCM5-L2I variables, for the 1991-2010 pe-riod (INTF - interflow rate in the top oillayer, PR- total precip-itation rate, SI - soil ice fraction in th top soillayer, SWE - snow water equivalent, LHF - latent heat flux), for spring and summer sea ons. . . . . . . . . . . . . . . . . . . . . . . . . . 73
3.1 The simulation domain, with the topography shown in color. The black solid line s parat th fre zon from the blending zone, while the black dashed line eparate the blending and outer halo zones. The grey lin s show every 20th grid point. The bottom 1 ft panel shows th free domain with th basins of interest, while zonally averaged lake fraction are shown in the bottom right panel. The grey circles how basin outlets determined from the flow direction field u ed for streamflow simulation. Ba in boundaries are hown in red. . . . . . . . . . . . . . . . . . . . . . . . . . . . . . 80
3.2 Seasonal mean 2-m air t mp rature [0
C]
from CRU (fir t row), Hopkinson et al. (2011) (second row) and the differences between ERAI-CRCM5-L and CRU (third row) and ERAI-CRCM5-L and Hopkinson et al. (2011) (fourth row), for the 1980-2010 period. CRU value are masked over the Great Lakes, since tation data fi.·om over the lake. were not used to produce this data et. . . 90
3.4 Observed (from Brown et al. (2003); top panels) and ERAI-CRCM5-L simulated (middle panels) SWE [mm] for winter and . pring for th 19 0-1996 period. Differences b tween ERAI-CRCM5-L ·imu-lated SWE and that observed are hown in the bottom panels for the sam period.
3.5 (a) Locations and identification numbers (IDs) of the gauging sta-tions considered for validation, with their up tream areas ( d eter-mined from the flow directions field) shown shaded. (b) Comp ar-ison of observed (black) and modelled (blue and r d correspond to ERAI-CRCM5-L and CanESM2-CRCM5-L simulation , resp ec-tively) mean annual hydrographs [m3 /s] at elected tations. The analysed time interval are based on the availability of observation
92
data during the 1980-2010 period. . . . . . . . . . . . . . . . . . 93
3.6 Scatter plots of 10-and 50-year ob erv d and modelled return levels of 1-day high flow (top panel ) and 2- and 5-year observed and modelled return levels of 15-day low flow, at the six selected gauging
tations shown in Fig. 3.5. . . . . . . . . . . . . . . . . . 94
3. 7 Boundary forcing errors, i. . differences between CanESM2-CRCM5-L and ERAI- CRCM5-L simulations for the 1980-2010 period, for 2-m air temp rature
[
o
C]
(first row), total precipitation [mm/day] ( ond row), SWE [mm] (third row) and streamflows [m3 /s] (fourth row). . . . . . . . . . . . . . . . . . . . . . . . . . . . . . . 953.8 Simulat d rn an annual hydrograph [m3/ ] for the reanalysis-driven ERAI-CRCM5-L (blue) and the GCM-driven CanESM2-CRCM5-L (red) simulations, for the period 1980-2010, at the outlets of th WAS, SAG, RDO, PYR, LGR and AR basin. . . . . . . . . . 96
3.9 Project d changes for the 2070-2100 period with resp t to the 1980-2010 period to 2-m temperature [
o
C]
,
total precipitation [mm/day], SWE [mm], latent heat flux [W jm2] and streamflows [m3 js]· th grid-cells wh re the changes are not significant at the 5% signif-icance lev 1 are indicated with dots. The changes ar bas d on CanESM2-CRCM5-L simulation results between 1980-2010 and 2070-2100 periods. . . . . . . . . . . . . . . . . . . . . . . . . 1003.10 Projected changes for the 2070-2100 period with respect to th 1980-2010 period to the 10-and 50-year return levels of 1-day high flow (upper panel) and of 2- and 5-year return levels of 15-day low flow (bottom panel) for CanESM2-CRCM5-L. Changes that are not significant at the 5% significance leve! ( evaluated using bootstrap procedure) are hatched over. . . . . . . . . . . . . . . . . . . . . 101 3.11 Zonally averaged projected changes to (a) lake surface wat r
tem-perature, (b) lake ice thickncss and (c) fraction of lake ice and (d) lake levels for th period 2070-2100 with respect to 1980-2010 from the CanESM2-CRCM5-L imulation. . . . . . . . . . . . . . . . . 102 3.12 Impact of lakes on projected changes for the period 2070-2100 with
respect to the period 1980-2010 (i.e. differences between proj cted change based on CanESM2-CRCM5-L and CanESM2-CRCM5- L proje ted chang s) to seasonal m an 2-m air temperature [0
C]
,
to-tal precipitation [mm/day], SWE [mm], latent heat flux [W /m2], streamflow[m3/s]. . . . . . . . . . . . . . . . . . . . . . . . . . . . 105 3.13 Projected changes to mean hydrographs at the outlet of the AR 1,PYR LCR, WAS, SAC, RDO basins for CanES t12-CRC t15- L (blue) and CanESM2-CRCM5-L (red) simulations and the differ-ence in projected change (green). orth rn (southern) basins are shawn in the top (bottom) panel. AU values are in m3
/ . Th l ft axis indicates projected changes (r d and blue !ines) and the right axis indicates differences in projected changes. . . . . . . . . 106 3.14 Zonally averaged interflow rate (for the first soi! layer, mm/day)
simulated by CanESM2-CRCM5-LI are shown for current (1980-2010) and future climat (2070-2100) (upper row). The difference be-tween the futur and current climate, i.e. projected changes is shawn in the e ond row. . . . . . . . . . . . . . . . . . . . . . . . 109 3.15 Projected chang s to mean hydrographs at the outlets of the ARN,
PYR, LCR, WAS, SAC, RDO basins for CanESM2-CRCM5-L (blue) and CanESM2-CRCM5-LI (red) simulations and the differ nee in projected change (green). Northern ( outh rn) basin are shawn in the top (bottom) panel. AU value ar in m3 / . The left axis indicates proj cted change (red and blue !ines) and the right axi indicates differenc s in projected changes. . . . . . . . . . . . 110
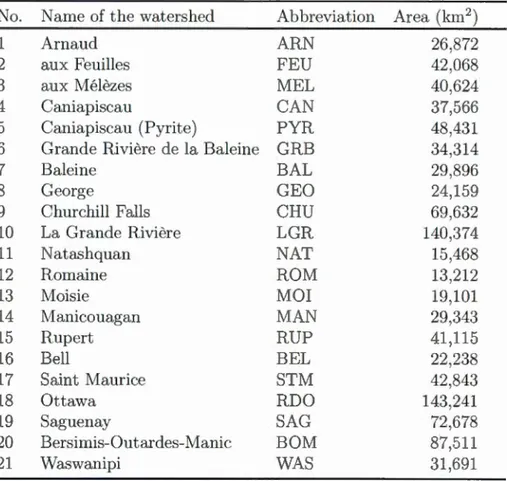
Table Page 1.1 Description of 21 water hed u ed in the tudy . 11 2.1 List of simulations u ed in the cmTent study. 58 3.1 List of simulations us d in the current tudy. 8 3.2 ames, abbr viations and drainage areas (km2
) of the studied wa-tersheds; the ar as are calculated based on the flow direction field. The asterisk
(*)
indicates compound basins (PYR ontains CAand MA is a sub-basin of BOM). . . . . . . . . . . . . . . . 89 3.3 Annual mean biases [%
] and corr
lations for the mean hydrographat the 6 elected stations compared to those observ d. All th correlation coefficients are significant at the 1% significance level 98
CanESM2 CEHQ CGCM CRCM CRU ERA GCM GLCC IPCC LHF LSS MCG MCR tiR CC NARCCAP RCM RCP SWE UDel USGS
Canadian Earth System Model, 2nd generation
C ntre d'Expertise Hydriqu du Québec
Canadian Global Climate Model
Canadian Regional Climat Mod l
Climatic Research Unit
European Centre for Medium-Range Weather Forecasts re-analysis
Global Climate Model
Global lake cover characteristics
Intergovernmental Panel on Climate Change
Latent Heat Flux
Land Surface Scheme
Modèl s Climatiques Globaux
Modèl s Climatiques Régionaux
Mod '1 Régional Canadien du Climat
orth American Regional Climate Change A essm nt Program
Regional Climate Model
Repre entative Conc ntration Pathway
Snow wat r equivalent
Univer ity of Delaware
Le cycle hydrologique de la terre devrait être modifié par le changement cli-matique. Des études précédentes basées sur des modèles climatique globaux (MCG) ont montré une future intensification dans la moyenne globale des précip-itation t de l''vaporation. C p ndant, à l''chell régionale, de augmentations et diminutions significatives sont prédite . L étude des réponses régionales au changement climatique requiert le plus ouvent l'utilisation de simulation à plus haute ré olution que celle employée dan l modèles globaux. Par conséquent le mod 'le climatique régionaux (MCR) ont de plu en plus utilisé dans le but de comprendre le interaction et rétroaction entre les différ ntes composantes du sy tème climatique dans le cadre du climat pré ent et futur. La résolution des MCR est en con tante augmentation rendant nécessaire la prise en compte de urface d' au intérieures ain i qu l ur interactions avec les autre co m-posantes du sy tème climatique. L'objectif de cette étud t l'implémentation d'un module rivière-lac ain i que la parametri ation de l'écoulement latéral dans le ol (écoul ment hypodermique) dans la cinquième génération du modèle clima-tique canadien du climat (MRCC5). Le nouveau systèm ain i développé era ensuite validé par l évaluation des interactions rivière-lac-atmosphère ainsi que les changem nt proj tés dans l'hydrologie de surface et le climat dans le régions de latitudes élevées. Le domaine con idéré dan tte 'tud couvre 21 bassins ver-sants du nord-est Canadien locali é principalement dans la province du Québec avec quelques parties situées dans les provinces avoisinantes (Ontario et
Terre-euve-et-Labrador). Le choix du domain est justifié par la multitude des lacs et rivièr s dont l importance est cruciale pour la population à bien des égard on pourrait cit r l'hydro-électricité tran ports touri me. Cette étude est donc d intérêt scientifique mais aussi économique.
La première partie de cette thèse e t con acrée à l analy e des caractéristique de débits, c'est à dire la moyenne annuelle les écoulements aisonniers ainsi que le extrêm dans un cadre de climat pré ent et futur. Aux fins d analyse, les débits sont d'rivé à partir de imulations d'en emble de 10 membres produite par la quatrième gén'ration du modèle régional canadien du climat (MRCC4) piloté par d ortie du modèle global canadi n du climat (cinq repré entant le climat présent 1970-1999 et les cinq restant le climat futur 2041-2070). Pour dévelop-per le changem nt projeté dans l s caractéristiques des débits, deux approches sont utili ée : l'une basée sur le conc 1 t de la moyenne d'ensemble alors qu la
deuxième est basée sur la fusion de membres de simulations du climat courant et futur selon des tests de comparaison multiples. La vérification des caractéris-tiques des débits simulés par le MRCC pour la période 1970-1999 suggère que les hydrographes moyen simulés ainsi que les caractéristiques des hauts débits sont raisonnablement comparables à ceux observés à l'exception de certaines déficiences dans la repré entation des extr~mes dans les faibles écoulements. Les résultats des hangements projetés dans les débits annuels moyens montrent une augmentation statistiquement significative sur la majorité du domaine d'étude alors que pour les débits saisonniers, on note des augmentations ou diminutions selon la saison. On note également que les valeurs de période de retour de 2 et 5 ans pour les débits moyennés sur 15 jours affichent une augmentation significative même si ces changement sont faibles en valeur absolue. En se basant sur l'approche de la moyenne d'en emble, le changements obtenus pour les valeurs de période de retour 10 et 30 ans ne sont généralement pas significatifs. Cependant, une anal-yse similaire effectuée sur des échantillons plus longs révèle des augmentations significatives dans les périodes de retour des hauts débits principalement dans les bassins ver ants eptentrionaux. Ce résultats suggèrent, pour le développement de projections robustes, d'utiliser des échantillons plus longs et particulièrement pour les évènements extrêmes. Il est important de fournir d l'information sur les projections futures des caractéristiques de débits mai il est surtout important de comprendre les mécani mes physiques derrière ces changements projetés. Ceci a incité à des développements supplémentaires au MRCC ainsi qu'à la conduite des expériences de sensibilité afin de répondre à d'importantes questions scientifiques. Ceci fait l'objet de la deuxième et la troi ième partie de cette thèse.
Dans la deuxième partie de la thè e, d'importants processus tels que la connec-tivité lac-rivière et l'écoulement hypodermique, c'est à dire l'écoulement latéral de l'eau dans les couches superficielles du sol, sont implémentés dans le MRCC5. En utilisant plusieurs expériences avec le modèle régional, les interactions entre lacs et rivières ont été évaluées ainsi que leur impact sur le climat régional et l'hydrologie nord-e t Canadien; lors de ces simulations les lacs sont représent's par un modèle unidimen ionnel (Hostetler), alors que les rivièr s sont modelées à l'aide d'un schéma de routage distribué (WATROUTE-modifié). La comparaison des simulations du MRCC5 avec et sans lacs pour 1 climat présent montre de large différences dans les précipitations hivernales et estivales et les température hiver-nales et met en évidence l'importance des lacs. Le simulations du MRCC5 avec et ans int ractions lac-rivièr suggèrent une meilleure repré entation des débits dans le pr mier ca . L'inclu ion du processu d'écoulement hypodermique induit de augmentations des débits de plusi ur rivière. pendant l'été et l'automne cau-sant des changements modestes dans les interactions sol-atmosphère à travers la modification de l'humidité du sol. L'impact de l'écoulement latéral sur les débits dans la zone d'étude est comparable à celui obtenu en incluant les interactions
lac-atmosphère.
Finalement, la troisième partie de la thèse est consacrée à l'évaluation de l'impact du changement climatique sur les lacs et l'hydrologie ainsi que l'influence des lacs sur les changements projetés sur l climat régional et l'hydrologie du nord-est du Canada. À cette fin, des simulations de changement climatique transitoire ont été réalisées avec le MRCC5 pour la période 1950-2100 avec et sans lacs avec le scénario RCP8.5. Le. conditions aux frontières latérale sont fournies par des orties du modèle canadien du système terre (CanESM2). La comparaison des changements projetés basés sur les simulations avec et sans lacs révèle que l'inclusion des lacs amortit les changements pour la température à 2-m et ceci pour toutes les saisons. Comme pour les débits, les lacs atténuent les changements des débits printaniers durant la fonte à cause de l'effet de leur effet de stockage. De façon similaire, on note que les lacs augmentent les changement projetés dans les débits estivaux du à la libération progressiv d l'eau provenant de la fonte de neige qu'ils emmagasinent.
La contribution scientifique principale de ce travail est un meilleure compréhen-sion des interactions lac-rivière-atmosphère sur la région d'étud . Ce travail est innovateur dans le en où c'est la première fois que les interactions lac- rivière-atmosphère sont examinées au sein d'un système régional de modéli a ti on clima-tique. Ces processu sont également étudiés dans un contexte de changement cli-matique régional dans le but de quantifier leur impact sur le ignal de changement climatique sur les variable de surface ainsi que variables atmosphériques proches de la surface. Un résultat quelque peu technique de l'étude est l'exécution on-line du chéma de routage au sein d'un cadre complexe de calcul parallèle sur lequel tourne le MRCC5. Des amélioration additionnelles pourraient être apportée à ce système en incluant l'hydrologie thermiqu et la modélisation de la glace des rivières, ceci serait très bénéfique pour adresser d'autres questions scientifiques. Mots clé: Changement climatique; Modélisation climatique régionale;
Modéli-ation des débits; Modélisation des rivières; Modélisation des lacs, Interactions lac-rivière; Interactions lac-atmosphère; Débits extrêmes.
Climate change is expected to modify th Earth's hydrological cycl . As shown in previous studies using Global Climat Models (GCMs) an intensification of the global hydrological cycle is proj cted for th future limat , with both global aver-age pr cipitation and evaporation increasing in the future. However, there will b significant increa es or decrea es at regional scales. To tudy regional r spon e to climate change higher resolution simulation than those provid d by GCMs are often requir d. Th r for , R gional Climate Models (RCMs) ar b ing u d more and more to understand interactions and feedbacks between variou components of the climate system in CUITent and future climates. The resolutions of RCMs are on the rise and at high resolution it b cornes important to consid r inland water bodies and th ir interaction with oth r compon nt of the climate y t m. This study is aimed at implementing a river-lak module and interfl.ow paramet riza-tion in the fifth g n ration Canadian R gional Climat Madel (CRCM5), and asse ing riv r-lake-atmo pher interaction and projected chang to the surface hydrology and climate for a high latitude region using this newly developed y -tem. The study region considered in thi study covers 21 northeast Canadian watersheds, located mainly in Quebec province and orne part of adjoining On-tario, wfoundland and Labrador provinc . Thi domain i el ted giv n it innumerable lakes and rivers, that are crucial to the population in many respect , i.e. hydropower gen ration, transportation, touri rn, thus malüng it intere ting both from sei ntific and economie points of vi w.
The first part of this thesis focuses on th analy is of streamflow characteristic i.e. mean annual and seasonal fl.ows and extreme high and low flows in CUlT nt and future climates. For the analysis, streamfl.ow are derived from a 10-member ensemble of the fourth generation Canadian Regional Climate Mod l (CRCM4) simulations, driv n by th Canadian Global Climate Mod 1 outputs, of which five correspond to current 1970-1999 period, while the other five corre pond to future 2041-2070 period. For developing projected changes to str amfl.ow chara teri -tics, two different approaches are used: one based on the concept of nsemble averaging, whil th other approach i bas d on m rg d ampl f urrent and similarly future simulations following multiple comparison tests. Verification of the CRC il imulated treamfl.ow characteristics for the 1970-1999 period suggests that the madel simulated mean hydrograph and high flow characteristics com-pare reasonably well with those ob erved albeit sorne deficien ie in representing
XXll
the low flow extremes. Results of projected changes to mean annual streamflows suggest statistically significant increases nearly all over the study domain, while those for seasonal streamflow show increases/ decreases depending on the season. Two- and five-year return level of 15-day low flow are projected to increase sig-nificantly over most part of the study domain, although the changes are small in ab olute terms. Based on the ensemble averaging approach, changes to 10- and 30-year return levels of high flows are not generally found significant. How v r, when a similar analysis is performed u ing longer amples, ignificant increases to high flow return levels are found mainly for northernmost watersheds. Thi part highlights the need for longer sampl s, pmticularly for extreme events, in the development of robust projections. Although important information on projected changes to streamflow characteristics are developed, it is important to understand the physical mechanisms behind these projected changes. This led to further devel-opments of the CRCM and s n itivity experiment to focus on important science questions. This con titute parts two and tl1ree of thi the is.
In part two of the thesis important land proce se such as lake-river connectivity and interflow, i.e. the lateral flow of water in the surface soil layers, were imple-mented in the CRCM5. Using a suite of experiments performed with the regional climate model, the interactions between lakes and riv rs and their impact on the regional climate and hydrology of north ast Canada ar ass ed; in the e im-ulations lakes are r presented by a one-dimensional madel (Hostetler), while the rivers are modelled using a distributed routing scheme (WATROUTE-modified). Comparison of CRCM5 imulations with and without lak s for curr nt climate suggests larg differences in winterjsummer precipitation and winter tempera-ture, highlighting the importance of lakes. CRCM5 simulations performed with and without lake-river interactions suggest improved representation of stream-flows and lake level in the former case. Inclusion of the interflow process leads to increases in streamflows during summer and fall seasons for many rivers, causing modest changes to land-atmosphere interactions via modified soil moisture. The impact of interflow on streamflows obtained in the tudy region, is comparable to the impact of lake-atmosphere interaction on tr amflows.
Finally, the third part of the thesis focuses on the asses ment of the impact of climate change on lakes and hydrology as well as on the influence of lakes on proj cted change to regional climate and hydrology for Iortheast Canada. To this end transient limate change simulations spanning the 1950-2100 period, with and without lake , m·e performed with CRCM5 for th RCP .5 c nario, using th Canadian Earth System Madel (CanESM2) output a driving data at the lateral boundaries. Comparison of proj ct d change based on the imulation with and without lakes uggests. that lak dampen projected change to 2-m temperature for all seasons. As for streamflows, lakes attenuat proj ct d changes
to spring streamftow and this is due to th storage effect of lakes. Similarly lakes augment projected changes to summer streamftows due to the gradual release of snowmelt water stored in lakes.
In summary, the main cientific contribution of this work is improved unde
r-standing of lake-river-atmosphere interaction over the tudy region. This work is innovative in that it is for the first time that lake-river-atmosphere interactions are investigated within a single r gional modelling system. These proc ses are also studied in the context of regional climate change to quantify their impact on the simulated climate change signal in the near-surface atmo pheric and selected
surface hydrologie fields. A somewhat technical outcome of the study is the on-line routing sch me within a complex parallel framework of CRCM5 which might b furth r improved by including thermal hydrology and river ice mod lling that would be benefi ial to address other ien e questions.
Keywords: Climate change; Regional climate modelling; Streamflow modelling;
River modelling; Lake modelling; Lake-river int ractions; Lake-atmosphere inte
Context and motivation
Earth's climate y tem i complex and its components interact on a wide range of temporal and spatial scales. Global Climate Models (GCMs), with exten iv representation of physical proce ses within the atmospheric and o ·eanic compo-nents of the climate system are the most comprehen ive tool available to addre these interactions and anticipated changes in futur climate. Several recent stud-ies based on GCMs report important regional differences in the response to the increased greenhou e ga forcing, either through changes in the hydrological cycle (Held and Soden, 2006) or atmospheric circulation pattern (Vallis et al., 2014). For example, Held and Soden (2006) report an intensification of the poleward moisture transfer and an enhancement of pr cipitation minus evaporation pat-tern in future climate. To better understand the regional changes, high r patial resolution than traditionally used by GCM (;::: 100 km), is necessary. Regional Climate Models (RCMs) offer higher spatial resolution than GCMs, sine the simulation domains are much smaller in the ase of RCMs, allowing for greater topographie complexity and finer-seale atmospherie dynamies to be simulated (Giorgi and Bates, 1989· Lapri e 2008). Therefore RCMs are more suitable for generating information required for many water related regional impact studie (Leung et al., 2003; Jha et al., 2004; Sushama et al., 2006; Poitras et al., 2011; Huziy et al., 2013; Clav t-Gaumont et al., 2013).
RCMs as well as GC tl u land urfaee schemes (LSSs) to repr nt heat and humidity exehange between the land surface and the atmo phere. The LSSs have evolved from simplifi d energy and water budget equations (bueket scheme) into sophistieated physically based models, repre nting soil moisture and t mp rature profiles, snow and vegetation eomponents (Pitman, 2003). Even though the im-portanc of land surfae has be n reeognized since a long time, th parametrization of lakes was not adequately addres ed in majority of GCMs (Dutra et al., 2010;
2
Subin et al., 2012) and RCMs (Martynov et al., 2012; Samuelsson et al., 2010) until recently. In addition to the obvious impacts of lakes (warming in winter, increased humidity and precipitation, spring and summ r cooling), th y an also lead to decr as s in precipitation by stabilizing overlaying air masses depending on the depth and size of lakes, changes in radiative fluxes through cloud caver modification and other indirect impacts on the regional climate. Although these feedback seem to be well capturee! by the sub-grid lake parametrization, the re-alism of the simulations is still limitee! when applied to very deep or large lakes (Bennington et al., 2014), mainly due to the lack of representation of circulation and relatee! processe in the 1D lak mad ls.
In the context of a changing climate, the stability of freshwater re ource , is a major concern for variou e anomie s ctors, requiring detailed and reliable infor-mation of proj ct cl changes to the surface hydrology and climate. For example, information relatee! to changes in river flow /lake characteristics is important in th
management and planning/adaptation, notably for energy and agri ulture ector .
Currently, most of the impact and adaptation tudies use climate madel outputs to drive lake/river (hydrological) models offiine, to study changes to lake and river flow characteristics. However, with the improved representation of land processes in climate models, it is possible to obtain streamflows dire tly from many GCMs
and RCM . RCMs and GCMs, with their complete do ed water budget including
the atmospheric and land surface branche , are ideal tools to understand bcttcr the linkag and feedbacks between climate and hydrologie system . However, many tudies (Music et al., 2009; Su hama et al., 2006; Muerth et al., 2013) have ident i-fiee! biases in climate madel simulated surface hydrology particularly streamflows. This is primarily du to th lack of repre entation of processes in the models. For
exampl , realistic simulation of streamflows requires adequate representation of
lakes and lak -river conn ctivity in models. Other important processes in luc! interflow, i.e. lateral flow of wat r in the upper soil layers along the topographie
slop s, and surface-groundwater int ractions. The pro wh n in orporat cl
in climate mad l , in addition to the urface hydrology may al o impact the s ur-face climate through modification of the surface energy and water budg ts. This re earch thus makes an important contribution by bridging the gap between re-gional climat and hydrology by considering lakes, rivers, river-lak conn ctivity,
interfiow and th atmosph r within the same regional climate rnodeling tem.
Region of tudy and background information
The focu region of this stu ly on i t of 21 basins (Arnaud, Feuille. , Mélèzes, Cauiapiscau, Caniapiscau (Pyrite), Grande rivi 're de la Baleine, Baleine, Georg , Churchill Fall , La Grande Rivière, Natashquan, Romaine, Moisi , Ma nicoua-gan. Rupert, Bell, Saint !J:auri e, Ottawa, Saguenay. Bersimis-Outarde - tlani . Vv wanipi) covering parts of northeastern Canadian province : Quél ec, lew-foundland and Labrador, and Ontario (Fig. 1.1). The mo t important of thes ba in is th La Grande, with an in talled total power generation capacity of 17,000 MW. Ninety percent of this capacity come from re ervoir-typ power sta-tions. whil the r ~ t is gen rat cl by h run-of-river tati on . For comparison,
Lege nd • GLWD Level1 and ocean D Basins of lnterest Topography (m)
•
o
-
44
•
es
- 131 - 175Figur 1.1: Study region with basins of inter~st, topography [rn] and lake . The lake information was taken from the Levell of the Global Lakes and W tlancls Database (GL\iVD) (Lehn r and Doll, 2004).
Québec' :ummer peak demand 1. around 21000 MW and it goes up to 39000 1W in winter.
The large t natural lake by area in Québec is the lake Mistassini (around 2164 km2
, with the maximum depth of 183 rn). It is located in the central part of the tudy region and drains mostly into the Rupert River. However, there are no major hydropower generation facilities downstream of the lake. On th contrary, Manicouagan lake, the fifth largest lak in the world by volume, located to the east of Lake Mi tassini, is a very important reservoir for hydropower generation in the region. It serves as storage for downstream rivers /[anicouagan and Outardes, where around 7000 MW of hydropower generation capacity is installed.
Streamfiows and lake levels for these regions exhibit substantial variability within the year. The highest streamfiws occur primarily during the melting season. Therefore, understanding streamfiow regimes and streamfiows is of interest to understand fiooding risks. A for low streamfiows, they are mostly observed during winter, with lakes and groundwater b ing the main sources. Asses ing low fiows is of interest to facilitate better management of hydropower generation, due to the higher 1 tricity demand during winter.
Scientific obj ctiv and outline
This r s arch is aimed at tudying lake-river-atmo pher interactions and their evolution in future climate, for ortheastern Canada, using the fifth generation Canadian Regional Climate Madel (CRCM5). Th main s i nee question ad-dressed are: (1) What is the impact of the increased greenhouse gas concentra-tion in the atmosphere on the climate and hydrology of orth astern Canada? (2) What is th rol of lake-river and lake-atmosphere interactions in modifying the regional climate and hydrology for the study region? (3) What i the impact of lakes, lake-river connectivity and interfiow on projected changes to the surface di-mate and hydrology? To answ r the e questions using a single regional modelling system a river madel and lake-river interactions and interfiow parametrization are impl rn nted first in CRCM5. Using carefully designed CRCM5 experiments, with and without the newly introduc d modulesjprocesses, for current and future climates, the answers to the above posed questions are sought. This research is
innovative in that it is the first time that a single regional modelling system is u ed to addre the above indicated questions, which is crucial information for many impact and adaptation studies.
To model river flows in CRCM5, the distributed routing sch m WATRO TE (Sauli t al., 2000) is used. The lake madel considered is the Ho tetl r mod l (Hostetler et al., 1993), which i a 1D column madel bas d on a vertical tempera -tm diffusion quation. Lakes and rivers exchange water fluxes, via river and lake routing, and thi i important for the realistic representation of treamflows. Th outline of th thesis is presented b low:
Chapter on focu e on the analy i of trea.mflow characteri tic , i.e. mean annual and seasonal flow and extreme high and low flows, in current and futur climate (Que ti on 1 ab ove). For the analysi an ensemble of simulations from the four th g n ration Canadian Regional Climat Madel (CRCM4), for current and future climates i on id r d. For dev loping projected change to tr amflow char ac-teristics, two different approaches are used: one based on the concept of ensemble av raging, whil the other approach i based on merg d samples of current and similarly future imulations following multiple comparison te t . Thi work has been publi h d in Climate Dynamics.
In the second chapter of the thesis, important land processes such as lake-riv-r conn ctivity and interflow, i.e. the lateral flow of water in th surface soil layers are implemented in CRCM5. Using a suite of experiments performed with th regional climat mod l, th int raction b tw n lake and riv r and their im-pact on th r gional climate and hydrology of ortheastern Canada ar a s sed (Qu tian 2 abov ). Thi work has b n ubmitted to Climat Dyna.mics.
In th con luding third part of this work, the regional mod l with and without the newly implemented modules is applied in transient climate change exper i-ment ov r th tudy region. Th climate change exp rim nt ar u d to asses the impact of lake-river-atmosphere interactions and of interflow on projected changes as well as the impact of climate change on the e proces e (Que tion 3 abov ). Thi work is pr ent d in th form of an articl that has b en ubmitted
ANALYSIS OF STREAMFLOW CHARACTERISTICS OVER TQRTHEASTERN CA TADA I A CHANG! G CLIMATE
This chapter i pre ented in th format of a scientific article that has been pub-lished in the peer-reviewed journal Climate Dynamics. The design of the research and its performance togeth r with the analy i of data and th redaction of this article are entirely bas d on my work, with the co-authors involved in the super-vi ion of all these task . The d tailed reference i :
Huziy, 0., Sushama, 1., Khaliq, M., Laprise, R., Lehner, B. et Roy, R. (2013). Analysi of streamfiow characteristics over northeastern Canada in a changing climate. Climate Dynamics, 40(7-8), 1879-1901. http://dx.doi.org/10.1007/ s00382-012-1406-0
Ab tract
An analysis of streamflow characteristics (i.e. mean annual and seasonal flows and extreme high and low flows) in curTent and future climates for 21 watershed of northeastern Canada covering mainly the province of Quebec is presented in this article. For the analysis, streamflows are derived from a 10-member ensemble of Canadian Regional Climate Model (CRCM) simulations, driven by the Cana-dian Global Climate Model simulations, of which five correspond to the current 1970-1999 period, while the other five correspond to the future 2041-2070 period. For developing projected changes of streamflow characteristics from current to future periods, two different approaches are used: one based on the concept of
en-emble averaging while the other approach is based on merged samples of currcnt and similarly future simulations following multiple comparison tests. Verification of the CRCM simulated streamflow characteristics for the 1970-1999 period sug-gests that the model simulated mean hydrographs and high flow characteristics compare well with those observed while the model tend to underestimate low flow extremes. Results of projected change to mean annual treamflow suggest statistically significant increases nearly all over the study domain, while tho e for seasonal streamflow show increasesjdecreases depending on the season. Two-and five-year return lev ls of 15-day low flows are projected to increase signifi-cantly over most part of the study domain, although the change are mall in absolute terms. Based on the en mbl averaging approach, changes to 10- and 30-year return levels of high flows are not generally found significant. However, when a imilar analysis is performed using longer sample , significant increases to high flow return level are found mainly for northernmost watersheds. This study highlight the n d for longer ampl particularly for extrem events in the development of robust projection .
K ywords: Climate change; Extreme flows; Regional climate modelling; Statistical analysis
1.1 Introduction
Reliable information about variou str amftow charact ri ti in a hanging
li-mate i critical for planning of adaptation mca ure parti ularly for th nergy and agriculture sectors. According to the Fourth Assessment Report (AR4) of the Intergovernmental Panel on Climat hang (IPCC) (2007) global rn an precip-itation and vaporation rates are projected to increase in a future climate, or in
other words an intensification of the global hydrological cycl is to b expected in a future warmer climate. Howev r there will be important regional differences in
change to precipitation and evaporation. Held and Soden (2006), bas d on th ir
analy is of the coupl d climate models that participated in the AR4, suggests that the poleward vapour tran. port and the pattern of evapotran piration mi-nu pr cipitation will increase proportionally to the lower-troposphcric vapour if the lower-tropospheric r lative humidity and flow is assumed unchanged. In other words, the cm-rent wet (dry) regions i.e. region where precipitation (evaporation) xc d vaporation (pr cipitation), will become wetter ( dri r) in a future climate. ortheastern Canada, the region con ider d in this study, ha an x e of precip-itation over evaporation with mean annual precipitation of the order of 800 mm according to the 19 0-2010 normal ba ed on the Global Precipitation Climatol-ogy Centre (Rudolf et al., 2010), and averag annual vaporation of the arder of 200 mm according to the 1980-2010 normals calculated u ing th European Centre for Medium-Range Weather Forecast (ECMWF)' ERA interim reanalysis data (B rri ford t al. 2009). According to th Global Climate Model (GCM )
partic-ipating in AR4 (IPCC, 2007) the mean annual precipitation rate for this region is projected to increase by 0.4-0.5 mm·day-1, while mean annual vaporation and runoff increase by 0.1-0.2 mm·day-1 and 0.1-0.3 mm·day-1, respectively in the future 20 0-2099 period with resp ct to th 1980-1999 period. Thi northeastern part of anada with its large number of hydroelectric power g neration station plays a very important role in th onomy of th provin s locat d in the region, particularly the provinc of Quebec. Th refore information on proj cted change to various streamftow characteristics and associated uncertainti would be ben-eficiai for better management of these m ga-projects, including the "Plan Nord" recently initiat d by the Governm nt of Quebec (http:/ jplannord.gouv.qc.ca).
The conventional approach to study projected changes to streamflow is based on hydrological madel driven by climate madel outputs for various scenarios. Few studies so far have looked at streamflow directly from climate models: Global Cli-mate Madel (GCMs) and Regional Climate Models (RCMs). RCM and GCMs, with th ir complet cio ed water budget including bath the atmospheric and land surface branches, are ideal tools to understand better the linkages and feedback between climate and hydrological y tem , and to evaluate the impact of climat change on streamfl.ows. RCMs offer higher spatial resolution than GCMs, allow-ing for greater topographie complexity and finer-scale atmospheric dynamics to be simulated and thereby representing a more adequate tool for generating the information required for regional impact studies. In a number of recent stud-ies, RCMs have been used to tudy projected changes to variou components of the hydrological cycle including streamflows (Jha et al., 2004; Wood et al., 2004; Sushama et al., 2006; Kay et al., 2006a,b· Graham et al., 2007a,b; Dad on et al., 2011; Poitras et al., 2011).
In this tudy, climate change impacts on selected streamflow characteri tics for 21 northeast Canadian watersh ds, located mainly in the Quebec province and sorne part of the adjoining Ontario and ewfoundland and Labrador provinces of
Canada, are con idered. A ten-mcmber ensemble of the Canadian RCM (CRCM),
of which five corre pond to the current 1970-1999 period and the other five corre-spond to the future 2041-2070 period, driven by five different members of a Cana-dian GCM (CGCM) initial condition ensemble is used for this purpose. RCM sim-ulations in g neral ar as ociated with everal uncertainties including structural uncertainties associated with regional madel formulation, uncertainties associated with th lateral boundary conditions from the driving GCM, emi ion cenario , as well as the RCM s own internai variability. de Elia et al. (2008) quantified sorne of th uncertainties using larger CRC tl ensembles. Although it i very desirable to as e s th various sources of uncertainti sin streamflow projections as in Arn ll (2011) and Kay et al. (2009), giv n the nature of the ensemble used in this study it i not po ible to address or quantify all uncertainties since the simulation con idered her have b en performed with th same madel and configuration for one SRES (Special Report on Emissions Scenario) scenario. However, it can be us d to quantify uncertainty associated with the natural variability of the driving
ame of the watershed Abbreviation Area (km2)
1 Arnaud AR 26,872
2 aux Feuilles FEU 42,068
3 aux Mélèzes MEL 40,624
4 Caniapiscau CA 37,566
5 Caniapiscau (Pyrite) PYR 48,431
6 Grande Rivière de la Baleine GRB 34,314
7 Baleine BAL 29,896
8 Gorge GEO 24,159
9 Churchill Fall CHU 69,632
10 La Grande Rivière LGR 140,374
11 Natashquan NAT 15,468 12 Romaine ROM 13,212 13 Moisie MOI 19,101 14 Manicouagan MA 29,343 15 Rupert RUP 41,115 16 Bell BEL 22,238 17 Saint Maurice STM 42,843 18 Ottawa RDO 143,241 19 Saguenay SAG 72,678
20 Bersimis-Ou tardes-Manie BOM 87,511
21 Waswanipi WAS 31,691
Table 1.1: Description of 21 watershed used in the study
GCM and the internai variability of th RCM combin d.
For the northeast Cru1adian region considered in this work, no study has so far addressed projected changes to streamflow characteristics for all the 21 watersheds in a systematic way as pre ented in this study. Som tudies focusing on individ-ual watersheds in this northeast r gion of Canada such as Dibik and Coulibaly (2007), Quilbé et al. (2008), Minville et al. (2008, 2009), among others, ba edon hydrological models driven by temperature and precipitation data from climat mod 1 , are available. Recently Frigon et al. (2010) tudied projected changes to mean annual runoff for the same region considered in this study and suggested increases in runoff in future climate for the northern part of the region. The main value of thi work is in the detailed statistical analysis of mean annual, seasonal and extreme (low /high) flows and their as ociated uncertainties and timings of
extreme flows topic that were not covered by earlier studies for this area in the context of a changing climate.
The article is organized a follows: cl scription of the CRCM and imulations are pr sented in Section 1.2 and methodology i pre ented in Section 1.3. Evalua-tion of the CRCM simulated streamflow and assessment of proj cted change to selected but important streamflow characteristics using two approaches are pre-sented in Section 1.4 followed by conclusions in section 1.5.
1.2 Model and experiments
The streamfiows considered in this study are simulated by the fourth generation of the CRCM (de Elia and Côté, 2010). The CRCM is a limited-arca nested model based on the fully elastic non-hydrostatic Euler equation , olved with a semi-implicit and semi-Lagrangian scheme. Vertical resolution is variable with a Gal-Chen scaled-height terrain following coordinate (29 lev l , with model top at 29 km) (Gal-Chen and Somerville, 1975). The CRCM lateral boundary condi-tions are provided through a one-way n sting rn thod inspired by Davie (1976) and refined by Yakimiw and Robert (1999). The subgrid-scale parameterization package is mostly based on the Canadian GCM Ver ion III (CGCM3.1), exc pt for th moi t onv ctiv adju tment sch me that follow Bechtold-Kain-Fritsch's parameterization (Bechtold et al., 2001). The land surface scheme is the Cana-dian LAnd Surface Scheme (CLASS), ver ion 2.7 (Verseghy 1991, 1996). This ver ion of CLASS uses three oil layers, 0.1 rn, 0.25 rn and 3.75 rn thick, corre-sponding approximately to the depth influenced by the diurnal cycle, the rooting zon and the annual variations of t mperature r sp ctively. CLASS includes progno tic equation for energy and water conservation for the three soil layers and a thermally and hydrologically di tinct nowpack wh r applicable (treated as a fourth variable-depth layer). The thermal budg t is performed over the three soillayers, but the hydrological budget i don only for layer above the bedrock. Vegetation canopy in CLASS i tr at cl explicitly with prop rti bas cl on four vegetation types: coniferous trees, deciduous trees, crops and grass. Vegetation canopy can interc pt rain and snow precipitation and has its own energy and water treatment with progno tic variable for canopy temperature, water torage
and ma . CLASS adopts a pseudo-mosaic approach and divides each grid-cell
into a maximum of four sub-areas: bare sail, v getation, now over bare oil and
snow with vegetation. The energy and water budget equations are first solved for
each sub-area separately and then averag d over the grid-cell.
As already rn ntioned, a 10-member CRCM ensemble is considered in thi stucly. Of the 10 members five correspond to the current 1970-1999 period while the other five are the matching pairs of simulations for the future 2041-2070 p riod. Five different members of a CGCM initial condition ensemble were used to driv the five CRCM current and future simulations: It should b noted that the future
climate simulations correspond to IPCC's SRES A2 cenario (high population,
low economy and low technology) and current elima te simulations correspond to the twentieth-century climate (20C3M) scenario. The above current and future
CRC il simulations will be referred to as Cl-CS and Fl-F5, respectively. In a d-dition, another CRCM simulation clriven by the ECMWF' Re-Analysis (ERA40;
U ppala et al., 2005) is also consiclered. Thi imulation will be referrecl to as
'control simulation' hereafter. A sugg t cl by IPCC (2001), the tudy of RCM
simulations nestecl by anal y i of observations or so-called p rfect' boundary con
-ditions such as ERA40 can reveal RCM 'performance errors'. Therefore, the
streamfiows from the control simulation are compared to those obs rved to assess
the CRCM s performan e. The inset of Fig. 1.1 how the CRCM simulation domain, which con ists of a 200 x 192 points gricl covering all of North America and acljoining ocean , with a horizontal grid-point spacing of 45 km. It shoulcl be notecl that the current stucly focu e only on the 21 water hecl locatecl in the
northeastern part of the imulation domain (Fig. 1.1).
Streamfiow is generated from CRCM simulated runoff u ing a modified version of the routing madel WATROUTE (Sauli et al., 2000). The routing sch me salves the water balance equation at each grid-cell, and relates the water storage to out-flow from the grid-cell, using Manning's equation. The modifiecl scheme includes a groundwater reservoir, which is modelled as a linear reservoir as propo ecl in Lucas-Picher et al. (2003) and Su hama et al. (2004). Flow directions, chann 1 lengths and slopes requirecl by the routing scheme were clerivecl from the H
(a)
Figure 1.1: (a) Study domain with it along with the flow directions. Water heds are marked using their abbreviat d nam (Tabl 1.1). imulation do-main of the RC 1 is hown in the inset. (b) Location f th gauging ta ion ( r d triangles) used in th valuation f RCivi imulatecl streamflow characteristics.
latitud -longitude grid. These data were up-scaled and projected to the madel'. grid and r solution. The up-scaling algorithm is based on the one cl veloped by Doll and Lehner (2002). The flow directions thus derived are also shawn in Fig. 1.1.
1.3 Methodology
Verification of CRCM-simulated mean hydrological regime and characteristic of xtreme flow events, i.e. timing and return levels of selected return periods, and
their projected changes in future climate ar considered in this study. For verifi-cation purposes, model-simulated streamflow characteristics from the control s im-ulation are compar cl to those observed, derived from the daily streamflow dataset
from CEHQ (Centre d'expertise hydrique du Québec; http:/ jwww.cehq.gouv.qc.ca/) at selected gauging stations. The location of the gauging stations considered in the study is shawn in Fig. 1.1b. The duration of the data available at these gauging
stations, within the period of interest, i.e. 1970-1999, varies from 10 to 20 y ars. ash-Sutcliffe (ns) index (Nash and Sutcliffe, 1970) and correlation coeffi ient
(r) (Walpole and Myers, 1985) are used to compar the ob erved and modelled daily mean hyclrographs at the e stations. In addition, bia es in the timing and magnitude of p ak flows are explored and connections established with those in
temperature and now water equivalent (SWE) wh r applicable.
The Generalized Extr rn Value (GEV) distribution is usecl to compute return levels of extreme (high and low) flow events. A high (low) flow event is defin cl a the maximum (minimum) 1-day (15-day) flow occurring over the March to July (January to il.ay) periocl. Ten- and 30-year return period are consider cl for high flows, while 2- and 5-year return periods are considered for low flows. Th choice
of smaller return periods for low flows is based on the fact that a hyclrological drought of 2-year r turn period is catastrophic enough to have an adverse impact not only on the hydropow r ctor, but also on the eco ystem, particularly th aquatic life (Smakhtin, 2001). Th cumulative distribution function of the GEV distribution is given by:
where the extreme flow z is such that 1
+
Ç(z -p,)
/
Œ
>
0, and p,, Œ and Ç are respectively the location, scale and shape param ters.Full range of properties and sorne common applications of the GEV distribu-tion are de cribed in Cales (2001). There are several rn thods that are often used for parameter estimation of this distribution: Probability Weighted iloments (PWM) (Hosking et al., 1985), 1-moments (Hosking, 1990), Maximum Likelihood (ML), Generalized Maximum Likelihood (GML) (Martins and Steding r, 2000) and mixed methods (Ailliot et al., 2011). One of th advantages of the GML and ML is that the fitted data automatically belong to the domain of d finition of the obtained probability density function, which i not guaranteed by other methods. However, the ML method perfor·ms poorly for small samples (Stedinger et al., 1993).
To estimate parameters p,, Œ and Ç of the GEV distribution, the GML approach proposed by Martin and Stedinger (2000), but u inga uniform prior distribution for the shape parameter Ç as in Ailliot et al. (2011), is used. Knowing the param-eters of the GEV distribution low-flow return level for a given return period T
(in years) is estimated using the relationship
G(
z
)T
= 1,
as(1.2)
For high flows, a return level i estimated using the relationship [1- G(z)] T = 1, a
z(T,J',Œ,Ç) =
f
[(tnT~
Ir
-
Il
+
l'
(1.3)Projected changes to mean annual, seasonal and extreme flows are assessed for the 2041-2070 period with respect to the CUITent 1970-1999 period. Thi is achieved by comparing statistics of interest deriv d from the F1-F5 simulations with the corresponding statistics deriv d from the C1-C5 simulations. Projected chang s to seasonal streamflows are linked with projected changes in seasonal temper-ature, precipitation and SWE, where possible. In th a sessment of projected changes to mean, seasonal and xtreme flows, two approaches are adopted. In
the first approach proj cted change based on each pair of the five CRCM cm-rent and future simulations are estimated, which are then averaged to obtain the en emble-averaged projected change. In the second approach, based on the statistical evidence provid d by the multiple comparison tests, i .. the Kruskal-Walli t t (Walpole and fyers, 1985) and ranksum test (Walpole and Myers, 19 5) combined with th Fal e Di covery Rate (FDR) approach of Benjamini and Hochberg (1995), the five simulations for the CUITent climate are merged to create a longer sample for ach grid-cell. The am procedure is followed for the future climate. The projected changes ar then asses ed from the merged current and future p riod longer ampl s. Similar approaches have been u d in May (2008) to a e projected changes to extreme precipitation events and characteristics of w t and dry spell over Europe. The advantage of this second approach over the first one is reduced uncertainty associated with extreme flow return levels due
to
larger sample size. Une rtainti s due to small r ample sizes could be substantial for extreme flow return l vel (Stedinger et al., 1993).
Statistical significance of projected change to mean annual and seasonal flows and selected return levels of extreme (high and low) flows are assessed using the nonparam tric vector bootstrap r ampling method (Eh·on and Tibshirani, 1993; GREHYS, 1996; Khaliq
t
al., 2009) to estimat standard error and assuming normali ty of these statistic to develop confidence intervals (Hallt
al., 2004; Mladjic t al., 2011), as discussed below. For a given sample of flows at a grid-cell, the 95o/c confidence interval for a statistic (i.e. mean annual and seasonal flow or a return level) is calculat da : RO±
1.96SE where ROis the sample statistic and SE is th standard error of the statisti timated using 1000 bootstrap re amples. Such confidence int rvals for selected return levels and mean annual and seasonal flows are calculated for each grid-point for both future and current climates. The statistical significance of the difference betwe n the future and current period values is assessed using these confidence intervals. The change (positive/negative) is considered significant if, for a given case, these confidence intervals do not ov rlap. The Student's t-te t (Walpole and Myers, 1985) is also u d to test the statistical significance of the difference between the current and future period mean annual and seasonal flows. For the cas of ensemble averaged statistics, ensemble averaged tandard rrors are usedto
develop confidence intervals.Confidence in the CRCM projections is assessed on the basis of the spread of projected changes obtained with the five pairs of currentjfuture simulations, rep-resented here by the co fficient of variation (CV), defined as the ratio of the stan-dard deviation to the ensemble-mean change based on the five pairs of CRC t1 simulations. Small (large) values of CV are suggestive of high (low) confidence level in the CRCM proj ction ·. Given the nature of the CRCM ensemble, the spread in the CRCM projected changes computed
as
discussed above will refl.ect the part of the uncertainty as ociated with the natural variability of the CGCM3.1 and CRCM's own internai variability.1.4 Results
1.4.1 Model v rification
The observed and modelled hydrographs (mean daily str amfl.ows) are compared at selected stations in Fig. 1.2. Modelled hydrographs are derived from the CRCM's control simulation. For sorne basins, important differences can be noted both in the magnitude and timing of peak fl.ows, which are refl.ected in the ns and r values shown in Fig. 1.2. The e differences can be partly explained by the biases associat d with the temperature and precipitation and therefor in the. now water equivalent (SWE) in the CRCM control simulation (Fig. 1.3). The biases in the winter (DJF) SWE are estimated by comparing climatologi winter SWE from CRCM's control simulation with that from the gridded North American SWE data from Brown t al. (2003). The ob ervational datas t (Brown et al., 2003) was produced by applying th snow depth analysis scheme developed by Brasnett (1999) to generate a 0.3° latitude/longitude grid of daily and monthly mean now depth and corresponding timated water equivalent for North Am rica. This ob-servational datas t was produced for th 1979-97 period and therefore Fig. 1.3a pre nts validation of climatologie SWE for the 1979-97 DJF p riod, common to bath simulated and ob erved datas t . Th pring (MAM) temp rature biases presented in Fig. 1.3b are e timated by comparing 1970-1999 MAM temperature climatology from CRC il control simulation with that from the gridded Climatic Research Unit (CRU2; Mit heU and Jones, 2005) analyzed data.
![Figur 1.1: Study region with basins of inter ~s t , topography [ rn] and lake](https://thumb-eu.123doks.com/thumbv2/123doknet/2926242.76957/29.908.177.758.546.946/figur-study-region-basins-inter-topography-rn-lake.webp)