HAL Id: hal-00085484
https://hal-insu.archives-ouvertes.fr/hal-00085484
Submitted on 20 Sep 2006
HAL is a multi-disciplinary open access archive for the deposit and dissemination of sci-entific research documents, whether they are pub-lished or not. The documents may come from teaching and research institutions in France or abroad, or from public or private research centers.
L’archive ouverte pluridisciplinaire HAL, est destinée au dépôt et à la diffusion de documents scientifiques de niveau recherche, publiés ou non, émanant des établissements d’enseignement et de recherche français ou étrangers, des laboratoires publics ou privés.
Experimental determination of coexisting iron–titanium
oxides in the systems FeTiAlO, FeTiAlMgO,
FeTiAlMnO, and FeTiAlMgMnO at 800 and 900°C, 1–4
kbar, and relatively high oxygen fugacity
Bernard W. Evans, Bruno Scaillet, Scott M. Kuehner
To cite this version:
Bernard W. Evans, Bruno Scaillet, Scott M. Kuehner. Experimental determination of coexisting iron– titanium oxides in the systems FeTiAlO, FeTiAlMgO, FeTiAlMnO, and FeTiAlMgMnO at 800 and 900°C, 1–4 kbar, and relatively high oxygen fugacity. Contributions to Mineralogy and Petrology, Springer Verlag, 2006, 152, pp.2, 149-167. �10.1007/s00410-006-0098-z�. �hal-00085484�
Experimental determination of coexisting iron–
titanium oxides in the systems FeTiAlO, FeTiAlMgO,
FeTiAlMnO, and FeTiAlMgMnO at 800 and 900°C, 1–
4 kbar, and relatively high oxygen fugacity
Bernard W. Evans1 , Bruno Scaillet2 and Scott M. Kuehner1
(1) Department of Earth and Space Sciences, University of Washington, Box 351310, Seattle, WA 98195-1310, USA
(2) Institut des Sciences de la Terre d’Orléans, UMR 6113 CNRS-UO, 1a rue de la Férollerie, 45071 Orleans Cedex 2, France
Abstract
A synthetic, low-melting rhyolite composition containing TiO2 and iron oxide, with further
separate additions of MgO, MnO, and MgO + MnO, was used in hydrothermal experiments to crystallize Ilm-Hem and Usp-Mt solid solutions at 800 and 900°C under redox conditions slightly below nickel–nickel oxide (NNO) to units above the NNO oxygen buffer. These experiments provide calibration of the FeTi-oxide thermometer + oxygen barometer at conditions of temperature and oxygen fugacity poorly covered by previous equilibrium experiments. Isotherms for our data in Roozeboom diagrams of projected %usp vs. %ilm show a change in slope at ≈ 60% ilm, consistent with the second-order transition from FeTi-ordered Ilm to FeTi-disordered Ilm-Hem. This feature of the system accounts for some, but not all, of the differences from earlier thermodynamic calibrations of the thermobarometer. In rhyolite containing 1.0 wt.% MgO, 0.8 wt.% MnO, or MgO + MnO, Usp-Mt crystallized with up to 14% of aluminate components, and Ilm-Hem crystallized with up to 13% geikielite component and 17% pyrophanite component. Relative to the FeTiAlO system, these components displace the ferrite components in Usp-Mt, and the hematite component in Ilm-Hem. As a result, projected contents of ulvöspinel and ilmenite are increased. These changes are attributed to increased non-ideality along joins from end-member hematite and magnetite to their respective Mg- and Mn-bearing titanate and aluminate end-members. The compositional shifts are most pronounced in Ilm-Hem in the range Ilm50–80, a solvus region where the chemical potentials of the hematite and ilmenite
components are nearly independent of composition. The solvus gap widens with addition of Mg and even further with Mn. The Bacon–Hirschmann correlation of Mg/Mn in Usp-Mt and coexisting Ilm-Hem is displaced toward increasing Mg/Mn in ilmenite with passage from ordered ilmenite to disordered hematite. Orthopyroxene and biotite crystallized in experiments with added MgO and MgO + MnO; their X Fe varies with and T
consistent with equilibria among ferrosilite, annite, and ferrite components, and the chemical potentials of SiO2 and orthoclase in the liquid. Experimental equilibration rates increased in
Introduction
In this paper we shall conserve space by using abbreviations for minerals and phase-components following Lindsley (1991, Table 1): for example, Usp for ulvöspinel, Usp-Mt for ulvöspinel-magnetite solid solutions, and usp and mt for the ulvöspinel and magnetite components of spinel.
Table 1 : Microprobe analyses of glass starting compositions
Composition (wt.%) I II III IV SiO2 74.2 71.1 73.5 73.4 TiO2 1.36 1.34 1.30 1.24 Al2O3 11.06 12.39 11.48 11.38 Fe2O3 4.03 4.26 4.01 3.68 FeO 1.56 1.65 1.55 1.41 MnO 0.01 0.13 0.81 0.83 MgO 0.00 1.01 0.03 1.03 Na2O 3.02 2.65 2.43 2.33 K2O 4.25 4.55 3.96 4.25 Total 99.49 99.08 99.07 99.55
FeO = 0.3 × total Fe (see text)
The FeTi-oxide thermometer + oxygen barometer of Buddington and Lindsley (1964) has had unparalleled success as a petrogenetic indicator in natural igneous systems. Derived temperatures and oxygen fugacities have supplied critical constraints for a variety of important issues: magma source regions and their redox states, igneous fractionation paths, equilibria and speciation in volcanic gases, solubilities, igneous mineralogy, and so on. Published applications of the thermobarometer have mostly concerned systems with redox states between those defined by the iron-wüstite and NNO solid oxygen buffers. In these cases, an Usp-Mt solid solution coexists with an Ilm-Hem solid solution that contains more than 85% of the ilm component, thereby occupying a part of composition—
space well covered by the laboratory phase-equilibrium brackets used for calibration.
More oxidizing conditions open composition space to less titaniferous Mt and
to more hem-rich Ilm and ilm-rich Hem, and involve passage across the transition curve for the coexistence of the long-range, partially FeTi-ordered and the long-range disordered structures (e.g., Harrison et al. 2000a). Because of the extrapolation required, Andersen and Lindsley (1988) expressed strong reservations about use of their formulation of the thermobarometer outside the range of calibration (NNO and below), although the QUILF software (Andersen et al. 1993) provides the user access to it. The other formulation currently
in use (Ghiorso and Sack 1991) in principle accommodates a broader range of compositions, including minor constituents, but it suffers similarly from the paucity of direct experimental brackets for FeTi-oxides equilibrated at
The crystallization products of more oxidized magmas, notably those found in magmatic arcs, include FeTi-oxides with compositions outside the range of experimental calibration. As we pointed out earlier (Evans and Scaillet 1997), application of both the Andersen and Lindsley (1988) and Ghiorso and Sack (1991) formulations of the thermobarometer under these higher conditions can give estimates of that are too high and temperatures (depending on the range of ) both too high and too low. These problems stem from shortcomings in the calibration of the thermobarometer both in the simple system FeTiO and in more complex systems containing for example Mg, Mn, and Al.
Extension of the thermodynamic calibration to more oxidizing conditions requires sets of end-member and solution properties that satisfactorily reproduce the compositions of coexisting spinel and rhombohedral oxide solid solutions determined in the laboratory under controlled conditions of temperature, pressure, and Especially important is appropriate provision for the thermodynamic consequences of long-range order in Ilm-Hem, including the accurate location of the order–disorder transition. Furthermore, the presence of additional components greatly increases the matrix of on-site or molecular interaction parameters that need to be known with some reliability, especially in the spinel phase. Each additional component induces unique shifts in the Fe- and Ti-contents of the oxides that cannot be ―corrected‖ by means of simple projections, although much of this has been done in the past. To calibrate the effect of these compositional extensions, we need well-controlled and characterized experiments performed at high oxygen fugacities over a range of temperatures. We present here the results of hydrothermal experiments at 800 and 900°C designed to calibrate the FeTi-oxide thermobarometer in the redox range ΔNNO = − 0.4 to + 3, where ΔNNO is the calculated of the experiment, minus that of the NNO oxygen buffer at the same temperature. We take advantage of the fact that the crystallization products of natural volcanic liquids or their synthetic liquid equivalents, held for 1–2 weeks at elevated pressures and temperatures of 800–900°C under H2O-saturated conditions, consist of
assemblages of crystals whose textural relations and generally homogeneous compositions reflect equilibration with each other and the surrounding liquid (Pichavant 1987; Holtz et al.
1992; Scaillet et al. 1995). The FeTi-oxides crystallized in our experiments all contain some
Al2O3 derived from the synthetic liquid. We also examined the effect of minor components on
the FeTi-oxide compositions by separately adding MgO, MnO, and MgO + MnO to our charges.
In a complementary study, Lattard et al. (2005) provided new experimental data for the Fe–Ti oxide thermo-oxybarometer in the system Fe–Ti–O at 1 bar, 1,000, 1,100, 1,200, and 1,300°C, and a wide range of oxygen fugacities. These data will be added to ours and to previous experimental brackets in a thermodynamic formulation in preparation (Ghiorso et al.
Experimental methods
To promote the diffusion of components within our charges and to maximize the percentage of melt, we chose as starting material a synthetic glass with the composition of a minimum-melting, H2O-saturated rhyolite. Under the T and P conditions chosen, this composition
eliminates any possible crystallization of quartz, K-feldspar, plagioclase, Ca-clinopyroxene, and hornblende. The iron–titanium oxides in our experiments crystallize from the liquid (e.g., Scaillet and Evans 1999) rather than by the slower process of alteration of oxide phases already present in the starting materials.
The minimum-melting rhyolite composition was prepared using a classical gel method. Four compositions of starting material (Table 1) were then prepared by adding (by weight): I—5% FeO (as the nitrate) and 1.3% TiO2 (as ammonium titanyloxalate), II—a further 1% MgO (as
nitrate), III—instead of MgO, a further 0.8% MnO (as carbonate), and IV—a combination of 1% MgO and 0.8% MnO. After drying and firing to eliminate the excess C and N, the gels were melted twice at 1,400°C for 3–4 h in air atmosphere to obtain a dry glass. Table 1 shows that glass II is poorer in SiO2 and richer in Al2O3 than the other three; this was unintended and
we think caused by a weighing error. Analyses for FeO in glass I and in other synthetic rhyolite glasses prepared at CNRS Orléans in a similar manner indicate a ratio of 0.3 for Fe2+/total Fe; this proportion has been incorporated in the microprobe data listed in Table 1.
Charges plus excess H2O were held in sealed Au tubes 15 mm long, 2.5 mm in diameter, and
0.2 mm in wall thickness. Experiments of 5–28 days duration (Table 2) were performed at 800°C in a cold-seal pressure vessel (CSPV) and at 800 and 900°C in an internally heated pressure vessel (IHPV), both equipped with a Shaw-type semi-membrane for the control of H2
pressure (Scaillet et al. 1992). Capsules containing the four compositions were run simultaneously. Total pressure was monitored by transducers calibrated against a Heise Bourdon tube gauge, with an uncertainty of ±20 bars. Temperature was measured by type-K thermocouples calibrated against the melting point of NaCl, with an overall uncertainty of ±5°C for the IHPV and ±8°C for the CSPV. Run temperatures were reached in about 20 min, after which crystals grew at constant temperature, pressure, and Experiments were terminated by switching off the power supply (IHPV), or by removing the vessel from the furnace (CSPV) and cooling it with a small fan, in both cases producing a temperature decrease of 400°C in the first 4 min. A drop quench was used when the CSPV was not fitted with a membrane.
Control of oxygen fugacity during the experiments was achieved by adjusting the hydrogen content of the Ar–H2 pressure medium (IHPV) or by direct diffusion of H2 across the
membrane under the experimental conditions (CSPV). The pressure of H2 is known to
±0.1 bars, except for vessels not equipped with a membrane (Table 2), in which case the O2
pressure (±0.5 log units) is an estimate based on several NiPd-sensor measurements in the same vessel over the previous 5 years. The applied hydrogen pressure is registered by the charge within minutes, and the pressure of H2O in the charge (and hence oxygen fugacity)
equilibrates within some hours as H2O diffuses in from the grain boundaries of the finely
ground, fused starting material. Prior to reaching H2O-saturation there may be some formation
of crystal nuclei, but most of these soon dissolve because of the lower liquidus temperatures at H2O-saturation. was calculated from the hydrogen pressure using the MRK-EOS
of Holloway (1987) for the H–O system at the experimental pressure and temperature, together with the dissociation constant of H2O from Robie et al. (1979). The is then
referenced to the NNO buffer (as ΔNNO) after O’Neill and Pownceby (1993). When the H2
pressure is very low (e.g., ≈1 bar), its uncertainty translates into a ±0.2 uncertainty in ΔNNO. Except where specifically noted (in the 800°C experiments), the results of this study are internally consistent when we allow a ±0.2–0.3 uncertainty in the experimental ΔNNO values.
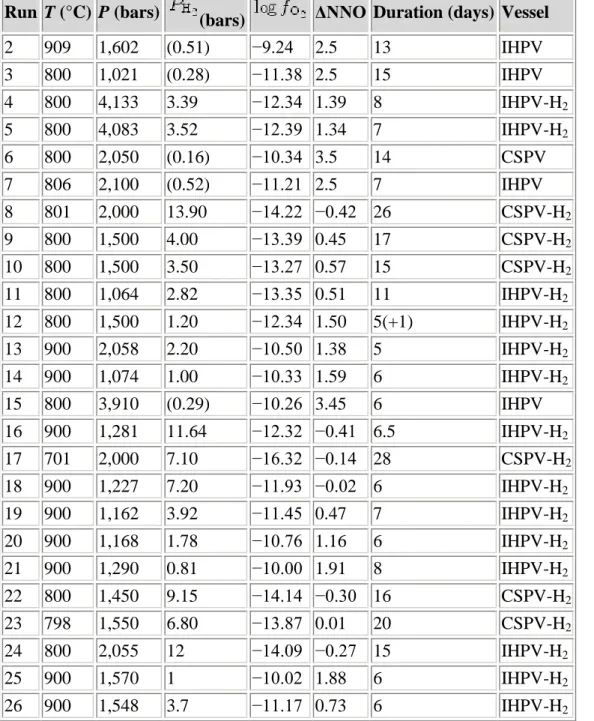
Table 2 : Summary of experimental run conditions
Run T (°C) P (bars) (bars) ΔNNO Duration (days) Vessel
2 909 1,602 (0.51) −9.24 2.5 13 IHPV 3 800 1,021 (0.28) −11.38 2.5 15 IHPV 4 800 4,133 3.39 −12.34 1.39 8 IHPV-H2 5 800 4,083 3.52 −12.39 1.34 7 IHPV-H2 6 800 2,050 (0.16) −10.34 3.5 14 CSPV 7 806 2,100 (0.52) −11.21 2.5 7 IHPV 8 801 2,000 13.90 −14.22 −0.42 26 CSPV-H2 9 800 1,500 4.00 −13.39 0.45 17 CSPV-H2 10 800 1,500 3.50 −13.27 0.57 15 CSPV-H2 11 800 1,064 2.82 −13.35 0.51 11 IHPV-H2 12 800 1,500 1.20 −12.34 1.50 5(+1) IHPV-H2 13 900 2,058 2.20 −10.50 1.38 5 IHPV-H2 14 900 1,074 1.00 −10.33 1.59 6 IHPV-H2 15 800 3,910 (0.29) −10.26 3.45 6 IHPV 16 900 1,281 11.64 −12.32 −0.41 6.5 IHPV-H2 17 701 2,000 7.10 −16.32 −0.14 28 CSPV-H2 18 900 1,227 7.20 −11.93 −0.02 6 IHPV-H2 19 900 1,162 3.92 −11.45 0.47 7 IHPV-H2 20 900 1,168 1.78 −10.76 1.16 6 IHPV-H2 21 900 1,290 0.81 −10.00 1.91 8 IHPV-H2 22 800 1,450 9.15 −14.14 −0.30 16 CSPV-H2 23 798 1,550 6.80 −13.87 0.01 20 CSPV-H2 24 800 2,055 12 −14.09 −0.27 15 IHPV-H2 25 900 1,570 1 −10.02 1.88 6 IHPV-H2 26 900 1,548 3.7 −11.17 0.73 6 IHPV-H2
IHPV-H 2 and CSPV-H 2 internally heated pressure and cold seal pressure vessels fitted with a Shaw
Microprobe analysis of experimental products
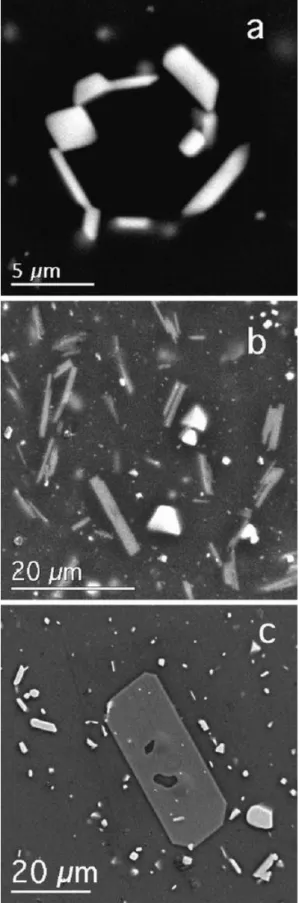
Experimental products consist of crystals of Usp-Mt and Ilm-Hem solid solutions embedded in hydrous synthetic rhyolite glass; compositions II and IV contain orthopyroxene as well in experiments at 900°C, and biotite (composition II) and orthopyroxene (composition IV) in experiments at 800°C. Phases were analyzed with a 4-wavelength spectrometer JEOL 733 Superprobe at the University of Washington. Instrumental conditions were 15 kV accelerating potential, 10 nA beam current, and a finely focused electron beam. In order to minimize overlap of the beam from FeTi-oxide onto the rhyolite glass, extensive use was made during the analysis of Ilm-Hem grains of digital secondary electron images acquired with a GATAN Digital Micrograph for positioning the electron beam.
Usp-Mt formed cube-octahedral crystals 2–10 μm in cross-section (Fig. 1a), and overlap of the analysis volume with glass was successfully avoided for almost all analytical points. Ilm-Hem formed platy crystals typically 1 μm × 5 μm × 5 μm in size, and a correction for glass overlap was necessary for many of the grains analyzed. Our glass correction incorporates a correction for error introduced by the large density contrast (Warren 1997) between FeTi-oxide (ρ = 4.8–5.3) and glass (ρ = 2.3). Without the density correction, contaminated analysis totals exceed 100%. The hydrous rhyolite glass contains on average 74 wt.% SiO2 and
11 wt.% Al2O3. Analyses of Ilm-Hem including more than 10% glass (7.4 wt.% SiO2 after
density correction, but prior to the overlap correction reducing SiO2 to 0) were excluded from
the database.
Analyses were referenced to a library of standards, including four analyzed natural ilmenites and four synthetic compositions along the join FeTiO3–MnTiO3, Elba hematite, and synthetic
and natural rutile. Using the binomial alpha factors (CITZAF) of Armstrong (1988a, 1988b), and a first-approximation estimate of excess oxygen by difference from 100% total, we found for TiO2 that the use of rutile as standard resulted in analyses of our standard ilmenites that
were 1–2% (relative) too high. Similarly, use of the Elba hematite gave analyses of Fe in standard ilmenites that were 1–2% (relative) low. This is further discussed in the Appendix. Use of the PAP instead of the CITZAF correction changed TiO2 and FeO analyses of ilmenite
by 0.2 and 0.1% relative, too small to account for the discrepancies. The final corrected analyses (Tables 3, 4, 5, 6) were optimized to the intensities from the synthetic and natural ilmenites as described in the Appendix.
Figure 1 : Secondary electron scanning images. a Magnetite (two equant grains) and Ilm-Hem (elongate) in experiment 24 at 800°C, b FeTi-oxides (bright) and biotite (gray) in experiment 24, and c orthopyroxene (gray), magnetite (equant, bright), and Ilm-Hem (elongate, bright) in experiment 25
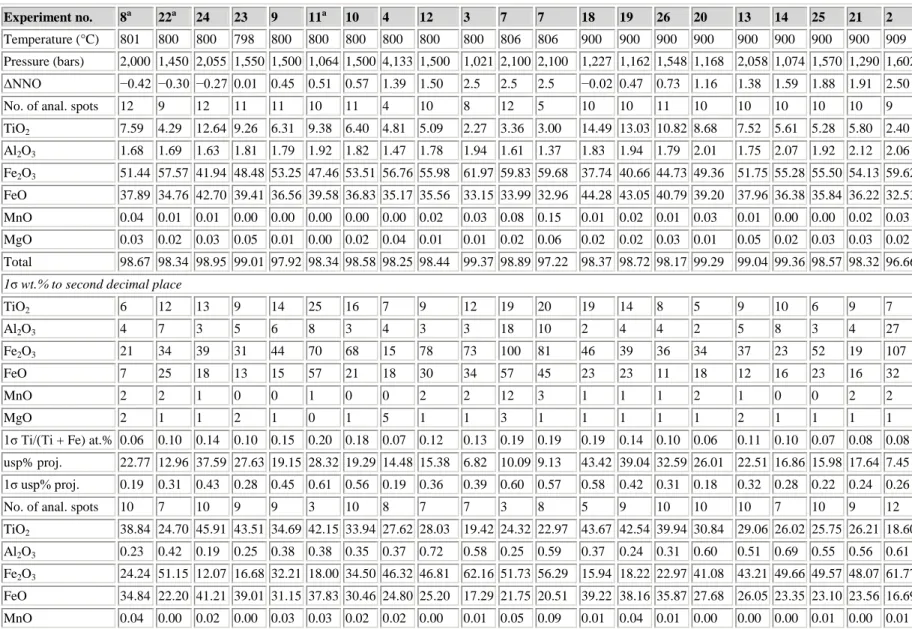
Table 3 : Microprobe analyses (wt.%) of product FeTi-oxides: Usp-Mt above and Ilm-Hem below—composition I
Experiment no. 8a 22a 24 23 9 11a 10 4 12 3 7 7 18 19 26 20 13 14 25 21 2
Temperature (°C) 801 800 800 798 800 800 800 800 800 800 806 806 900 900 900 900 900 900 900 900 909
Pressure (bars) 2,000 1,450 2,055 1,550 1,500 1,064 1,500 4,133 1,500 1,021 2,100 2,100 1,227 1,162 1,548 1,168 2,058 1,074 1,570 1,290 1,602
ΔNNO −0.42 −0.30 −0.27 0.01 0.45 0.51 0.57 1.39 1.50 2.5 2.5 2.5 −0.02 0.47 0.73 1.16 1.38 1.59 1.88 1.91 2.50
No. of anal. spots 12 9 12 11 11 10 11 4 10 8 12 5 10 10 11 10 10 10 10 10 9
TiO2 7.59 4.29 12.64 9.26 6.31 9.38 6.40 4.81 5.09 2.27 3.36 3.00 14.49 13.03 10.82 8.68 7.52 5.61 5.28 5.80 2.40 Al2O3 1.68 1.69 1.63 1.81 1.79 1.92 1.82 1.47 1.78 1.94 1.61 1.37 1.83 1.94 1.79 2.01 1.75 2.07 1.92 2.12 2.06 Fe2O3 51.44 57.57 41.94 48.48 53.25 47.46 53.51 56.76 55.98 61.97 59.83 59.68 37.74 40.66 44.73 49.36 51.75 55.28 55.50 54.13 59.62 FeO 37.89 34.76 42.70 39.41 36.56 39.58 36.83 35.17 35.56 33.15 33.99 32.96 44.28 43.05 40.79 39.20 37.96 36.38 35.84 36.22 32.53 MnO 0.04 0.01 0.01 0.00 0.00 0.00 0.00 0.00 0.02 0.03 0.08 0.15 0.01 0.02 0.01 0.03 0.01 0.00 0.00 0.02 0.03 MgO 0.03 0.02 0.03 0.05 0.01 0.00 0.02 0.04 0.01 0.01 0.02 0.06 0.02 0.02 0.03 0.01 0.05 0.02 0.03 0.03 0.02 Total 98.67 98.34 98.95 99.01 97.92 98.34 98.58 98.25 98.44 99.37 98.89 97.22 98.37 98.72 98.17 99.29 99.04 99.36 98.57 98.32 96.66 1σ wt.% to second decimal place
TiO2 6 12 13 9 14 25 16 7 9 12 19 20 19 14 8 5 9 10 6 9 7 Al2O3 4 7 3 5 6 8 3 4 3 3 18 10 2 4 4 2 5 8 3 4 27 Fe2O3 21 34 39 31 44 70 68 15 78 73 100 81 46 39 36 34 37 23 52 19 107 FeO 7 25 18 13 15 57 21 18 30 34 57 45 23 23 11 18 12 16 23 16 32 MnO 2 2 1 0 0 1 0 0 2 2 12 3 1 1 1 2 1 0 0 2 2 MgO 2 1 1 2 1 0 1 5 1 1 3 1 1 1 1 1 2 1 1 1 1
1σ Ti/(Ti + Fe) at.% 0.06 0.10 0.14 0.10 0.15 0.20 0.18 0.07 0.12 0.13 0.19 0.19 0.19 0.14 0.10 0.06 0.11 0.10 0.07 0.08 0.08
usp% proj. 22.77 12.96 37.59 27.63 19.15 28.32 19.29 14.48 15.38 6.82 10.09 9.13 43.42 39.04 32.59 26.01 22.51 16.86 15.98 17.64 7.45
1σ usp% proj. 0.19 0.31 0.43 0.28 0.45 0.61 0.56 0.19 0.36 0.39 0.60 0.57 0.58 0.42 0.31 0.18 0.32 0.28 0.22 0.24 0.26
No. of anal. spots 10 7 10 9 9 3 10 8 7 7 3 8 5 9 10 10 10 7 10 9 12
TiO2 38.84 24.70 45.91 43.51 34.69 42.15 33.94 27.62 28.03 19.42 24.32 22.97 43.67 42.54 39.94 30.84 29.06 26.02 25.75 26.21 18.60
Al2O3 0.23 0.42 0.19 0.25 0.38 0.38 0.35 0.37 0.72 0.58 0.25 0.59 0.37 0.24 0.31 0.60 0.51 0.69 0.55 0.56 0.61
Fe2O3 24.24 51.15 12.07 16.68 32.21 18.00 34.50 46.32 46.81 62.16 51.73 56.29 15.94 18.22 22.97 41.08 43.21 49.66 49.57 48.07 61.77
FeO 34.84 22.20 41.21 39.01 31.15 37.83 30.46 24.80 25.20 17.29 21.75 20.51 39.22 38.16 35.87 27.68 26.05 23.35 23.10 23.56 16.69
Experiment no. 8a 22a 24 23 9 11a 10 4 12 3 7 7 18 19 26 20 13 14 25 21 2
MgO 0.03 0.01 0.03 0.06 0.01 0.03 0.02 0.01 0.00 0.01 0.03 0.03 0.02 0.03 0.02 0.03 0.05 0.03 0.03 0.01 0.02
Total 98.22 98.48 99.43 99.51 98.47 98.42 99.29 99.14 100.76 99.47 98.13 100.48 99.23 99.23 99.12 100.23 98.88 99.75 99.01 98.41 97.70 1σ wt.% to second decimal place
TiO2 71 16 39 19 39 79 45 41 160 17 42 76 76 64 37 44 32 18 28 24 17 Al2O3 8 3 8 8 11 2 6 7 27 15 13 15 18 3 10 12 17 12 9 7 2 Fe2O3 74 72 65 97 160 34 35 128 283 72 138 101 95 68 29 130 38 72 79 97 72 FeO 66 15 37 19 34 69 42 35 144 12 48 67 68 59 33 39 29 16 25 22 15 MnO 3 0 2 0 2 2 2 2 0 1 5 3 2 1 1 1 0 0 1 0 1 MgO 2 1 1 1 1 1 1 1 1 1 4 4 1 1 1 1 2 1 1 1 1
1σ Ti/(Ti + Fe) at.% 0.25 0.24 0.29 0.40 0.61 0.11 0.18 0.28 1.39 0.19 0.44 0.57 0.29 0.27 0.13 0.25 0.17 0.11 0.14 0.29 0.20
ilm% proj. 76.16 49.10 88.36 83.87 68.25 82.37 66.24 54.34 54.47 38.20 48.31 44.75 84.54 82.32 77.63 59.96 57.26 51.10 50.88 52.14 37.52
1σ ilm% proj. 0.51 0.49 0.36 0.82 1.20 0.17 0.38 0.76 2.78 0.22 1.23 1.12 0.59 0.54 0.24 0.51 0.32 0.22 0.28 0.58 0.41
Proj. projected as described in the text
aΔNNO value unreliable. Analysis totals do not include approx. 0.1% SiO 2
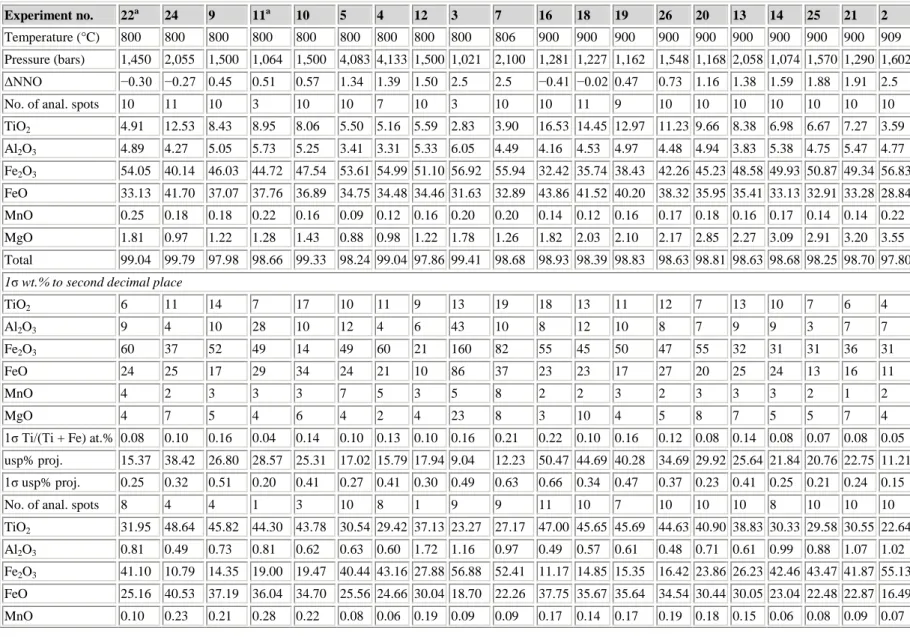
Table 4 : Microprobe analyses (wt.%) of product FeTi-oxides: Usp-Mt above and Ilm-Hem below—composition II
Experiment no. 22a 24 9 11a 10 5 4 12 3 7 16 18 19 26 20 13 14 25 21 2
Temperature (°C) 800 800 800 800 800 800 800 800 800 806 900 900 900 900 900 900 900 900 900 909
Pressure (bars) 1,450 2,055 1,500 1,064 1,500 4,083 4,133 1,500 1,021 2,100 1,281 1,227 1,162 1,548 1,168 2,058 1,074 1,570 1,290 1,602
ΔNNO −0.30 −0.27 0.45 0.51 0.57 1.34 1.39 1.50 2.5 2.5 −0.41 −0.02 0.47 0.73 1.16 1.38 1.59 1.88 1.91 2.5
No. of anal. spots 10 11 10 3 10 10 7 10 3 10 10 11 9 10 10 10 10 10 10 10
TiO2 4.91 12.53 8.43 8.95 8.06 5.50 5.16 5.59 2.83 3.90 16.53 14.45 12.97 11.23 9.66 8.38 6.98 6.67 7.27 3.59 Al2O3 4.89 4.27 5.05 5.73 5.25 3.41 3.31 5.33 6.05 4.49 4.16 4.53 4.97 4.48 4.94 3.83 5.38 4.75 5.47 4.77 Fe2O3 54.05 40.14 46.03 44.72 47.54 53.61 54.99 51.10 56.92 55.94 32.42 35.74 38.43 42.26 45.23 48.58 49.93 50.87 49.34 56.83 FeO 33.13 41.70 37.07 37.76 36.89 34.75 34.48 34.46 31.63 32.89 43.86 41.52 40.20 38.32 35.95 35.41 33.13 32.91 33.28 28.84 MnO 0.25 0.18 0.18 0.22 0.16 0.09 0.12 0.16 0.20 0.20 0.14 0.12 0.16 0.17 0.18 0.16 0.17 0.14 0.14 0.22 MgO 1.81 0.97 1.22 1.28 1.43 0.88 0.98 1.22 1.78 1.26 1.82 2.03 2.10 2.17 2.85 2.27 3.09 2.91 3.20 3.55 Total 99.04 99.79 97.98 98.66 99.33 98.24 99.04 97.86 99.41 98.68 98.93 98.39 98.83 98.63 98.81 98.63 98.68 98.25 98.70 97.80
1σ wt.% to second decimal place
TiO2 6 11 14 7 17 10 11 9 13 19 18 13 11 12 7 13 10 7 6 4 Al2O3 9 4 10 28 10 12 4 6 43 10 8 12 10 8 7 9 9 3 7 7 Fe2O3 60 37 52 49 14 49 60 21 160 82 55 45 50 47 55 32 31 31 36 31 FeO 24 25 17 29 34 24 21 10 86 37 23 23 17 27 20 25 24 13 16 11 MnO 4 2 3 3 3 7 5 3 5 8 2 2 3 2 3 3 3 2 1 2 MgO 4 7 5 4 6 4 2 4 23 8 3 10 4 5 8 7 5 5 7 4
1σ Ti/(Ti + Fe) at.% 0.08 0.10 0.16 0.04 0.14 0.10 0.13 0.10 0.16 0.21 0.22 0.10 0.16 0.12 0.08 0.14 0.08 0.07 0.08 0.05
usp% proj. 15.37 38.42 26.80 28.57 25.31 17.02 15.79 17.94 9.04 12.23 50.47 44.69 40.28 34.69 29.92 25.64 21.84 20.76 22.75 11.21
1σ usp% proj. 0.25 0.32 0.51 0.20 0.41 0.27 0.41 0.30 0.49 0.63 0.66 0.34 0.47 0.37 0.23 0.41 0.25 0.21 0.24 0.15
No. of anal. spots 8 4 4 1 3 10 8 1 9 9 11 10 7 10 10 10 8 10 10 10
TiO2 31.95 48.64 45.82 44.30 43.78 30.54 29.42 37.13 23.27 27.17 47.00 45.65 45.69 44.63 40.90 38.83 30.33 29.58 30.55 22.64
Al2O3 0.81 0.49 0.73 0.81 0.62 0.63 0.60 1.72 1.16 0.97 0.49 0.57 0.61 0.48 0.71 0.61 0.99 0.88 1.07 1.02
Fe2O3 41.10 10.79 14.35 19.00 19.47 40.44 43.16 27.88 56.88 52.41 11.17 14.85 15.35 16.42 23.86 26.23 42.46 43.47 41.87 55.13
FeO 25.16 40.53 37.19 36.04 34.70 25.56 24.66 30.04 18.70 22.26 37.75 35.67 35.64 34.54 30.44 30.05 23.04 22.48 22.87 16.49
Experiment no. 22a 24 9 11a 10 5 4 12 3 7 16 18 19 26 20 13 14 25 21 2
MgO 1.95 1.67 2.13 1.97 2.50 1.02 0.97 1.77 1.20 1.16 2.44 2.94 2.96 3.03 3.45 2.65 2.34 2.27 2.53 2.13
Total 101.07 102.35 100.43 102.40 101.29 98.27 98.87 98.73 101.30 104.06 99.02 99.82 100.42 99.29 99.54 98.52 99.22 98.76 98.98 97.48 1σ wt.% to second decimal place
TiO2 90 58 107 49 109 128 112 86 50 71 59 30 78 51 33 31 32 9 Al2O3 14 9 45 12 11 11 16 24 16 27 15 10 17 12 14 8 9 3 Fe2O3 184 74 220 182 175 125 240 113 73 78 159 33 61 100 150 63 103 37 FeO 66 50 50 38 83 104 88 66 36 61 79 31 72 33 44 25 39 11 MnO 3 3 2 5 2 2 3 3 3 2 3 6 2 2 3 2 3 2 MgO 21 5 38 27 11 6 10 8 10 12 17 2 18 21 22 7 9 4
1σ Ti/(Ti + Fe) at.% 0.91 0.29 0.56 0.50 1.02 0.88 0.39 0.29 0.33 0.25 0.64 0.18 0.21 0.26 0.31 0.17 0.27 0.06
ilm% proj. 57.64 89.30 85.21 80.83 79.84 58.42 55.95 70.54 42.22 48.56 88.25 84.22 83.77 82.38 73.93 71.80 54.67 53.48 54.83 39.93
1σ ilm% proj. 1.59 0.61 1.84 1.54 1.81 1.65 0.64 0.58 0.63 0.60 1.55 0.35 0.80 0.81 1.08 0.33 0.80 0.24
Proj. projected as described in the text
aΔNNO value unreliable. Analysis totals do not include approx. 0.1% SiO 2
Table 5 : Microprobe analyses (wt.%) of product FeTi-oxides: Usp-Mt above and Ilm-Hem below— composition III
Experiment no. 8a 22a 24 23 9 11a 10 5 4 12 3 7 16 18 19 26 20 13 14 25 21 2
Temperature (°C) 801 800 800 798 800 800 800 800 800 800 800 806 900 900 900 900 900 900 900 900 900 909
Pressure (bars) 2,000 1,450 2,055 1,550 1,500 1,064 1,500 4,083 4,133 1,500 1,021 2,100 1,281 1,227 1,162 1,548 1,168 2,058 1,074 1,570 1,290 1,602
ΔNNO −0.42 −0.30 −0.27 0.01 0.45 0.51 0.57 1.34 1.39 1.50 2.5 2.5 −0.41 −0.02 0.47 0.73 1.16 1.38 1.59 1.88 1.91 2.5
No. of anal. spots 9 9 8 9 9 11 10 8 4 10 5 7 10 10 10 10 10 10 10 10 10 10
TiO2 8.53 5.56 13.13 9.78 7.28 9.90 7.24 6.53 6.30 6.35 3.90 4.93 17.17 14.90 13.38 11.71 10.21 8.98 7.59 7.34 7.76 4.10 Al2O3 4.34 4.80 4.07 4.94 4.94 5.29 4.84 3.47 3.26 5.14 6.28 4.47 3.63 3.99 4.30 3.94 4.35 3.65 4.77 4.24 4.86 4.52 Al2O3 46.79 51.49 38.90 43.68 48.36 43.31 48.65 50.17 52.20 49.45 53.13 53.65 30.75 34.74 37.19 40.54 43.48 46.30 48.11 48.55 47.54 54.45 FeO 35.16 31.71 39.66 36.40 33.71 36.22 33.84 33.34 33.23 32.87 29.62 31.79 42.80 40.63 39.17 37.77 36.15 35.53 33.57 33.09 33.53 29.50 MnO 4.21 4.59 4.11 4.06 4.39 4.52 4.24 3.29 3.58 4.21 5.45 4.14 4.26 4.39 4.39 4.14 4.59 3.81 4.79 4.68 4.95 5.28 MgO 0.02 0.10 0.10 0.11 0.10 0.12 0.12 0.05 0.14 0.09 0.12 0.10 0.09 0.09 0.12 0.08 0.12 0.10 0.13 0.12 0.14 0.12 Total 99.05 98.25 99.97 98.97 98.78 99.36 98.93 96.85 98.71 98.11 98.50 99.08 98.70 98.74 98.55 98.18 98.90 98.37 98.96 98.02 98.78 97.97 1σ wt.% to second decimal place
TiO2 3 5 9 16 14 15 8 8 8 7 13 19 19 17 11 5 7 11 4 8 8 4 Al2O3 6 8 9 6 28 42 8 14 16 12 19 11 6 9 4 5 5 5 7 4 7 6 Fe2O3 35 31 22 49 59 182 41 70 24 35 49 95 45 30 28 25 47 25 33 26 28 29 FeO 20 16 16 30 36 70 30 50 12 23 31 27 27 32 25 18 19 18 18 19 16 16 MnO 4 12 5 0 7 13 7 25 14 11 13 11 7 8 12 7 9 5 9 8 11 6 MgO 2 1 1 4 1 1 2 1 6 1 3 4 1 1 2 1 1 1 1 2 1 1
1σ Ti/(Ti + Fe) at.% 0.04 0.06 0.08 0.15 0.09 0.18 0.08 0.10 0.10 0.09 0.11 0.24 0.19 0.13 0.10 0.07 0.12 0.10 0.05 0.08 0.11 0.05
usp% proj. 26.70 17.75 40.28 30.92 23.13 31.36 22.93 20.64 19.43 20.42 12.79 15.52 52.74 46.16 41.83 36.60 31.94 27.94 23.97 23.21 24.60 13.08
1σ usp% proj. 0.12 0.18 0.26 0.45 0.24 0.64 0.23 0.34 0.25 0.26 0.30 0.70 0.56 0.35 0.28 0.19 0.34 0.31 0.13 0.24 0.29 0.15
No. of anal. spots 10 8 9 11 4 4 7 9 7 1 10 8 3 10 10 10 9 10 9 10 10 10
TiO2 44.41 40.46 47.64 46.35 44.30 46.16 42.61 37.33 40.28 40.31 25.09 29.84 47.41 45.45 45.44 44.63 40.76 40.05 33.79 29.26 30.50 22.71 Al2O3 0.27 0.35 0.32 0.33 0.40 0.49 0.45 0.57 0.45 0.73 1.12 0.62 0.38 0.35 0.31 0.34 0.50 0.52 0.80 0.83 0.74 0.93 Fe2O3 14.05 22.28 9.12 11.20 14.40 10.63 17.50 28.30 23.12 22.16 52.61 44.91 9.14 11.10 12.25 13.90 20.93 22.27 35.85 42.21 40.32 53.54 FeO 32.45 28.86 35.88 33.98 32.04 33.68 30.73 28.94 30.38 29.87 19.70 23.49 36.68 34.75 34.30 33.89 30.80 30.91 26.15 23.66 24.39 18.17 MnO 7.20 7.12 6.63 7.32 7.42 7.45 7.28 4.40 5.52 6.07 2.62 3.20 5.69 5.84 6.22 5.87 5.53 4.83 3.96 2.46 2.84 2.09 MgO 0.11 0.18 0.14 0.16 0.16 0.16 0.13 0.04 0.14 0.13 0.12 0.06 0.10 0.12 0.15 0.15 0.14 0.12 0.13 0.09 0.09 0.07 Total 98.49 99.25 99.73 99.34 98.72 98.57 98.70 99.58 99.89 99.27 101.26 102.12 99.40 97.61 98.67 98.78 98.66 98.70 100.68 98.51 98.88 97.51
Experiment no. 8a 22a 24 23 9 11a 10 5 4 12 3 7 16 18 19 26 20 13 14 25 21 2
1σ wt.% to second decimal place
TiO2 38 43 63 83 38 32 48 319 81 34 288 8 79 20 45 78 63 76 34 32 15 Al2O3 6 3 15 9 10 10 13 10 30 25 27 15 10 4 8 14 9 10 8 26 3 Fe2O3 84 109 50 113 90 76 60 567 112 133 470 85 78 48 32 73 62 107 70 71 33 FeO 31 34 45 70 34 35 45 171 55 27 179 6 57 23 43 64 58 61 29 25 16 MnO 21 29 22 24 12 26 13 164 34 15 82 8 19 10 10 14 13 13 4 9 5 MgO 11 1 1 2 2 1 2 35 3 3 5 2 2 5 1 1 2 1 1 2 1
1σ Ti/(Ti + Fe) at.% 0.42 0.64 0.16 0.55 0.370 0.62 0.33 3.20 0.59 0.30 2.68 0.40 0.30 0.23 0.18 0.26 0.20 0.57 0.18 0.23 0.11
ilm% proj. 83.70 74.22 89.74 87.09 83.18 87.57 79.60 69.45 74.49 74.98 45.42 53.76 89.92 87.43 86.16 84.42 76.59 75.52 61.85 55.47 57.35 43.00
1σ ilm% proj. 0.90 0.99 0.74 1.29 0.90 0.73 0.54 5.17 0.88 0.58 4.27 0.85 0.74 0.53 0.37 0.57 0.62 1.13 0.38 0.47 0.30
Proj. projected as described in the text
aΔNNO value unreliable. Analysis totals do not include approx. 0.1% SiO 2
Table 6 : Microprobe analyses (wt.%) of product FeTi-oxides: Usp-Mt above and Ilm-Hem below—composition IV
Experiment no. 22a 24 23 9 11a 10 5 4 7 16 18 19 26 20 13 14 25 21 2
Temperature (°C) 800 800 798 800 800 800 800 800 806 900 900 900 900 900 900 900 900 900 909 Pressure (bars) 1,450 2,055 1,550 1,500 1,064 1,500 4,083 4,133 2,100 1,281 1,227 1,162 1,548 1,168 2,058 1,074 1,570 1,290 1,602 ΔNNO −0.30 −0.27 0.01 0.45 0.51 0.57 1.34 1.39 2.5 −0.41 −0.02 0.47 0.73 1.16 1.38 1.59 1.88 1.91 2.5 No. of anal. spots 9 10 6 6 3 8 9 6 5 10 11 10 10 10 10 9 9 10 10 TiO2 5.67 13.16 9.85 9.11 9.89 8.91 6.68 6.37 5.14 17.50 15.44 14.25 12.02 10.83 9.50 8.26 8.11 8.69 5.02 Al2O3 4.39 4.20 4.79 4.68 5.32 4.81 3.15 3.05 3.92 3.35 3.93 4.14 3.71 4.08 3.38 4.46 3.87 4.43 4.09 Fe2O3 53.11 38.90 44.35 45.03 42.70 46.04 51.29 52.64 54.02 31.22 34.64 36.50 41.12 44.16 46.66 48.13 48.84 47.59 54.48 FeO 30.18 39.81 36.02 34.59 35.57 34.36 32.86 32.59 30.47 42.03 39.80 38.14 36.16 34.23 33.95 31.14 30.89 31.21 26.68 MnO 3.90 2.90 3.11 3.49 3.26 3.56 2.74 2.90 3.82 3.37 3.64 3.68 3.66 4.05 3.41 4.15 4.18 4.39 4.80 MgO 1.72 0.78 1.05 1.02 1.05 1.22 0.94 0.99 1.11 1.37 1.48 1.74 1.61 2.18 1.72 2.42 2.34 2.53 2.74 Total 98.97 99.75 99.17 97.92 97.79 98.90 97.66 98.54 98.48 98.84 98.93 98.45 98.28 99.53 98.62 98.56 98.23 98.84 97.81
1σ wt.% to second decimal place
TiO2 11 13 8 35 4 13 15 14 30 18 16 15 10 9 9 9 8 10 4 Al2O3 4 7 13 18 21 8 10 6 13 5 8 8 4 3 5 9 4 4 4 Fe2O3 52 50 24 45 18 24 58 53 64 30 38 52 36 39 28 36 22 33 37 FeO 23 17 18 69 15 31 37 27 59 22 25 23 20 12 13 16 20 25 17 MnO 15 5 17 11 9 7 19 4 30 6 9 13 5 7 5 7 9 9 8 MgO 5 3 18 5 8 5 6 4 13 4 4 3 3 4 3 4 4 5 3 1σ Ti/(Ti + Fe) at.% 0.13 0.15 0.09 0.22 0.06 0.10 0.16 0.15 0.29 0.16 0.13 0.18 0.12 0.11 0.10 0.10 0.08 0.08 0.05 usp% proj. 17.59 30.74 28.79 31.64 27.89 20.65 19.48 15.98 52.84 47.11 43.83 36.88 32.89 28.92 25.54 24.92 26.74 15.55 1σ usp% proj. 0.35 0.47 0.19 0.60 0.13 0.29 0.49 0.44 0.81 0.47 0.39 0.56 0.32 0.35 0.27 0.28 0.24 0.25 0.15 No. of anal. spots 6 4 4 1 1 2 10 7 12 10 7 2 5 3 4 3 10 6 11 TiO2 42.78 48.67 47.38 46.78 50.29 48.42 41.56 41.97 43.50 48.12 47.41 46.92 46.60 43.22 43.15 41.81 39.55 40.66 24.71 Al2O3 0.42 0.38 0.68 0.72 1.69 0.65 0.44 0.49 1.01 0.31 0.39 0.41 0.58 0.65 0.52 0.46 0.57 0.55 0.83 Fe2O3 21.77 9.75 13.78 13.27 18.73 18.29 22.68 20.57 35.59 8.56 10.99 13.52 14.50 20.48 19.98 24.92 26.17 24.97 52.05 FeO 27.47 37.07 33.93 33.13 35.64 33.80 30.16 29.84 26.93 35.21 34.14 33.02 32.52 28.44 29.89 27.13 25.76 25.99 16.78 MnO 6.02 4.48 5.66 5.71 6.39 6.03 4.27 4.67 7.58 4.54 4.84 4.68 5.16 5.05 4.39 5.01 4.58 5.02 2.08 MgO 2.75 1.22 1.65 1.76 1.74 2.04 1.62 1.78 2.53 1.95 2.01 2.49 2.34 2.98 2.51 3.03 2.90 3.08 1.87 Total 101.21 101.57 103.08 101.37 114.48 109.23 100.73 99.32 117.14 98.69 99.78 101.04 101.70 100.82 100.44 102.36 99.53 100.27 98.32
Experiment no. 22a 24 23 9 11a 10 5 4 7 16 18 19 26 20 13 14 25 21 2 TiO2 29 61 91 36 206 55 724 61 50 34 75 184 38 50 70 29 12 Al2O3 5 11 27 23 18 11 42 8 10 3 29 28 7 8 14 14 4 Fe2O3 135 56 58 11 397 138 962 79 104 43 57 218 102 23 65 90 87 FeO 35 53 80 44 145 76 496 45 28 5 65 207 45 42 69 34 9 MnO 21 6 21 27 37 11 192 18 23 13 13 12 17 14 14 5 4 MgO 12 3 10 22 12 20 27 11 10 7 5 19 3 1 16 11 3 1σ Ti/(Ti + Fe) at.% 0.62 0.25 0.32 0.08 2.22 0.51 5.57 0.51 0.48 0.05 0.29 1.04 0.39 0.21 0.30 0.33 0.19 ilm% proj. 73.72 89.42 84.55 84.73 80.88 80.42 74.72 76.33 62.71 90.14 87.35 84.44 83.29 75.53 76.88 70.76 68.63 69.82 41.74 1σ ilm% proj. 1.31 0.46 0.77 0.11 4.09 1.60 10.41 0.79 1.01 0.40 0.40 3.34 1.03 0.45 0.89 1.01 0.40 Proj. projected as described in the text
aΔNNO value unreliable. Analysis totals do not include approx. 0.1% SiO 2
After assignment of Fe to Fe2+ and Fe3+ based on ideal stoichiometry, analysis totals average 98.7% (including 0.1% SiO2) for Usp-Mt and slightly higher for Ilm-Hem (even after
correction for glass contamination, some totals are high). Analysis of much larger crystals of FeTi-oxides in natural rock samples under identical instrumental conditions generally produced analysis totals close to 100%. From this comparison, we attribute the systematically low analysis totals of Usp-Mt and most Ilm-Hem to the minor loss of Fe and Ti counts that would have been fluorescence-induced by the continuum in larger crystals at distances from the electron-beam impact point greater than about 5 μm. This effect was described by Small et al. (1978), and, for example, can be seen in the analyses of experimental FeTi-oxides in Toplis and Carroll (1995). When possible, at least ten grains of both phases were analyzed on each sample, but in a few cases only one or two acceptable analyses of Ilm-Hem were possible, owing to their small grain-size. Measured standard deviations for each element are listed in Tables 3, 4, 5, and 6. Because of covariation in measured Fe, Ti, and analysis totals, standard deviations tend to be smaller when calculated after any kind of normalization, for example, to an analysis total of 100 wt.%, to atom percent Ti/(Ti + Fe), to projected usp and ilm (Tables 3, 4, 5, 6), or to mole fractions of end-members. Neither low nor high analysis totals nor inadequate correction for contamination by glass had any detectable systematic effect on normalized compositions. Obvious compositional outliers among the analyzed spots (e.g., in Al due to inadequate correction for glass, or in Ti/(Ti + Fe) ratio due to overlap with the other FeTi-oxide) were deleted.
Results
Fourteen experiments were conducted at 800°C, ten at 900°C, and an unsuccessful one at 700°C. FeTi-oxides crystallized at 900°C are homogeneous, with 1σ for Fe/(Fe + Ti) smaller than 0.2% for Usp-Mt, and mostly smaller than 0.5% for Ilm-Hem. In the series of experiments at 800°C, Usp-Mt is as homogeneous as at 900°C, whereas the composition of Ilm-Hem is variable, especially when falling in the range Ilm50–Ilm80. The latter show up in
Tables 3, 4, 5, and 6 as having standard deviations of Fe/(Fe + Ti) in excess of 1.0%, and in our Roozeboom diagrams (below) as having large uncertainties or wide measured ranges. The microprobe analyses of both FeTi-phases always show a minimum of 0.1–0.2 wt.% SiO2,
even in the largest crystals present. This silica is inferred to be present in the structures of the two phases.
Normalization
We recast weight percent microprobe analyses to three oxygens and two total cations for Ilm-Hem and four oxygens and three total cations for Usp-Mt. The rhombohedral phase in our experiments may be expressed with no ambiguity in terms of the mole fractions or percentages of five end-members: Al2O3, FeTiO3, MgTiO3, MnTiO3, and Fe2O3. The spinel
phase can be expressed in terms of nine end-members: titanates of Fe, Mg, and Mn; aluminates of Fe, Mg, and Mn; and ferrites of Fe, Mg, and Mn. However, to assign Fe, Mg, and Mn among these requires something that we do not have: knowledge of the fractionation of Fe, Mg, and Mn among the titanate, aluminate, and ferrite end-members in homogeneous equilibrium. Provisionally, we assume that the proportions of Fe, Mg, and Mn are the same in all three end-members.
In our anticipated thermodynamic formulation (Ghiorso et al. 2003; M.S. Ghiorso et al., in preparation), the chemical potentials of end-member components of the temperature-calibration exchange reaction:
(1) and the Fe-oxidation reaction:
(2)
will be evaluated without having to project compositions into the simple system FeTiO. However, for convenience in presenting the data obtained in this study, we shall project by using the ratio: FeTiO3/(FeTiO3 + Fe2O3) for the mole fraction of ilmenite
[= Fe2+/(Fe2+ + Fe3+/2)], and the ratio: Fe2TiO4/(Fe2TiO4 + Fe3O4) for the mole fraction of
ulvöspinel. Given our assumption about the equal partition of Fe, Mg, and Mn in the spinel, the latter is equivalent to the cation ratio Ti/(Ti + Fe3+/2). We do not mean to imply that this projection is superior to others that have been proposed (e.g., Lindsley and Spencer 1982; Stormer 1983).
Attainment of equilibrium
Because all our experiments involved crystallization of the FeTi-oxides from liquid, that is by synthesis, there is no guarantee that their compositions in run-products represent equilibrium under the experimental conditions of T, P, and Bracketing experiments (e.g., Lindsley
1962, 1963; Andersen and Lindsley 1979, 1988; Spencer and Lindsley 1981) are ordinarily
considered more reliable indicators of equilibrium, although this inference has been questioned in the case of solid solution reversals fluxed by fluid. According to Pattison (1994), growth of the solids by solution-precipitation rather than lattice diffusion destroys the criterion of bracketing.
In the present case, what is known of the kinetics of equilibration of Usp-Mt, as reviewed in Venezky and Rutherford (1999), and our own experience of composition reversals in the system (Evans and Scaillet 1997), suggest that a reasonable approach to equilibration in experiments of 1–2 weeks duration at 800 and 900°C might be expected, given the dimensions of our oxide crystals, and the fact that they grew from a hydrous silicate liquid. The general homogeneity of run-products in the 900°C series of experiments is consistent with this assertion. Whereas Usp-Mt at 800°C is also generally homogeneous, the Ilm-Hem in some cases is patently not. In a few cases at 800°C, we suspect that non-equilibrium growth of FeTi-oxides at the start of the experiment, prior to equilibration of H2O, H2, O2, and the
liquid ferrous/ferric ratio, was not entirely erased by the end of the experiment. For intermediate compositions of Ilm-Hem, the chemical potential driving forces for equilibration of the solid are extremely small.
Analytical uncertainties in terms of projected %usp in analyses of Usp-Mt and projected %ilm in Ilm-Hem are also given in Tables 3, 4, 5, and 6. For Usp-Mt 1σ values average 0.30% usp at 900°C and 0.39% usp at 800°C. For Ilm-Hem, 1σ values at 900°C are in the range 0.2– 1.5% ilm, and at 800°C they are in the range 0.2–5.2% ilm. The largest uncertainties are for rhombohedral oxides in the near-solvus composition range ilm50–75. These high values are not
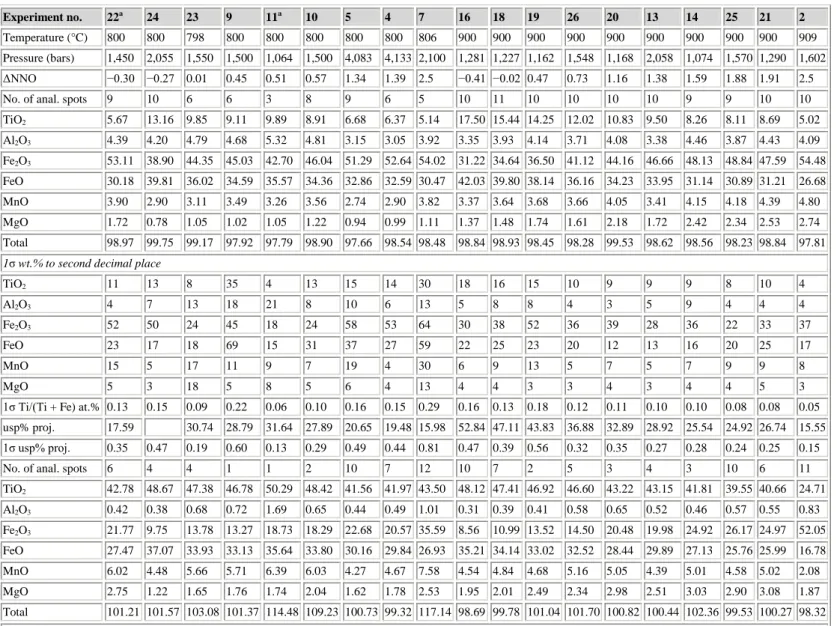
Systematic compositional differences among the run-products of the four different bulk compositions of starting material in each experiment indicate a reproducibility consistent with equilibrium. This is shown especially well at 900°C by the regular sequence of projected %usp of spinel and almost as well by projected %ilm of the rhombohedral oxide when plotted against experimental ΔNNO (Fig. 2). In both cases the sequence is one of increasing projected %usp and %ilm through compositions I–IV. Similar shifts are found when the projection method of Stormer (1983) is used. By their relative smoothness, the trends in Fig. 2 also provide general indications of the reproducibility of the measured ΔNNO.
Figure 2 : Projected %usp in spinel (a) and projected %ilm in rhombohedral oxide (b) vs. ΔNNO in experiments at 900°C for the bulk compositions I, II, III, and IV. Connecting lines are for display purposes only
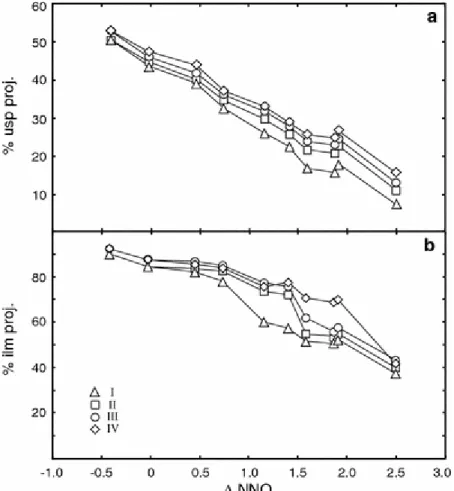
Experiments containing both Mg and Mn (bulk composition IV) provide an independent test of the degree of exchange equilibrium between the two oxides crystallized. Our 800 and 900°C data define a line that is ≈0.05 log units of Mg/Mn in Usp-Mt greater than the best-fit line of Bacon and Hirschmann (1988) for natural FeTi-oxide pairs (Fig. 3). We interpret the linear trend to indicate that exchange equilibrium of Mg and Mn was attained in the majority of our experiments. The small upward displacement relative to the fit of Bacon and Hirschmann may be attributed to the influence of 3.2–5.7 wt.% Al2O3 (Tables 3, 4, 5, 6) on
uptake of MgO into the Usp-Mt (Lindsley 1991), compared to 0.24–1.03 wt.% Al2O3 in
Ilm-Hem, and the generally smaller amounts of Al2O3 in most of the natural oxide pairs. Despite
its location (Fig. 3) experiment 2 was also in Mg/Mn exchange equilibrium. The increase in Mg/Mn in Ilm-Hem results from the passage from FeTi-ordered ilmenite to disordered hematite, as explained later under ―Bulk composition III.‖
Figure 3 : Log(Mg/Mn) in Usp-Mt vs. log(Mg/Mn) in Ilm-Hem in bulk composition IV. Best fit and 2σ for natural pairs from Bacon and Hirschmann (1988, Fig. 1). Experiment 2 has 53 wt.% hem in Ilm-Hem (see text)
It has been suggested that the relatively high Al2O3 contents of both FeTi-oxides in our
experiments may in part be attributed to kinetic problems (such as sluggish diffusion of Al in the liquid). We believe this to be unlikely for the following reasons. In similar experiments on a glass of Pinatubo dacite (Scaillet and Evans 1999), the average Al2O3 content of Usp-Mt in
six experiments at ΔNNO from 1.04 to 1.71 and T = 776 and 834°C was 2.20 wt.% (analyses revised from 1999), as compared to an average of 1.94 wt.% Al2O3 in 14 published analyses
of natural Pinatubo magnetite. An average of 0.51 wt.% Al2O3 in Ilm-Hem in the same six
experiments compares with an average of 0.37 wt.% in the natural Pinatubo ilmenites. These differences are not large and may well reflect the influence of temperature on the uptake of Al2O3 in the FeTi-oxides in natural silicate liquids. The comparisons provide little compelling
evidence of a kinetic problem with respect to the levels of Al.
Three experiments at 800°C (8, 11, and 22) produced oxide Ti/(Ti + Fe) ratios inconsistent with those in experiments under nearby redox conditions. Although apparent failures in terms of redox calibration, these experiments nonetheless provide potential thermometric calibration, and they supply information with respect to relative equilibration rates at 800°C in crystallization experiments of the present kind, as discussed below.
Experiment 8 showed signs of contamination by Ni from a NiPd capsule added to monitor the and by a capsule containing a foreign sample. This is the likely cause of inconsistent values of ΔNNO among the four compositions and its variation with time during the experiment. The nominal (ΔNNO = −0.42, Table 2) must be considered unreliable. Ilm-Hem in composition I varies from Ilm60 to Ilm80; we tentatively interpret a concentration of
compositions at Ilm76 to be that in equilibrium with the much more homogenous Usp-Mt,
although the ilm-rich extreme seems to fit our isotherm better (Fig. 4). Composition II appears to have been contaminated, although not by Ni; an apparently low produced an Hc-rich Usp-Mt spinel (with 3 wt.% ZnO!) + Usp-Mt, instead of Ilm-Hem + Usp-Mt. Composition III
was Ni-contaminated along one side of the charge, where Usp-Mt was found to contain up to 13 wt.% NiO. Element correlations in these Ni-bearing magnetites show that the addition of Ni has the same effect on the composition of Usp-Mt in a rhyolite host as the addition of Mg and Mn (see below): an increase in TiO2 and Al2O3, and decreases in FeO and Fe2O3. Extreme
Ni contamination eliminated Ilm, increased Fe2O3 and further increased Al2O3 in the
magnetite. The rest of the charge was not affected, and the oxide compositions seem reasonable (Tables 3, 4, 5, 6). Ilm-Hem in composition IV appeared not to have achieved equilibrium (Ti too low) with the Usp-Mt; this data-point was deleted from our summary of results.
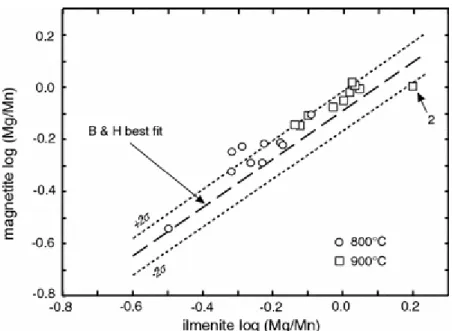
Figure 4 : Roozeboom plot of projected %ilm vs. %usp in experiments on composition I at 800°C (circles) and 900°C (squares). Error bars are ±2σ or actual range when large and skewed. Continuous lines are hand-drawn fits to our data. Also shown are 800 and 900°C isotherms for the pure system FeTiO from the formulations of Andersen and Lindsley (1988) and Ghiorso and Sack (1991). Two experiments (800 and 890°C) on the HAMQ buffer are shown by filled circles and filled squares, respectively
In the products of experiment 11 (ΔNNO = 0.51), %usp and %ilm are within experimental error the same as in experiment 23 (ΔNNO = 0.01). Usp-Mt in experiment 11 is both tabular as well as equant, which suggests pseudomorphic replacement of early-grown Ilm-Hem by Usp-Mt as a result of a 0.5 decrease in oxygen fugacity during the run and the progress of reaction 2.
Experiment 22 at 800°C, nominally at ΔNNO = −0.30 (Table 2), produced FeTi-oxides indicative of higher values of ΔNNO when compared to experiments at nearby ΔNNO. The %usp and %ilm values are out-of-place in this respect for all four bulk compositions, and lie close to those for experiments 4, 5, and 12 (ΔNNO = 1.39, 1.34, and 1.50, respectively). On the other hand, the 40% ferrosilite in orthopyroxene grown in composition IV (see below) is not inconsistent with the nominal ΔNNO. We infer that leakage of fluid took place in the course of this experiment; the orthopyroxene, once crystallized, did not change composition to reflect the increasing whereas the FeTi-oxides and the biotite [Fe/(Fe + Mg) = 0.34 in composition II, see below] apparently did.
In general the Fe/Mg ratio of the product silicates, orthopyroxene, and biotite, reflect the of the fluid. However, the orthopyroxenes are not homogeneous in their Fe/Mg ratios in every experiment (for example 16, 20, and 21 at 900°C and 12 at 800°C), and, where not, the cores of crystals are poorer in Fe than the rims. This suggests that in some cases crystallization of orthopyroxene began to take place in the few hours before the desired run conditions of were reached (H2O, H2, and O2 not yet equilibrated). Once crystallized,
lattice diffusion in orthopyroxene was sufficiently slow to prevent establishment of final equilibration with the liquid.
Our observations on ―problem‖ experiments suggest that overall equilibration rates were in the order: Usp-Mt > Ilm-Hem > biotite > orthopyroxene.
Bulk composition I (FeTiAlO system)
Isotherms drawn in Roozeboom diagrams (e.g., Ghiorso and Sack 1991, Fig. 5; Evans and Scaillet 1997, Fig. 3) effectively display the thermometer calibration and reveal at the same time some of the compositional and underlying crystal-chemical influences. In the present case the ordinate and abscissa values are the mole percentages of FeTiO3 and Fe2TiO4
projected to the binaries as detailed earlier.
Figure 5 The composition of FeTi-spinels at 800°C (a) and 900°C (b) in the ternary diagram ferrite–titanate– aluminate. Triangles are composition I spinels, squares composition II, circles composition III, and diamonds composition IV. Tielines link products of the same experiment; they are not coexisting pairs
The modal proportions of Usp-Mt relative to Ilm-Hem increase with decreasing in our experiments because of Eq. 2 and the mass-balance constraint; as a result Usp-Mt was not present in experiment 6 at ΔNNO ≈ 3.5, and Ilm-Hem was hard to find in experiments below ΔNNO = 0. Average compositions of coexisting FeTi-oxides grown from composition I, after projecting out the components of Al2O3, are shown in the Roozeboom plot of Fig. 4.
Uncertainty bars are typically larger for Ilm-Hem than for Usp-Mt. Also note that in some cases the desired ten spot analyses of Ilm-Hem could not be obtained because of small crystal size (Tables 3, 4, 5, 6). Al2O3 in the Usp-Mt varies from 1.6 to 2.1 wt.% (about 4 mol.% of
the hercynite component), and in Ilm-Hem from 0.24 to 0.68 wt.% (i.e., mostly less than 1% of the corundum component). The average compositions of the FeTi-oxides (Tables 3, 4, 5, 6) define 800 and 900°C isotherms that both contain an inflection. The inflections indicate significant non-ideality in the rhombohedral phase and may be interpreted as primarily reflecting the thermodynamic consequence of long-range order of Fe and Ti in ilm-rich compositions and the second-order transition to FeTi-disordered hem-rich
compositions (Ghiorso 1990). Accordingly, our isotherms have been hand-drawn to fit the data-points and to reflect a change to vertical slope (i.e., a narrow solvus gap, Ghiorso et al.
2003) near ilm60. In the simple system FeTiO, the transition compositions are 59% ilm at
800°C and 64% ilm at 900°C (Ghiorso 1990; Harrison et al. 2000a; Harrison and Redfern
2001). The small amount of the corundum component in Ilm-Hem in composition I charges
seem unlikely to seriously displace the transition curve, but it may have widened the solvus slightly.
In comparison to QUILF (Andersen and Lindsley 1988), our data at 800 and 900°C show a more usp-rich spinel coexisting with Ilm-Hem when ilm >50% and the converse when ilm <50% (Fig. 4). These differences result in part from the strongly inflected nature of our isotherms. The QUILF isotherms at these temperatures (Fig. 4) show mild inflections due to the positive regular solution model adopted for the rhombohedral solid solutions by Andersen and Lindsley (1988). These authors recommended that their calibration not be used over most of the range in Ilm-Hem covered in Fig. 4. A comparison of the hc-mt and hc-usp solvi (Ghiorso and Sack 1991) suggests that non-ideal differences would displace our data-points ≈2 mol.% usp down relative to the isotherms for the pure FeTiO system; the presence of Al clearly does not explain the differences in calibrations. We believe that they reflect in part the inclusion in the A&L (and G&S) isotherm-fits of experiments using the Ni–NiO solid oxygen buffer. There is evidence that these experiments may have been influenced by the take-up in the charge of Ni diffusing through the capsule walls (D.H. Lindsley, personal communication). It is significant that experiments in the pure system using the Hed-Adr-Mt-Qtz (HAMQ) buffer at 800 and 890°C (Andersen and Lindsley 1988) agree quite well with our isotherms (Fig. 4).
Our data show a somewhat better fit to isotherms derived from Ghiorso and Sack (1991), who incorporated FeTi order–disorder into their model for ilm-hem solid solutions. The inflections in the isotherms on the Roozeboom plot remain a feature of the system up to 1,300°C (Lattard et al. 2005).
Compositional variability of Ilm-Hem within each run-product, especially in the 800°C series of experiments, tends to be greatest in Ilm-Hem falling within the range 50–80% ilm. This
reflects in part the very small free energy differences in intermediate Ilm-Hem solutions. We shall see that this is the case for Ilm-Hem in all four bulk compositions studied.
In a few cases at 800°C (and rarely at 900°C, Fig. 2), oxide compositions are out-of-sequence in terms of ΔNNO with respect to neighboring experiments. We attribute this to failure of the membrane to equilibrate H2 or to changes in redox state (mostly upwards) during the run.
Compositions nevertheless appear to correctly record the experimental temperature.
Bulk composition II (FeTiAlMgO system)
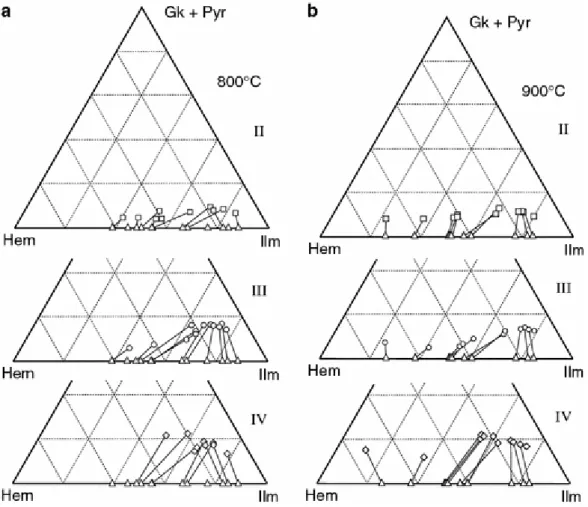
The principal effects of the addition of 1 wt.% MgO to composition I are an increase in the content of aluminate components in Usp-Mt at the expense of ferrite (Fig. 5a, b), and the formation of geikielite at the expense of hem in Ilm-Hem (Fig. 6a, b). Projection from the top to the base of the triangles in Figs. 5 and 6 gives the apparent proportions of components in the system FeTiO already shown in Fig. 2. The increase in projected %usp (Fig. 2a) caused by MgO addition is for the most part proportionally larger than that of %ilm (Fig. 2b) for a given
T, P, and The Roozeboom plot (Fig. 7), by necessity, shows the projected proportions of usp, mt, ilm, and hem. The isotherms are not very different from those for the Mg-free composition I, except when Ilm-Hem compositions are poorer than about 60% ilm. However, the data-points for individual experiments have moved up and to the right along the isotherms, as shown in Fig. 8a, especially for Ilm-Hem in the solvus region, where ΔNNO = 0.7–1.5 (Fig. 2). These shifts can be interpreted as a response to increased non-ideality of gk-hem with respect to ilm-hem, and similarly qan-mt with respect to usp-mt. There seems to be a larger break in slope (solvus?) of the isotherms at about 60–70% ilm (Fig. 7) in comparison to composition I. In this context, it is important to note that the sudden change in slope in projection at 900°C (Fig. 7) is 4–5% ilm lower than it would be if the ≈10% gk were instead included in ―ilmenite‖ on the diagram. The latter procedure might be more appropriate for locating the order–disorder transition and the solvus limits, if geikielite simply proxies for ilmenite in this regard. The same comment applies to the Roozeboom diagrams we use for compositions III and IV.
Figure 6 : The composition of rhombohedral oxides at 800°C (a) and 900°C (b) in the ternary diagram hematite– ilmenite–geikielite + pyrophanite. Symbols are the same as in Fig. 5
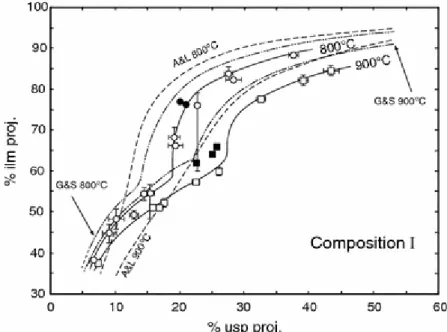
Figure 7 : Roozeboom plot for composition II (system FeTiAlMgO). Dashed lines are isotherms from Fig. 4 for composition I. Continuous isothermal lines are drawn by hand. Same symbols as Fig. 4. Experiments on Pinatubo dacite (Scaillet and Evans 1999): open diamonds 834°C and filled diamonds 780 ± 5°C
Figure 8 : Comparison of Roozeboom plots at 800 and 900°C between composition I and II (a), and between composition I and III (b). Arrows point from I to II and III in each experiment, respectively
Figure 7 also shows data-points for FeTi-oxides from similar redox-controlled hydrothermal experiments on glass made from Pinatubo dacite (Scaillet and Evans 1999, here with revised analyses). Comparison with the present results, with comparable amounts on Mg in the FeTi-oxides, is good, especially when allowance is made for the higher Al2O3 content of Usp-Mt in
the plagioclase-free rhyolite composition. This increase in Al2O3 can be expected to have
shifted our isotherms slightly to more mt-rich compositions.
It is not clear how much of the increase from 4 to ≈10% of aluminate (Fig. 5a, b) in Usp-Mt relative to composition I corresponds to Mg-spinel or to hercynite. At 800°C the gk content of Ilm-Hem rises from 4 to 9 mol.% toward the ilmenite end of the series (Fig. 6a), and at 900°C the gk component rises from 9 to 12 mol.% (Fig. 6b). Ghiorso and Sack (1991) noted this temperature dependence for natural ilmenites. The composition-dependent uptake of gk in Ilm-Hem would reflect the non-ideality differences mentioned above.
When expressed as the ratio MgO/Fe2+O, MgO is enriched in Ilm-Hem over Usp-Mt, but not as strongly as found by Pinckney and Lindsley (1976) in the Al-free system FeTiMgO. The Fe2+Mg−1 ion-exchange reaction is:
(3) The ln K D of this reaction is less negative at 900 than 800°C (Fig. 9a), in agreement with
Lindsley (1991, Fig. 13), but the ln K D also correlates with the Fe2O3 content of the
rhombohedral phase, such that the preference is projected to reverse itself when %Fe2O3 > 60.
This reflects in part the trends seen in Figs. 5 and 6. With Fe3+ present in the system, a Fe2+ -free equilibrium also holds:
(4) The existence of this equilibrium is presumably responsible for the trends in Fig. 9a.
Figure 9 : Ln K D [K D = (Mg/FeUsp-Mt)/(Mg/FeIlm-Hem)] in compositions II and IV (a) and ln K D [K D = (Mn/Fe Usp-Mt)/(Mn/FeIlm-Hem)] in compositions III and IV (b), vs. wt.% Fe2O3 in Ilm-Hem
The MgO/Fe2+O ratio of Usp-Mt increases with increasing redox state, and correlates well with MgO/FeO in orthopyroxene.
The change from composition I to composition II at constant T, P, and should of course have no effect on log K of the exchange thermometer reaction 1 or on log K of the redox reaction 2. The goal of a subsequent paper (M.S. Ghiorso et al., in preparation) is to calibrate activity–composition models that make this a reality for both reactions. We can see already that some cancellation of compositionally induced shifts occurs because both the ferrite and the hem components are reduced as a result of the addition of MgO.
If we examine the compositional effect on the redox reaction simply in terms of a change in log K ideal (log K of reaction 2 expressed in terms of un-projected mole fractions of hem and
mt), we find that cancellation is far from complete. Composition II oxides appear to have formed at as much as 1 log unit of oxygen fugacity lower than those in composition I in the same experiment. For the same reason, log K ideal of the thermometer reaction 1 fails as any
sort of suitable proxy for log K.
The high values of aluminate in Usp-Mt may be attributed in part to the contents of Mg (and Mn, see below) in the oxide minerals, but also to the fact that our rhyolite glass starting material contains no Ca. In natural magmas, Ca would ordinarily complex with Al in the liquid as an ―anorthite‖ component, thus reducing the amount of Al likely to enter the oxide minerals.
Bulk composition III (FeTiAlMnO system)
The compositional shifts caused by the addition of 0.8% MnO are similar in character to those induced by MgO, but somewhat larger, namely: (1) larger increases in projected %ilm and %usp when compared to composition I (Fig. 2), as much as 19% ilm in the range 55–80% ilm and ΔNNO from 0.5 to 1.7 and (2) decreases in mt and hem components throughout, balanced by increases in aluminate in Usp-Mt and pyrophanite in Ilm-Hem (Figs. 5, 6). Aluminates are comparable to the corresponding amounts in composition II. There is more pyrophanite in Ilm-Hem at 800°C than at 900°C, in agreement with the temperature dependence observed in experiments (Mazzullo et al. 1975; Lindsley 1991, Fig. 15) and in natural ilmenites (Ghiorso and Sack 1991).
Noticeable in Fig. 6a, b, composition III, is the variable uptake of pyrophanite in Ilm-Hem: three times as much in ilm-rich compositions as in hem-rich compositions. Since the bulk composition of the charge has a constant content of MnO, the locus of MnO contents in Fig. 6a, b, to a first approximation defines an isopotential line. This suggests that the activity coefficient of pyrophanite in Hem is 3× larger than its value in Ilm. There will be corresponding differences in the activity coefficients of hem and ilm in pyrophanite according to the Gibbs–Duhem equation at fixed P and T. The non-ideal effect of Mn substitution is thus larger than in the case for Mg.
The isotherms for composition III (Fig. 10) appear to be more inflected than for compositions I and II. At low values of ΔNNO, Ilm-Hem is richer in ilm, and at high values of ΔNNO it is poorer in ilm. This suggests more non-ideal behavior of Ilm-Hem, perhaps with a solvus of significant width.
Figure 10 : Roozeboom diagram for composition III (system FeTiAlMnO). Same symbols as Fig. 4. Continuous lines drawn by hand. Dashed lines are our isotherms from Fig. 4
MnO partition between the two oxides (relative to Fe2+O) is similar in behavior to MgO, but the dependence of ln K D on the Fe2O3 content of the Ilm-Hem is almost twice as strong, such
that ln K D becomes positive when %Fe2O3 is greater than about 40 (Fig. 9b). There is an
unmistakable change in slope of the trends in Fig. 9b at 30–40 wt.% Fe2O3, and we assume
that this reflects passage across the order–disorder transition in Ilm-Hem. Molecular fractions of Fe2+ cancel when ln K D (Mn/Fe2+) is subtracted from ln K D (Mg/Fe2+): that is, Fig. 9a
minus Fig. 9b. This difference corresponds to the y-intercept on the Bacon–Hirschmann diagram (Fig. 3). Because this difference becomes increasingly negative as Fe2O3 in Ilm-Hem
extends beyond 30%, the B–H correlation is shifted downwards. For experiment 2 the downshift is 0.48/2.303 or 0.2 log units. Thus, for Ilm-Hem in the disordered hem-rich compositional range, the B–H diagram should consist of a series of isopleths for %hem having intercepts more than 0.2 lower than the published correlation. Three pairs from granitic glass recrystallized at ΔNNO = 2.5 show this behavior (Dall’Agnol et al. 1999). Iron– titanium oxide pairs in natural volcanics with hem > ilm are, of course, extremely rare.
Log K ideal of the redox reaction 2 differs from that in composition I by as much as −1 to −2
log units. This means that any thermodynamic formulation of the thermobarometer in complex systems must incorporate sizeable temperature- and composition-dependent activity coefficients when significant amounts of MnO are present.
Bulk composition IV (FeTiAlMgMnO system)
The compositionally induced shifts are even larger when Mg and Mn are added together (Figs. 2, 11, cf. 7 and 10). Ilm-Hem does not cross the solvus/transition region until ΔNNO reaches as high as 2.0 (Fig. 2b).
A Bacon–Hirschmann style plot (not shown here) of log(Mg/Mn) in oxide pairs from all three bulk compositions II, III, and IV shows a straight line extending over three orders of magnitude and possessing a slope of 0.95. This compares with a slope of 0.932 in the