HAL Id: hal-02978797
https://hal.archives-ouvertes.fr/hal-02978797
Submitted on 23 Dec 2020
HAL is a multi-disciplinary open access
archive for the deposit and dissemination of
sci-entific research documents, whether they are
pub-lished or not. The documents may come from
teaching and research institutions in France or
abroad, or from public or private research centers.
L’archive ouverte pluridisciplinaire HAL, est
destinée au dépôt et à la diffusion de documents
scientifiques de niveau recherche, publiés ou non,
émanant des établissements d’enseignement et de
recherche français ou étrangers, des laboratoires
publics ou privés.
Mesoscopic modeling of equiaxed and columnar
solidification microstructures under forced flow and
buoyancy-driven flow in hypergravity: Envelope versus
phase-field model
Alexandre Viardin, Youssef Souhar, Martín Cisternas Fernández, Markus
Apel, Miha Založnik
To cite this version:
Alexandre Viardin, Youssef Souhar, Martín Cisternas Fernández, Markus Apel, Miha Založnik.
Mesoscopic modeling of equiaxed and columnar solidification microstructures under forced flow and
buoyancy-driven flow in hypergravity: Envelope versus phase-field model. Acta Materialia, Elsevier,
2020, 199, pp.680-694. �10.1016/j.actamat.2020.07.069�. �hal-02978797�
Mesoscopic modeling of equiaxed and columnar solidification
microstructures under forced flow and buoyancy-driven flow in
hypergravity: Envelope versus phase-field model
⋆,⋆⋆
Alexandre
Viardin
a,∗,
Youssef
Souhar
b,c,
Martín
Cisternas Fernández
b,
Markus
Apel
aand
Miha
Založnik
baACCESS e.V., Intzestrasse 5, D-52072 Aachen, Germany bUniversité de Lorraine, CNRS, IJL, F-54000 Nancy, France
cArts et Metiers Institute of Technology, MSMP, HESAM Université, F-51006 Châlons-en-Champagne, France
A R T I C L E I N F O Keywords: Alloy solidification Multiscale modeling Microstructure formation Convection Phase-field method Abstract
Quantitative modeling of solidification microstructures growing under the influence of convection is a challenging multiscale problem. It is of particular interest in processes where strong flow is present, such as centrifugal casting of Ti–Al alloys, where hypergravity strongly reinforces the buoyancy-driven flow. We present the coupling of the mesoscopic envelope model for dendritic solidification with fluid flow. We use the model to investigate columnar and equiaxed dendritic growth of the 𝛽-solidifying Ti–45 at.%Al under the influence of flow. The calculations are compared to phase-field results in 2D. For equiaxed growth the case of forced flow is treated. For columnar growth, the influence of buoyancy-driven flow on the growing structure and on the primary dendrite arm spacing is characterized for gravity levels ranging from 0 to ±15 𝑔. The computational cost of the mesoscopic simulations is around two orders of magnitude lower than that of phase field. We show that the mesoscopic model can accurately reproduce the microstructure characteristics, such as grain shape and primary arm spacing (PDAS), as long as the dendrite tip remains parabolic. When flow effects in columnar growth are strong enough to change the tip shape and induce tip splitting events, the mesoscopic envelope model does not reproduce the resulting branched microstructures. It does however predict the corresponding PDAS reduction at the correct gravity level.
1. Introduction
Centrifugal casting is a key process for manufacturing Ti–Al low-pressure turbine blades for aircraft engines [1–
3]. Effective gravity in this process reaches up to tens of terrestrial gravity levels and buoyancy-driven convection of liquid is therefore strongly intensified. While the effect of centrifugation on the macroscale flow in the solidifying piece is fairly well known, mainly through process simulation [4–
6], the influence of the strong convection on the growth of the solidification microstructure remains an open question.
Recently, Viardin et al. [7] investigated the influence of hypergravity on the columnar dendritic microstructure during directional solidification of a Ti–48 at.%Al using phase-field simulations. They have shown that the direction and the level of hypergravity triggers changes of the primary dendrite arm spacing (PDAS) and of the grain morphology. These changes are particularly striking in conditions representative of in-dustrial centrifugal processes: gravity direction opposite to the temperature gradient and gravity levels of ∼ 20 𝑔.
Un-⋆
This work was carried out as part of the GRADECET (GRAvity DEpen-dence of Columnar to Equiaxed Transition in TiAl Alloys) research project.
⋆⋆
This is a post-peer-review, pre-copyedit version of an article published in Acta Materialia: A. Viardin, Y. Souhar, M. Cisternas Fernández, M. Apel, M. Založnik, Mesoscopic modeling of equiaxed and columnar solidification microstructures under forced flow and buoyancy-driven flow in hypergravity: Envelope versus phase-field model, Acta Mater. 199 (2020) 680–694. The final authenticated version is available online at:https://doi.org/10.1016/ j.actamat.2020.07.069.
∗Corresponding author.
[email protected](A. Viardin)
der the influence of strong convection, the microstructure is refined and the grain morphology changes from clearly struc-tured dendrites to branched structures with less clearly defined growth directions. Viardin et al. have shown that this is linked to the transition of the growth and of the microscale flow from a steady-state regime at moderate hypergravity to oscillatory regimes at high hypergravity levels. These findings are con-sistent with experimental post mortem characterizations of Ti–Al microstructures produced in hypergravity [3,8].
Previous investigations on gravity effects on columnar growth, based on experiments in a Pb–Sn alloy [9] and on phase-field simulations of an Al–Cu alloy [10–12], also re-ported a significant influence of the flow on the PDAS. No-tably, the primary dendrite arm spacing decreases for specific fluid flow configurations that promote growth of tertiary den-drite arms, while inhibiting growth of primary denden-drite tips through advection of solute. These spacing adjustments are a result of interactions of diffusion of heat and solute, cap-illarity, and fluid flow across a range of scales: from the microscale (dendrite tip) to the mesoscale (flow structures at the scale of several PDAS). A comprehensive explanation of these interactions is yet to be found.
Quantitative numerical simulations are indispensable as a complementary tool for the analysis of post mortem char-acterizations available from the hypergravity experiments [3,
8]. The remarkable power of phase-field models for the de-tailed description of the interaction between solidification microstructures and flow [7,10–15] is impaired by their high computational cost. Sophisticated numerical and
ming techniques [16] and massive supercomputing resources are necessary to be able to run simulations on domains that are large enough to capture the scales of the flow structure. To simulate microstructures at a larger scale and at a lower cost, several so-called mesoscopic models have been developed in recent years. The basic idea of these models is to repre-sent a dendritic microstructure in a simplified way instead of describing the detailed shape of the solid-liquid interface. The dendrite is described, for example, by a smooth enve-lope [17–19] or by a network of thin needles [20]. The com-putational cost of mesoscopic models is smaller than that of phase field, and of other models that describe the solid-liquid interface [21,22], because they can use coarser spatial and temporal discretizations. Mesoscopic models are particularly interesting in problems involving flow, because a larger range of scales needs to be tackled than in diffusive growth. The extension of mesoscopic models to include convection is a challenge and requires careful validation.
In this paper we present an extension of the mesoscopic envelope model for dendritic growth [17,23] that accounts for flow and solute convection. We use the model to simulate columnar solidification of a technical Ti–Al alloy under the influence of buoyancy-driven convection in hypergravity of up to 20 𝑔. Through detailed comparisons to a phase-field model we show that the mesoscopic model correctly predicts the main microstructure features due to convection: adjust-ments of primary dendrite arm spacing and the transition between dendrites and branched structures. Prior to the appli-cation to the rather complex case of columnar solidifiappli-cation, we thoroughly validate the model by comparisons to phase field for a case of equiaxed solidification with forced con-vection. This validation carefully examines the influence of the principal model parameters of the model with convection and also shows that the numerical solutions are free of grid anisotropy. The present work is not intended to provide a detailed analysis of the physical phenomena, but rather a dis-cussion of the capability of the mesoscopic model to represent them quantitatively.
2. Mesoscopic envelope model
The mesoscopic envelope model was originally developed for diffusion-controlled dendritic growth in pure substances by Steinbach et al. [17,24]. It was later extended to binary alloys [25] and to convection [26,27]. In the mesoscopic en-velope model the complex branched shape of a dendritic grain is described in a simplified way by an envelope, a smooth surface that links the tips of the actively growing dendrite branches and by a continuous solid fraction field inside the envelope. The growth of the envelope can be calculated from the growth velocities of the tips. In an alloy, the growth of the dendrite tips is governed by the solute flux that the tips eject into the liquid. Two key assumptions of the meso-scopic model are: (i) the phenomena controlling the growth of a dendrite tip are universal and are therefore valid for tips of any order (primary, secondary, tertiary, ...) and (ii) the interactions at the small (tip) scale are independent of the
interactions at the large (grain) scale. These assumptions enable us to use the Ivantsov analytical solution [28] in the stagnant-film formulation of Cantor & Vogel [29] to describe the growth of all dendrite tips. Since this solution is the solu-tion of steady-state diffusion around a growing paraboloidal tip, a further assumption of the mesoscopic model is that the transients at the tip scale are fast compared to the transients at the grain scale.
The Cantor & Vogel solution of steady-state diffusion around a growing parabolic tip relates the tip growth Péclet number, Petip, to the supersaturation, Ω𝛿, in the liquid at a
finite distance, 𝛿, from the tip. For a 2D tip, Ω𝛿 = √ 𝜋Petipexp ( Petip ) [ erf c(√Petip ) − erf c (√ Petip [ 1 + 2𝛿 𝑅tip ])] . (1)
The Péclet number is defined by Petip = 𝑅tip𝑉tip∕(2𝐷l), where 𝑅tipis the tip radius, 𝑉tipis tip growth velocity, and
𝐷lis the solute diffusion coefficient in the melt. The
super-saturation is defined by Ω𝛿 = (𝐶l∗− 𝐶
𝛿
l)∕((1 − 𝑘p)𝐶l∗)where
𝐶l∗is the liquid equilibrium solute concentration
(concentra-tion at the interface), 𝐶𝛿
l is the solute concentration in the liquid at the distance 𝛿 from the tip, and 𝑘pis the alloy parti-tion coefficient. The tip velocity is obtained from Petipby a tip selection criterion that reads 𝑅2
tip𝑉tip= 𝑑0𝐷l∕𝜎
∗, where
𝑑0 = Γ∕(𝑚L𝐶l∗(𝑘p− 1))is the capillary length, 𝑚Lis the liquidus slope, Γ is the Gibbs-Thomson coefficient, and 𝜎∗ is the tip selection parameter. It follows that the tip speed is given by
𝑉tip=
4𝜎∗𝐷lPe2tip
𝑑0 . (2)
The tips are assumed to grow in prescribed preferential growth directions. In the 2D simulations performed in the present study the cubic crystal dendrites are given four possible growth directions perpendicular to each other. The normal envelope growth velocity, ⃗𝑣𝑛, is then calculated from the local tip speed,
𝑉tip, by the relation ⃗
𝑣𝑛= 𝑉tip𝑛⃗cos 𝜃, (3)
where 𝜃 is the angle between the outward drawn normal to the envelope, ⃗𝑛, and the preferential growth direction that forms the smallest angle with the local envelope normal. To propa-gate the envelope on a numerical mesh an interface-capturing method [30] is used, combined with a surface reconstruction method for improved accuracy [23].
The fluid flow and the solute transport by diffusion and by convection at the mesoscopic scale are described by vol-ume averaged equations that are valid in the whole domain, i.e., both inside and outside the envelopes. Solidification inside the envelope is modeled using the Scheil assumptions: thermodynamic equilibrium at the solid-liquid interface, neg-ligible diffusion in the solid and instantaneous diffusion in the liquid. This implies that the concentration of the binary
liquid inside the envelope is linked to the temperature field by 𝐶∗
l = (𝑇 − 𝑇f)∕𝑚L, where 𝐶l∗is the liquid equilibrium concentration, 𝑇 is the temperature, and 𝑇f is the melting temperature of the pure solvent. These assumptions lead to the conservation equation for the solute in the liquid phase:
𝑔l𝜕𝐶l 𝜕𝑡 +∇⋅ ( 𝑔l𝑣⃗l𝐶l)= 𝐷l∇⋅ ( 𝑔l∇𝐶l ) +𝐶l(𝑘p−1) 𝜕𝑔l 𝜕𝑡 , (4)
where ⃗𝑣l is the volume averaged liquid velocity. This so-lute transport equation is identical to the one in the diffusive model [31], but has an additional convection term.
The solution of Eq. (4) gives 𝐶loutside the envelope and
𝑔l inside the envelope. Outside the envelope, the material
is fully liquid (𝑔l= 1) and Eq. (4) reduces to a single phase convection-diffusion equation. Inside the envelope, the liquid is in thermodynamic equilibrium, such that 𝐶l= (𝑇 −𝑇f)∕𝑚L, where the temperature is assumed to be known. With 𝐶l known, Eq. (4) gives the evolution of the liquid fraction inside the envelope. The concentration of the solid, 𝐶s, inside the envelope is given by
𝜕(𝑔s𝐶s)
𝜕𝑡 = −𝑘p𝐶l 𝜕𝑔l
𝜕𝑡 , (5)
where 𝑔s= 1 − 𝑔lis the solid fraction.
In the modeling of the liquid flow the interior of the en-velopes is considered as a porous medium. The drag on the liquid flowing through the envelopes depends on the perme-ability of the porous medium. The flow is described by the volume averaged mass and momentum conservation equa-tions: ∇⋅(𝑔l𝑣⃗l)= 0 (6) 𝜕(𝑔l𝑣⃗l) 𝜕𝑡 + ∇⋅ ( 𝑔l𝑣⃗l⊗ ⃗𝑣l)= −𝑔l 𝜌0∇𝑝 + ∇⋅ ( 𝑔l𝜈l∇ ⃗𝑣l) − 𝜈l𝑔 2 l 𝐾 𝑣⃗l+ 𝑔l [ 1 − 𝛽𝐶(𝐶l− 𝐶0 )] ⃗ 𝑔 (7)
where 𝜌0is the reference density, 𝑝 the pressure, 𝜈lthe kine-matic viscosity, 𝐾 the hydrodynamic permeability, 𝛽𝐶the
solutal volume expansion coefficient, 𝐶0the reference so-lute concentration, and ⃗𝑔 the gravity acceleration. Note that the Boussinesq approximation for buoyancy-driven flow is used and that the thermal expansion of the liquid is neglected in this work, but can easily be incorporated in the model. The drag is given by the Darcy drag term, (𝜈l𝑔l2𝑣⃗l)∕𝐾, on the right hand side of the momentum equation (Eq. (7)) and depends on the permeability, 𝐾, a property of the porous structure in the interior of the envelope. The permeability of the intra-granular dendritic structure is modeled by the isotropic Blake-Kozeny relation and depends on the liquid fraction and on a characteristic length of the porous structure, 𝓁c: 𝐾 = 𝓁 2 c𝑔 3 l 180(1 − 𝑔l )2. (8)
This relation is certainly an oversimplification, but it provides the basic physical ingredients of permeability. An accurate determination of 𝓁cis not trivial, however it is expected to be of a similar order of magnitude as the secondary dendrite arm spacing. Note that the permeability that needs to be repre-sented in the mesoscopic envelope model is the permeability of the intra-envelope dendritic structure. This permeability is a property of the internal structure of a single dendrite and is therefore conceptually different from that of the mushy zone, which represents a property of a large ensemble of dendrites. While a large amount of experimental and modeling work has been done on permeability of mushy zones [32–41], no model of permeability of dendrite envelopes exists. We may speculate that it would need to account for anisotropy due to the branch directions and for more than one characteristic length scale; however this is out of the scope of this work.
The conservation equations for solute (Eqs. (4)–(5)), mass (Eq. (6)), and momentum (Eq. (7)) are solved with the finite-volume method with an in-house solver based on OpenFOAM®[42] and are coupled by the PIMPLE1algorithm [43]. The method
for the calculation of the envelope propagation from the solute concentration field and other details on numerical algorithms are detailed in Ref. [23].
3. Phase-field model
The phase-field model used is based on the multiphase field model [44–46]. A finite-difference correction was used to improve the accuracy of the results [47]. The coupling of the phase-field model with the melt flow is described in Refs. [10,13]. The partial differential equations for the melt flow are solved with a grid spacing twice as large as for con-centration and phase-field equations, a method suggested in Ref. [48]. In order to calculate the advection term, the flow velocity is projected on the finer grid using linear interpola-tion. This method allows speeding up the computations of the complete system by a factor of five for the simulations shown in this paper.
4. Simulation parameters
We chose a 𝛽-solidifying Ti–45 at.%Al alloy for our in-vestigations. Its physical properties are given in Table1. The solutal expansion coefficient comes from numerical calcu-lations by Lopis [49] and the viscosity was evaluated from experiments by Wunderlich [50]. The temperature depen-dence of density has been neglected.
The tip selection parameter, 𝜎∗, for the mesoscopic model was determined from phase-field simulations. In the case of equiaxed growth, 𝜎∗was determined directly from the steady-state primary tip radius and velocity measured in the phase-field simulation of the diffusive regime. From the tip selection criterion it follows that 𝜎∗= 𝑑
0𝐷l∕(𝑅2tip𝑉tip). In the case of columnar growth this method could not be used because the grid resolution in the phase-field simulations
1The PIMPLE algorithm is a combination of PISO algorithm (Pressure
Implicit with Splitting of Operator) and SIMPLE algorithm (Semi-Implicit Method for Pressure-Linked Equations).
was lower than in the equiaxed case and therefore gave a less accurate calculation of the tip curvature. Note that 𝜎∗∼ 𝑅−2 tip and therefore a very accurate determination of 𝑅tipis required to calculate 𝜎∗. The ratio of phase-field grid spacing to the primary tip radius was Δ𝑥PF∕𝑅
tip ≈ 1∕8for equiaxed and was increased to Δ𝑥PF∕𝑅
tip≈ 1∕2for columnar. This was needed in order to speed up calculations because of the longer simulated time (200 s for columnar versus 20 s for equiaxed). The phase-field simulation can nevertheless be considered as quantitative in the context of this study, i.e., to provide a real-istic dendritic microstructure for the analysis of the impact of the flow. The Δ𝑥PFfor the columnar simulations was chosen by a careful convergence study of dendrite tip simulations that have shown a variation of the tip operating points (tip, speed and supersaturation) of less than 5% for a variation of the mesh spacing from Δ𝑥PF∕𝑅
tip ≈ 1∕8to 1∕2. Because of the less accurate curvature calculation with phase-field for the columnar case, 𝜎∗was rather determined from the liquid concentration at the interface of a dendrite tip, 𝐶∗
l PF, obtained by phase field for steady-state directional solidifica-tion in diffusive condisolidifica-tions. The theoretical tip Péclet number, PePFtip, was then determined from the dimensionless supersat-uration at the tip, ΩPF
tip= (𝐶 ∗ l
PF
− 𝐶0)∕((1 − 𝑘p)𝐶l∗PF), using the Ivantsov law, such that ΩPF
tip = Iv(Pe PF
tip). This method is based on the assumption that the supersaturation of the columnar tip is close to that of a free tip. Such an approxi-mation is justified if the confinement presented by both the primary arm spacing and by the domain boundary ahead of the tip is sufficiently weak. This is the case here, since both the free distance ahead of the tip and the primary arm spacing are 450 µm and are thus 3.75 times larger than the diffusion length, 𝐷l∕𝑉dif f = 120µm. The selection parameter is then
𝜎∗= 𝑑 PF 0 𝑣pull 4𝐷l(PePFtip)2 , (9) where 𝑑PF 0 = Γ∕(𝑚L𝐶 ∗ l PF
(𝑘p− 1))is the capillary length. With this 𝜎∗the tip operating state (𝑉
tip, Ωtip) predicted by phase field was accurately reproduced by the mesoscopic model.
The stagnant-film thickness, 𝛿, is a key parameter of the mesoscopic model. While a general calibration of 𝛿 has been previously established for steady-state equiaxed growth in purely diffusive conditions in 3D [23], it is not necessarily valid for growth transients [51,52], for 2D growth, and under the influence of convection. In this work we used a value for
𝛿that gave the best fit to the phase-field simulations (reported
in Table2). The sensitivity to 𝛿 is discussed in more detail for the equiaxed and the columnar case in Sections5.4and6.3, respectively.
In both models the grains were initiated by introducing seeds. In the mesoscopic simulations the radius of the circular seed is limited by the grid spacing and was 22.3 µm. In the phase-field simulations the seed is set to much smaller, of the order of the grid spacing.
We used the mesoscopic model code CrystalFoam [23],
Table 1
Thermophysical properties of the Ti–45 at.%Al alloy.
Alloy concentration (𝐶0) 45 at.%Al
Melting temperature of pure Ti (𝑇f) 2320 °C
Liquidus slope (𝑚L) −11.26 K/at.% [55]
Partition coefficient (𝑘pAl) 0.9 — [55] Liquid diffusion coefficient (𝐷l) 3⋅ 10−9 m2∕s [56]
Gibbs-Thomson coefficient (Γ) 1.61⋅ 10−7 K m
Interfacial energy (𝜎sl) 0.1 J∕m2 [57]
Interfacial energy anisotropy 1.1% — [57] Density (liquid) (𝜌0) 3700 kg∕m3 [49]
Solutal expansion coefficient (𝛽𝐶) 4.784⋅ 103 at.%−1 [49]
Kinematic viscosity (𝜈) 1.89⋅ 10−6 m2∕s [50]
Table 2
Solidification and simulation parameters.
Equiaxed Columnar Solidification parameters
Temperature gradient (𝐺𝑇) — 12000 K∕m
Pulling speed (𝑉pull) — 25µm∕s
Initial supersaturation of the seed (Ωinit) 0.185 0.013
Mesoscopic model parameters
Tip selection constant (𝜎∗) 0.029 0.145
Characteristic length for permeability (𝓁c) 50µm 50µm
Stagnant-film thickness (𝛿)
– Columnar — 0.044 𝑙dif f
– Equiaxed in purely diffusive growth 0.28 𝑙dif f —
– Equiaxed under 𝑣f low= 40µm∕s 0.25 𝑙dif f —
– Equiaxed under 𝑣f low= 200µm∕s 0.20 𝑙dif f —
Numerical Grid spacing
Mesoscopic (Δ𝑥MS) 5µm 5µm
Phase field (Δ𝑥PF) 0.30µm 0.75µm
Phase field for flow equations (Δ𝑥PF,f low) 0.60µm 1.50µm
Timesteps
Mesoscopic (Δ𝑡MS) 10−3s 10−3s
Phase field (Δ𝑡PF) 10−5s 5⋅ 10−4s
Characteristic operating state of the primary tip
Steady state tip supersaturation (Ω0) 0.185 0.142
Steady state tip speed in diff. growth (𝑉dif f) 34µm∕s 25µm∕s
Steady state tip diffusion length (𝑙dif f) 88µm 120µm
developed on the OpenFOAM®2.2.2 [53] finite-volume plat-form. For the phase-field simulations, we used the software MICRESS®V6-1 [54].
5. Equiaxed growth
The first application of the mesoscopic envelope model addresses equiaxed growth of a 𝛽-solidifying Ti–45 at.%Al crystal into an isothermal undercooled melt in forced flow. In a first stage, we will present results of equiaxed growth in diffusive conditions, i.e., without flow. In a second stage, we will show calculations with convection. A study of the influence of the two principal parameters of the mesoscopic model, the permeability and the stagnant-film thickness, on the mesoscopic model predictions will be presented. The hy-drodynamic permeability of the envelope is a crucial physical parameter that describes the drag force acting on the liquid that percolates through the branched solid structure. It deter-mines which portion of the flow passes through the permeable envelope and which portion passes around the grain. This flow partitioning can be paramount for the accurate
repre-sentation of the solute exchange between the envelope and the surrounding liquid. The influence of the stagnant-film thickness in convective conditions is yet unknown. Calibra-tion guidelines for this model have been established only for steady-state growth [23] or for slow transients [31,52], both in diffusive conditions. This now needs to be extended to con-vective conditions and to fast transients, such as at the onset of equiaxed growth. To check the validity of the mesoscopic model predictions, all the results will be compared to phase-field simulations and to an analytical model of steady-state tip growth [58]. No parameter study (i.e., interface thickness, anisotropy...) will be presented for the phase-field model since this is detailed in earlier publications [13].
Growth is initiated from a circular seed in the center of an isothermal square domain. The temperature is 1798 °C (∼ 15 K undercooling), which corresponds to a dimensionless supersaturation of Ω0= 0.185. The melt flows from the left to the right with a uniform velocity profile at the inlet and uniform pressure at the outlet. The liquid at the inlet has the nominal concentration of 𝐶0= 45at.%Al. A zero gradient of concentration in the direction normal to the boundary is imposed at the outlet. Symmetry conditions are assigned to the top and bottom boundaries. For the case without flow, zero flux boundary conditions are used for concentration and phase field on all boundaries. The domain size is 2 × 2 mm2 for the case without flow and 0.5 × 0.5 mm2for the case with flow. The larger domain size in the case without flow roughly corresponds to 23 times the diffusion length (𝐷l∕𝑉dif f) and was used to make sure the primary tip attains the steady state diffusive growth regime before interacting with the domain boundaries. The orientation of the dendrite is defined by 𝛼0, the smallest angle of the ⟨10⟩ directions of the crystal with the horizontal direction (𝑥-axis).
5.1. Purely diffusive conditions
For diffusion controlled growth (𝑣f low= 0), Fig.1shows the evolution of the dendrite and of the concentration field for the mesoscopic envelope model on the left, and for the phase-field model on the right. One can see that the dendrite grows symmetrically with the same speed for all four branches. In Fig.2we compare the velocity of the primary dendrite tips between phase field (PF) and the mesoscopic model (MS). The mesoscopic results are shown for different orientation an-gles 𝛼0with respect to the numerical mesh. It can be seen that the tip growth velocity is entirely independent of 𝛼0, which demonstrates the absence of numerical grid anisotropy. This was further confirmed by the perfect overlap of the envelope contours for different 𝛼0(not shown here). The evolution of the velocity predicted by the mesoscopic model matches the phase-field simulation very closely (Fig.2). The only significant difference is noticeable in the first second after the onset of growth. It is mostly due to the different size of the initial seed (which is larger in the mesoscopic simulations) and partly due to the steady-state assumption of the tip model in the mesoscopic model. The results are also compared to the analytical LGK [58] solution for a free dendrite tip. Both phase field and the mesoscopic model predictions closely
Liquid concentration Al [% at]
t = 4 s
t = 8 s
t = 12 s
t = 16 s
t = 20 s
2
m
m
45
46.4
MS
PF
Fig. 1:Evolution of the equiaxed grain under purely diffusive
conditions predicted by the mesoscopic envelope model (MS) and by the phase-field model (PF). Field of liquid concentration, dendrite envelope (MS), and solid-liquid interface (PF).
0 5 10 15 20 Time [s] 20 40 60 80 100 120 140 Tip velo cit y [µ m/s] PF 0˚ MS 0˚ MS 15˚ MS 30˚ MS 45˚ LGK
Fig. 2:Evolution of the primary tip velocity in diffusive growth:
results of the mesoscopic model (MS) for orientations of 𝛼0= 0°,
15°, 30° and 45° with respect to the grid are compared to the
phase-field model (PF) for 𝛼0= 0°. The dashed line shows the
LGK analytical solution [59] for the steady state.
match the theoretical steady-state solution. For the velocities, we can see that both models predict a decrease of initial high velocity to the steady value of 34 µm∕s.
5.2. Forced flow
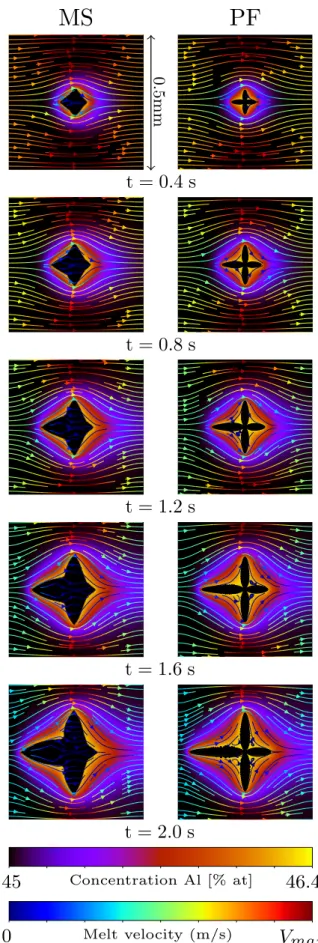
In this section mesoscopic and phase-field simulations are compared for an equiaxed dendrite in forced flow. Two cases are examined that exhibit different levels of influence of convection on the dendrite growth. In the first case the flow velocity is 40 µm∕s, that is of the order of 𝑉dif f, the free tip velocity in diffusive growth; in the second case the flow velocity is 200 µm∕s, an order of magnitude higher. Natural convection is neglected in both cases. Similar conclusions were drawn from both cases, therefore only the 200 µm∕s case is discussed in detail; the 40 µm∕s case is presented in the supplementary material. Fig.3shows the evolution of the dendrite, of the concentration field, and of the flow pattern for a forced flow of 200 µm∕s and an orientation of 𝛼0= 0°. We can remark that the convection promotes growth in the upstream direction. The lengths of the primary arms growing in the upstream and downstream directions are larger and smaller than in diffusive growth, respectively. The convec-tion of fresh liquid onto the upstream tip increases the solute concentration gradient at the tip. More solute is therefore rejected than in diffusional growth at identical supersatura-tion and the tip speed increases. The solute along the whole solid-liquid interface is washed downstream by the flowing melt, resulting in an asymmetrical concentration profile in the liquid [13]. The downstream tip therefore experiences a lower effective supersaturation, which stifles its growth. Fig.3compares the prediction of these effects by both mod-els and shows that the mesoscopic model closely matches the phase-field predictions. The main difference is the width of the dendrite envelope that is significantly larger than the length of the corresponding secondary dendrite arms in the phase-field simulation.
More detailed comparisons are shown in Fig.4. We
com-Concentration Al [% at] Melt velocity (m/s)
0
.5
m
m
MS
PF
t = 0.4 s
t = 0.8 s
t = 1.2 s
t = 1.6 s
t = 2.0 s
V
max0
45
46.4
Fig. 3:Evolution of the equiaxed grain in forced flow predicted
by the mesoscopic envelope model (MS) and by the phase-field model (PF). Field of liquid concentration, streamlines, dendrite envelope (MS), and solid-liquid interface (PF).
v
f low= 200 µm s
1 ↵0=0˚ ↵0=15˚ ↵0=30˚ ↵0=45˚ A B C D A B C D A B C D A BA
rm
l
en
gt
h
[
m
]
µ
0.
5m
m
Time [s]
Fig. 4:Equiaxed dendrite growth in forced flow at 𝑣f low= 200µm∕s ≈ 6𝑉dif f for different
orientations 𝛼0 with respect to the flow. Top : Solid-liquid interface for the phase-field
model (solid line) and dendrite envelope for the mesoscopic model (dashed line) at 𝑡 = 2 s. Bottom: Evolution of the lengths of the four primary arms. Phase field is shown in solid line
and the mesoscopic model in dashed line. Note that for 𝛼0= 0° the lengths of arms A and
C are identical and that for 𝛼0= 45° the two upstream arms (B) and the two downstream
arms (A) are identical.
0
100 200 300 400 500
45.0
45.2
45.4
45.6
45.8
46.0
46.2
46.4
PF
MS
0
100 200 300 400 500
45.0
45.2
45.4
45.6
45.8
46.0
46.2
46.4
PF
MS
0
100 200 300 400 500
0
25
50
75
100
125
150
175
200
PF
MS
0
100 200 300 400 500
0
50
100
150
200
250
300
350
400
PF
MS
200 µm s
−1X [µm]
Y [µm]
Liquid
concen
tration
Al
[%at]
200 µm s
−1X [µm]
Y [µm]
Flo
w
v
elo
cit
y
[µ
m
s
− 1]
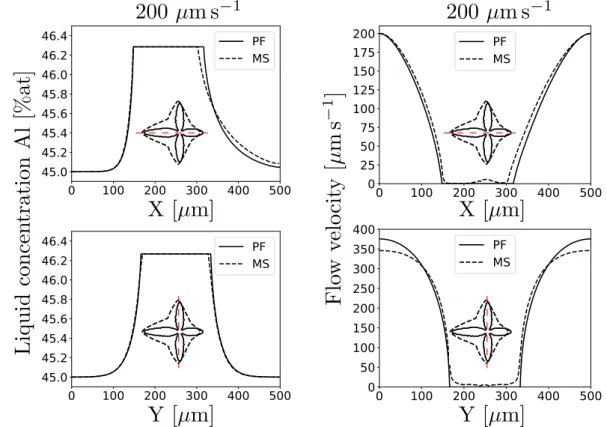
Fig. 5:Concentration profiles in the liquid around the grain (left) and velocity magnitude
profiles (right) under convection for a forced flow velocity of 200 µm∕s. Profiles along the flow direction, 𝑋 (top) and perpendicular to the flow direction, 𝑌 (bottom) are shown at 𝑡 = 1 s for the mesoscopic model (MS) and for phase field (PF). The insets show the positions of the profiles.
pare the solid-liquid interface obtained with the phase-field model and the envelope obtained with the mesoscopic enve-lope model at 𝑡 = 2 s. One can observe that the evolution of the primary arm length is almost identical for 𝛼0= 0° in both models. The graphs in the bottom part of Fig.4represent the evolution of the primary arm length for different grain orientations. For the 𝛼0 = 0° case, as described, the den-drite branch B, growing in the upstream direction, grows the fastest, the branch D, growing in the downstream direction, grows the slowest. The branches A and C grow perpendicular to the flow with same speed. For the cases at 𝛼0= 15° and 30°, there are two branches that can be qualified as “upstream” (A and B) and two “downstream” (C and D). The upstream branch that forms the smallest angle with the flow direction (branch B) is the fastest growing branch in all cases. It is followed by the other upstream branch (branch A) and then by the downstream branches, in order of decreasing angle with the flow direction, i.e., C and D, respectively. Thus the fastest and the slowest growing tips are always the two that form the smallest angles with the flow direction and that grow in the directions opposite to the flow and with the flow, re-spectively. At 45°, the dendrite is symmetrical, the upstream arm B grows faster than the downstream arm A.
The interaction of the grain with the solute transport in the surrounding liquid is shown in more detail in Fig.5, where liquid concentration profiles along both symmetry axes of the grain at 𝛼0 = 0° are shown. The profiles along the 𝑋 direction show that the PF and MS predictions are in very good agreement for the tip opposed to the flow direction (tip B) and those perpendicular to the flow (tips A and C); some differences are visible for the downstream tip (tip D). Fig.5
shows also the velocity profiles along the same axes. The
𝑋-velocity profiles agree very well, larger differences are
revealed by the 𝑌 -profiles, but they are limited to the region far from the stagnant-film. Note that weak velocities are discernible inside the mesoscopic envelopes. Contrary to the phase-field dendrites the permeable envelopes do not present an untraversable obstacle. Part of the flow thus passes trough the envelope, which is compensated by lower flow velocities far from the grain.
5.3. Influence of the permeability
As explained earlier, the permeability of the intra-granular dendritic structure depends on a characteristic scale of this structure, 𝓁c. In the Blake-Kozeny relation, Eq. (8), 𝐾 ∼ 𝓁c2. In macroscopic models [60–62] it is often assumed that for dendritic structures 𝓁cis close to the secondary dendrite arm spacing (SDAS). While this seems plausible at the macro-scopic scale, where the mushy zone consisting of millions of grains is described, it is not obvious that the same scaling should apply at the scale of a single grain. Presently, the choice of 𝓁2
c in the mesoscopic model is at best a guess; no clear calibration can be defined, even for known dendritic morphologies. Nevertheless, it is useful to quantify the sen-sitivity of the prediction of grain growth velocity and shape on the permeability. We performed several simulations using different values of 𝓁c. Fig.6shows the contours of the
den-drite envelope as a function of 𝓁cfor 𝑣f low = 200µm∕s at
𝑡= 1.8 s. We can observe that for 𝓁c<10µm the envelope shape is essentially unchanged. Larger 𝓁cincrease the growth rate of the upstream (B) and of the perpendicular primary arms (A and C) and slow down the growth of the downstream arm (D).
To understand this we need to recall that the envelope is permeable and that the flow at its surface is therefore not stag-nant. There is a flux through the envelope that increases with increasing permeability. Additionally, the flow in the vicinity of the envelope is affected by the constraint exerted by the porous envelope. If we look at the vicinity of the upstream primary tip, for example, we can notice that the velocity of the flow towards the upstream tip (B) increases with increasing permeability (𝐾 ∼ (𝓁c)2). At high enough permeability the advection of solute-lean liquid towards the tip is sufficiently enhanced to significantly increase the supersaturation felt by the tip. The tip velocity thus increases with increasing per-meability. An adverse effect is produced at the downstream tip (D), which feels a flux of solute-rich liquid from the en-velope. The dendrite arms perpendicular to the flow (A and C) experience similar effects at its flanks, corresponding to upstream and downstream secondary sidearms.
It is however important to point out that in the present case the influence of permeability on the envelope growth becomes significant only when 𝓁cis much larger than any relevant scale of the internal dendrite structure (the smallest being the SDAS) of the actual dendrite. The physical per-tinence of such large values of 𝓁cis therefore questionable. Moreover, the best agreement with the phase-field simula-tions is obtained with a moderate value, 𝓁c= 50µm. At this value the permeability is already low enough to effectively block most flow across the envelope and any further decrease of 𝓁chas only minor effects. Such low permeabilities com-pare best to phase field as in this model, the solid branches of the 2D dendrite are indeed an impassable obstacle for the flow. In essence, we can conclude that for the configuration studied here the permeability is of minor importance as long as the
A
B
C
D
50µm `c 0.1µm 1µm 2µm 5µm 10µm 50µm 100µmFig. 6:Influence of the characteristic length, 𝓁c, used for the
permeability on the shape of the dendrite envelope predicted by
the mesoscopic model. Note that the permeability 𝐾 ∼ (𝓁c)2.
The comparison is made for 𝑣f low= 200µm∕s at 𝑡 = 1.8 s. The
flow across the envelope is effectively blocked. Note that this is by no means a general conclusion but is only applicable to the present 2D case.
5.4. Effect of stagnant-film thickness
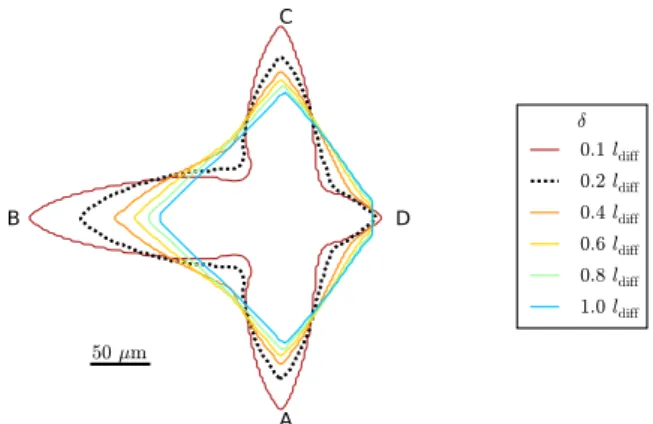
The results of the mesoscopic model depend to a cer-tain degree on the principal model parameter, the stagnant-film thickness 𝛿. We examined the sensitivity to 𝛿 in the simulations of equiaxed growth for 𝛿 equal to and smaller than the diffusion length, 𝑙dif f = 𝐷l∕𝑉dif f. Fig.7shows the dependence of the envelope shape on 𝛿. The length of the up-stream (B) and the lateral (A and C) primary arms increases markedly with decreasing 𝛿. The downstream arm (D) is virtually unaffected. As 𝛿 approaches 𝑙dif f the grain shape becomes unrealistic and the asymmetry due to flow is lost. At 𝑣f low = 200µm∕s the best fit to phase-field results was obtained with 𝛿 = 0.2 𝑙dif f. The best fit 𝛿 for the other cases are reported in Table2.
It is useful to relate the stagnant-film thickness to charac-teristic physical length scales. In the presence of convection, we can expect the matching of the tip-scale analytic solution and of the mesoscale numerical solution of the concentration field to work well only if the stagnant-film thickness, 𝛿, is smaller than the thickness of the solutal boundary layer, i.e., the layer where the solute transport is dominated by diffusion. This is because the analytic solution for the tip scale (Eq. (1)) is given for diffusive transport at the tip scale. Estimates of the boundary layer thickness can be obtained using the rela-tions proposed by Cantor & Vogel [29]. Their approximations for convection around a paraboloid tip in forced convection counter-flow give a velocity boundary layer of 2Re−1∕2𝑅
tip and a solute boundary layer of 2Sc−1∕3
Re−1∕2𝑅tip, where
Re = 𝑅tip𝑉tip∕𝜈is the Reynolds number and Sc = 𝜈∕𝐷lis the Schmidt number. Compared to the characteristic diffusion length, 𝑙dif f = 𝐷l∕𝑉dif f, this amounts to a solutal boundary layer of ∼ 0.4 𝑙dif f for the dendrite shown in Fig.7. In Fig.7 we can indeed see that 𝛿 larger than ∼ 0.4 𝑙dif f, where the matching is done beyond the solutal boundary layer, fail to give a correct envelope shape and tip speed for the upstream
A
B
C
D
50µm δ 0.1ldiff 0.2ldiff 0.4ldiff 0.6ldiff 0.8ldiff 1.0ldiffFig. 7:Influence of the stagnant-film thickness, 𝛿, on the shape
of the dendrite envelope predicted by the mesoscopic model.
The comparison is made for 𝑣f low = 200µm∕s at 𝑡 = 1.8 s.
𝓁c= 50µm in all cases.
and lateral primary branches. The downstream branch is not affected much because the boundary layers are much wider in the downstream direction. We can also notice that very small
𝛿(𝛿 ≲ 0.1 in this case), tend to overestimate the tip speed.
This is not linked to convection, but is also present in simula-tions of diffusive growth, as already shown in Refs. [23,52].
6. Columnar growth and effect of gravity
In this section, columnar dendritic growth of a 𝛽-solidifying Ti–45 at.%Al alloy is simulated for different gravity levels ranging from micro- to hyper-gravity. Gravity drives the solutal natural convection in the liquid around the growing dendrites. Depending on the gravity direction with respect to the growth direction, very different flow regimes form and result in a stable or unstable dendritic growth [7]. When grav-ity and growth vector direction are aligned, the macroscopic density gradient in the mushy zone is parallel to gravity and is therefore hydrodynamically stable. The convection is induced at a smaller scale by a lateral density gradient in the space between the primary dendrites. This gradient points from the Al–enriched liquid in the vicinity of the dendrite to the more Al–lean liquid between the primary arms. The dendrite tips experience a downward flow that stabilizes growth and the primary dendrite arm spacing (PDAS). When gravity and growth are in opposite directions, the situation is more com-plex. In addition to the lateral gradient in the interprimary space, which is now in the opposite direction, an unstable (an-tiparallel to gravity) macroscopic density gradient is present in the mushy zone. An upward flow at the dendrite tips is created that destabilizes growth, leading to a drastic decrease of the PDAS and to a so-called “branched” microstructure at higher gravity levels. Our objective is to check if the meso-scopic model can predict the microstructure evolution and the fluid flow pattern during directional growth coupled with natural convection in hypergravity. A detailed study of the physical phenomena involved in the change of the colum-nar growth pattern in a Ti–48 at.%Al alloy has already been performed experimentally and by phase-field simulations in Ref. [7].
The simulations of columnar growth were performed in a rectangular domain of 450 × 1050 µm2and solid growth was initialized from a small semicircular seed inserted at the bottom center at time 𝑡 = 0. The general coordinate system is defined in Fig.8. In the phase-field simulations the boundary conditions are periodic in the 𝑥-direction for concentration, phase field, pressure and fluid velocity. In the mesoscopic simulations symmetry boundary conditions are prescribed on the vertical boundaries. This effectively represents a somewhat different confinement for the flow, but should not prevent the simulations from representing the main effects of the coupling between convection and microstructure. A fixed concentration of 45 at.%Al is set on the top boundary. For pressure and velocity, top and bottom boundaries are isolated (normal gradient on the boundary set to zero). The computational domain is moving with the dendrite tips (i.e., moving frame calculations) maintaining a
) -20 g -15 g -10 g -5 g -4 g -3 g -2 g -1 g 0 g +5 g +15 g 5 mm z x
Fig. 8:Columnar microstructure at different gravity levels predicted by the phase-field model.
Spatiotemporal plots of the solid-liquid interface after 200 s are shown. At positive gravity, the gravity vector is oriented in the growth direction, at negative gravity it is opposite to the growth direction.The red rectangle represents the moving calculation domain.
) -20 g -15 g -10 g -5 g -4 g -3 g -2 g -1 g 0 g +5 g +15 g 5 mm z x 0 Fraction liquid 1
Fig. 9: Columnar microstructure at different gravity levels predicted by the mesoscopic
model. Spatiotemporal plots of the solid-fraction field after 200 s are shown. At positive gravity, the gravity vector is oriented in the growth direction, at negative gravity it is opposite to the growth direction. The red rectangle represents the moving calculation domain.
PF
MS
#-20 g #-15 g #-5 g #-3 g #-1 g 0 g "+5 g "+15 g
45 Concentration Al [% at] 46.4 0 Melt velocity [ms 1] Vmax
z
x
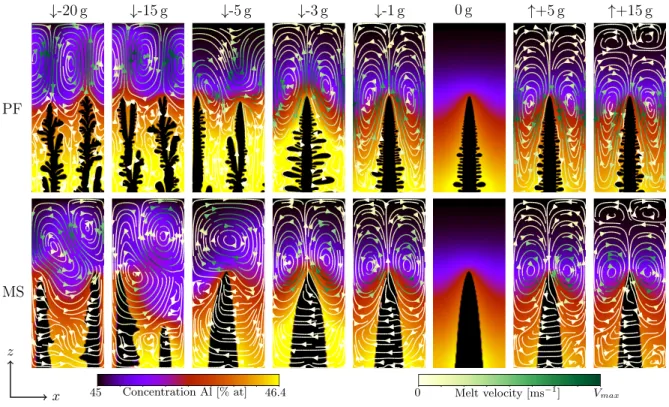
Fig. 10: Columnar dendrite growth in Ti–45 at.%Al as function of gravity level for the
phase field (PF) and the mesoscopic model (MS). Flow streamlines are superimposed onto concentration maps. 𝑡 = 150 s and the growth length is around 3 mm. Note that the
maximum velocity magnitude 𝑉max is different for each frame.
minimum distance of 450 µm of the topmost solid (the tips) to the top boundary. The thermal parameters for modeling directional solidification are a constant temperature gradient in the 𝑧-direction of 120 K∕cm and a constant cooling rate of −0.3 K∕s, which corresponds to a pulling velocity of 𝑉pull = 25µm∕s.
An interface thickness of 3 µm and a phase-field mobility of µ𝑠𝑙 = 10−2cm4J−1s−1 were chosen for the phase-field
simulations, according to the calibration of these parameters under purely diffusive conditions and steady state growth. The grid spacing is 0.75 µm for phase field and 5 µm for the mesoscopic model.
6.1. Results and discussion
The results of 2D phase-field simulations of directional growth of 𝛽-solidifying Ti–45 at.%Al show that the dendritic morphology evolution in the mushy zone strongly depends on the direction and the magnitude of the gravity vector. Fig.8
shows spatiotemporal plots of the solid-liquid interface. Note that the gravity vector is colinear with the 𝑧-direction and its sign is defined by its orientation with respect to 𝑧: positive gravity is parallel to 𝑧 and negative gravity is antiparallel to 𝑧. The microstructure remains dendritic and stable for positive and low negative gravity levels (from −3 𝑔 to 15 𝑔). The tip undercooling in steady state also varies with the gravity level. Compared to the diffusive case, the tip undercooling decreases with positive gravity (the tip position is higher in the temperature field, i.e., at a higher temperature) and increases with negative gravity levels, as long as there is no
reduction in primary spacing (i.e. up to −3 𝑔). The secondary dendrite arms become longer and more pronounced with increasing primary tip undercooling: from +15 𝑔 to −3 𝑔. At −4 𝑔, a transition between dendritic and branched structures is observed. From −5 𝑔 to −20 𝑔 the microstructure is branched with an increasing number of branching (splitting) events.
In Fig.9the spatiotemporal plots of the microstructure obtained with the envelope model are shown. They can be directly compared to the phase-field simulations in Fig.8. The same observations can be made as in the phase-field predictions. From −3 𝑔 to +15 𝑔 a single primary branch is stable. With decreasing gravity the primary tip undercooling increases and the dendrite envelope widens, representing an increasing length of the secondary branches. At −4 𝑔 the mi-crostructure starts to destabilize and tertiary branching events occur. At −15 𝑔 the PDAS finally decreases and two stable primary branches are observed. While the destabilization of the microstructure is predicted at the same gravity level as by phase field and results in a similar reduction of PDAS, the mechanism leading to the spacing adjustment is not the same. The tip splitting events predicted by phase field cannot be correctly reproduced by the envelope model because they are governed by interface kinetics that is out of the scope of the parabolic tip model that is used to describe the envelope propagation. Nevertheless, in the mesoscopic simulations the morphological instabilities are triggered but they appear as tertiary branching events.
These microstructure evolutions are closely correlated with the fluid flow patterns. In Fig.10flow streamlines are
t = 10 s
t = 20 s
t = 30 s
t = 40 s
t = 50 s
MS
PF
0
.4
5
m
m
Fig. 11:Early stage branch competition under the influence of
buoyancy-driven convection at a gravity level of −10 𝑔 for the mesoscopic model (MS) and for phase field (PF). Streamlines, dendrite envelope (MS), and solid-liquid interface (PF).
0 200 400 600 800 1000
Y [ m]
45.0 45.5 46.0 46.5 47.0Concentration Al [% at]
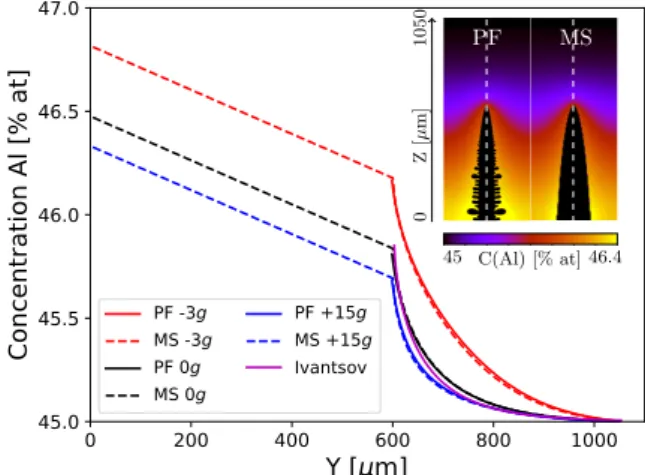
PF -3gMS -3g PF 0g MS 0g PF +15g MS +15g Ivantsov 45 C(Al) [% at]46.4 0 1050 Z [µ m] PF MSFig. 12: Concentration profiles in the liquid in front of the
primary tip at gravity levels between −3 𝑔 and +15 𝑔 for phase field (PF) and for the mesoscopic model (MS) at 200 s. The inset shows the position of the profiles. The analytical solution of the concentration profile in front of a free tip (Ivantsov) growing at the same speed is shown for comparison.
superimposed onto concentration maps at different gravity levels for a time of 150 s and are shown for both the phase field and the mesoscopic model. The flow patterns are very similar for phase field and mesoscopic model from −3 𝑔 to 15 𝑔, and differ only for higher negative gravity levels, where the morphology of the microstructure changes. For all pos-itive gravity levels the convection rolls are symmetric with respect to the dendrite centerline and the dendrite tips grow opposite to a downward flow that advects solute-lean liquid to the tip. The convection in this sense increases the con-centration gradient that drives the solute rejection from the tip into the surrounding liquid. In this case, the dendrite tip has “favorable” growth conditions [10]. As a consequence, the supersaturation required for the tip to grow at the exter-nally imposed pulling speed is reduced. The microstructure remains dendritic with a single dendrite predicted by both the phase field and the mesoscopic simulations. For gravity levels ranging from −1 𝑔 to −3 𝑔, the central dendrite remains dom-inant, with symmetric convection rolls but with an upward flow at the dendrite tip. Upward flow advects solute-enriched liquid from the interdendritic region to the dendrite tip. Com-pared to the purely diffusive case the solute gradient at the tip is reduced and the tip supersaturation increases as a result.
At higher levels of negative 𝑔 (upward flow at the dendrite tip at early stage of growth) the flow destabilizes the dendritic growth pattern. For −20 𝑔 to −5 𝑔, a change of the PDAS by is observed in the phase-field results. This change occurs at −10 𝑔for the envelope model. The mechanism of spacing adjustment predicted by the two models is quite different. In the phase-field simulations it proceeds through a splitting of the primary tip with the two resulting branches initially grow-ing tilted to the temperature gradient. One of the branches then gets eliminated and the surviving branch continues to grow roughly in the direction of the temperature gradient. In the mesoscopic simulation such events of branch splitting do not occur. Even if they did, the physical meaning could not
0 25 50 75 100 125 150 175 200
Time [s]
0 1 2 3 4Front position [mm]
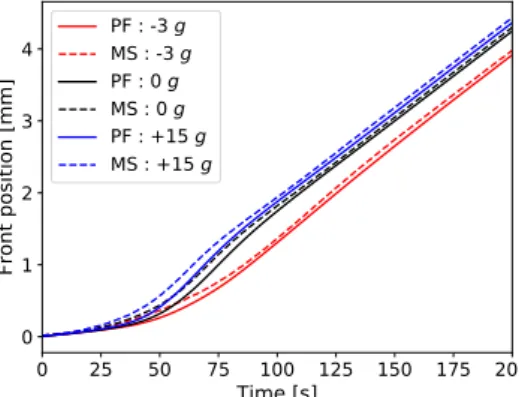
PF : -3 g MS : -3 g PF : 0 g MS : 0 g PF : +15 g MS : +15 gFig. 13:Evolution of primary dendrite arm length for gravity
levels between −3 𝑔 and +15 𝑔 obtained by phase field (PF) and by the mesoscopic model (MS).
20 15 10 5 0 5 10 15
gravity (×g)
0 10 20 30 40 50 60 70Av
er
ag
e f
low
ve
loc
ity
(
m
s
1)
PFMSFig. 14: Average flow velocity (space and time average) as
a function of gravity level for phase field (PF) and for the mesoscopic model (MS).
be the same since the tips of the branches are not directly represented in the envelope model. The spacing adjustment rather occurs through tertiary branching.
Several branching (splitting) events occur during growth, however the change of PDAS is initiated at an early stage of growth, as can be seen in Figs.8,9and16. The PDAS selection at the early stage is shown in Fig.11for −10 𝑔 between 10 s and 50 s. At 10 s one can see the upward flow along the central dendrite tip and downward flow at the sides. This flow pattern is induced by the lateral density gradient that is due to the solute rejection from the protruding tip. Between 30 s and 40 s, new branches develop on the side and start to grow faster than the central one because of favorable growth conditions induced by the downward flow. Between 40 sand 50 s, PDAS finally changes by suppression of the central branch. Although the results of the two models are not quantitatively identical, we can see that the mesoscopic model correctly reproduces the evolution sequence of the microstructure and the coupling with flow.
The influence of the convection on the solute transfer around the single primary arm that is stable between −3 𝑔 and 15 𝑔 is shown in Fig12. Concentration profiles in the liquid ahead of the tip are shown for phase field and enve-lope model at −3 𝑔, 0 𝑔 and 15 𝑔. One can clearly see that the concentration gradient ahead of the tip and the liquid
concentration at the tip (tip supersaturation) are affected by solutal convection in both directions. Fig12also shows that the mesoscopic model represents the solutal field and the tip supersaturation with good accuracy. The comparison with the analytical Ivantsov solution shows that in the diffusive regime (0 𝑔) the concentration profile ahead of the columnar tip is very close to that of a free tip, which supports the assumption taken for the estimation of the tip selection parameter, 𝜎∗ (Section4).
In Fig.13 we show the evolution of the length of the leading dendrite branch for gravity levels ranging from −3 𝑔 to +15 𝑔, i.e. in the range where dendrites remain columnar. Very good agreement of the two models can be observed. Most importantly, the influence of the gravity level on the ini-tial transient is accurately reproduced. Only slight differences between phase field and the mesoscopic model are observed during the transient. They are due to differences in tip under-cooling, which were shown to vanish in later growth stages (Fig.12). Correspondingly, the primary arm length is also similar once the initial transient is finished.
The relation between flow intensity and the gravity level is shown in Fig.14. To obtain a measure of the flow intensity, an average velocity is calculated by averaging the velocity magnitude, | ⃗𝑣 |, over space and time for 200 s of simulated time. This average flow velocity is plotted in Fig.14. One can see that the results are in very good agreement from −5 𝑔 to +15 𝑔. A significant difference is again observed in the branched growth regime, i.e. for gravity levels from −20 𝑔 to −5 𝑔.
6.2. Effect of domain size
Because the computation time with the phase-field model would be prohibitive for larger domains, the simulations in the previous section were done for relatively small domains that contain only one to two primary dendrite branches. One might wonder whether the spacing selection is affected by the confinement and in how far the simulations are representative of the PDAS selection process in a larger dendrite array. In order to address this issue, we performed mesoscopic enve-lope simulations with a domain width four times larger along the 𝑥-axis and twice larger along the 𝑧-axis (i.e., a rectan-gular domain of 1800 × 2100 µm2). These simulations were initialized with four nuclei with a spacing of 450 µm, i.e., the same initial spacing as the simulations in Section6.1. The gravity ranges from −20 𝑔 to +15 𝑔. In Fig.15the spatiotem-poral plots of the microstructure obtained with the envelope model are shown. We can see that a spacing reduction oc-curs at high negative gravity, starting at −10 𝑔, exactly as in the simulations on smaller domains in Section6.1. We can observe that the final stable spacing is somewhat larger, how-ever the threshold of spacing reduction, (−10 𝑔) is the same as in smaller confinements. For gravity from −5 𝑔 to +1 𝑔 the spacing is not modified, as observed before. The most important influence of the confinement is observed at positive gravity, where we see an increase of PDAS by elimination starting at +5 𝑔. This phenomenon has obviously not been captured by smaller domains; simulations of large dendrite
-20 g -15 g -10 g -5 g -4 g -3 g -1 g 0 g +1 g +5 g +15 g 4.5 mm z x 0 Fraction liquid 1
Fig. 15:Spatiotemporal plots of the solid-fraction field after 175 s are shown for a domain
size of 1800 × 2100 µm2. At positive gravity, the gravity vector is oriented in the growth
direction, at negative gravity it is opposite to the growth direction. The red rectangle represents the moving calculation domain.
arrays are needed to describe it correctly. The PDAS increase due to the convection in the spacing between the branches is consistent with the observations of Steinbach et al. [10], made by phase-field simulations for directional solidification of an Al-4%Cu alloy under hypergravity.
6.3. Effect of stagnant-film thickness
In Fig.16we compare the envelope shapes for a stagnant-film thickness of 0.5, 2, 4, and 8 𝛿0, respectively, where 𝛿0is the stagnant-film thickness used in the simulations presented in the previous section. We can see that the main features of the predicted microstructure are independent of the stagnant-film thickness. Dendrites remain stable for positive and for weakly negative gravity. For all 𝛿0a non-monotonous depen-dence of the tip undercooling on gravity is obtained, with the maximum primary tip undercooling being that of the colum-nar structure just before destabilization. Nevertheless, one can remark that for larger 𝛿 the destabilization starts at higher negative gravity levels. We can also observe that envelope width (secondary arm length) increases with smaller 𝛿.
7. Conclusion
The mesoscopic envelope model was applied to simu-late the evolution of equiaxed and columnar solidification microstructures of the 𝛽-solidifying Ti–45 at.%Al under the influence of forced flow and of buoyancy-driven flow at dif-ferent gravity levels, respectively. The results obtained were compared to phase-field simulations. The computational cost of the mesoscopic simulations was two orders of magnitude lower than with phase field. For the cases of columnar growth under hypergravity, the phase field simulation time was more than one month with a parallelized code using 14 threads on an Intel Xeon CPU E5-2660, versus a simulation time of 48 hours using one thread on an Intel Xeon E5-2637 v4 for a non-parallelized envelope model code.
The mesoscopic envelope model can accurately predict the asymmetric growth of equiaxed grains induced by forced flow. Concerning columnar growth under the influence of flow in hypergravity, the flow-induced transitions of PDAS as a function of gravity level are well predicted by the meso-scopic model. Nevertheless, due to its intrinsic parabolic
(a) 𝛿 = 2 𝛿0 ) -20 g -15 g -10 g -5 g -4 g -3 g -2 g -1 g 0 g +5 g +15 g 5 mm z x 0 Fraction liquid 1 (b) 𝛿 = 4 𝛿0 ) -20 g -15 g -10 g -5 g -4 g -3 g -2 g -1 g 0 g +5 g +15 g 5 mm z x 0 Fraction liquid 1 (c) 𝛿 = 8 𝛿0 ) -20 g -15 g -10 g -5 g -4 g -3 g -2 g -1 g 0 g +5 g +15 g 5 mm z x 0 Fraction liquid 1
Fig. 16: Influence of the stagnant-film thickness, 𝛿, on the
microstructure predicted by the mesoscopic model. Spatiotem-poral plots of the solid-fraction field after 200 s are shown and
can be compared to Fig.9, where 𝛿 = 𝛿0= 0.044 𝑙dif f= 5.3µm.
At positive gravity, the gravity vector is oriented in the growth direction, at negative gravity it is opposite to the growth direc-tion.
tip model, the mesoscopic envelope model cannot reproduce branched microstructures that develop as a consequence of tip splitting at strong negative gravity levels. However, it does predict the PDAS reduction at the correct gravity level. Instead of tip splitting, the spacing reduction is achieved by tertiary branching.
As shown previously [23,31] for purely diffusive cases, the stagnant-film thickness has to be chosen correctly to ob-tain reliable predictions. In equiaxed growth at a given su-persaturation a notable sensitivity of the tip speed on 𝛿 is found. In columnar growth at a given pulling speed, how-ever, only weak sensitivity of the tip supersaturation and of other related phenomena (PDAS and PDAS adjustments) is observed. The reason for this disparity is that on the one hand, the calculation of the tip speed is highly sensitive to the accuracy of the supersaturation in the stagnant-film. On the other hand, the calculation of the tip supersaturation from a speed that is imposed by the pulling rate is much less sensitive to variations.
The permeability of the grain envelope was shown to be of minor importance in 2D simulations. The most accurate results were obtained with permeability where the flow was effectively blocked by the primary arms, which reproduces the blocking of the impermeable solid structure in the phase-field simulations. The permeability is expected to be of much higher importance in 3D simulations, where the blocking effect does not exist.
Naturally, a perspective of this work is to extend the meso-scopic simulations of columnar growth in hypergravity to larger domains and to 3D. The geometry and the dimension of the problem play a critical role on the flow characteris-tics [7,63] especially on its velocity. The smaller computa-tional cost than for phase field allows 3D simulations coupled with flow to be done at the scale of the experiments without using a supercomputer. Grain motion can also be included to investigate the effect of moving equiaxed dendrite on colum-nar growth during CET.
Acknowledgements
This work was carried out as part of the GRADECET (GRAvity DEpendence of Columnar to Equiaxed Transition in TiAl Alloys) research project. A.V. gratefully acknowl-edges the support by the German Federal Ministry of Re-search through the German Space Agency DLR under con-tract FKZ 50WM1743. M.Z. and Y.S. were supported by the French State through the program “Investment in the fu-ture” operated by the National Research Agency (ANR) and referenced by ANR-11 LABX-0008-01 (LabEx DAMAS). M.C.F. was supported by the European Space Agency (con-tract 4000114221/15/NL/PG-GRADECET). A part of the required high performance computing resources was pro-vided by the EXPLOR center hosted by the Université de Lorraine. The authors thank Ralf Berger, Hervé Combeau, Janin Eiken, Alexey Matveichev, Laszlo Sturz and Ulrike Hecht for helpful discussions.
References
[1] J. Aguilar, A. Schievenbusch, O. Kättlitz,Investment casting tech-nology for production of TiAl low pressure turbine blades - Process engineering and parameter analysis, Intermetallics 19 (6) (2011) 757– 761.
[2] V. Güther, M. Allen, J. Klose, H. Clemens,Metallurgical processing of titanium aluminides on industrial scale, Intermetallics 103 (2018) 12–22.
[3] U. Hecht, C. Huang, J. Zollinger, D. Daloz, M. Založnik, M. Cis-ternas Fernández, A. Viardin, S. McFadden, L. Gránásy, J. Lapin, N. Leriche, F. Kargl,The ESA-MAP project "GRADECET" – An overview of the joint research on solidification of TiAl-based alloys un-der hypergravity and microgravity conditions, in: A. Roósz, Z. Veres, M. Svéda, G. Karacs (Eds.), Solidification and Gravity 2018, Hungar-ian Academy of Sciences – University of Miskolc, Miskolc, Hungary, 2018, pp. 27–36.
[4] S. Jana, J. Jakumeit, R. Tiefers, T. Stoyanov,Simulation of cold shuts and misruns in centrifugal casting of TiAl low pressure turbine blades, Mater. Sci. Forum 765 (2013) 155–159.
[5] M. Cisternas Fernández, M. Založnik, H. Combeau, C. Huang, J. Zollinger, U. Hecht,Effect of the Coriolis force on the macroseg-regation of aluminum in the centrifugal casting of Ti-Al alloys, IOP Conf. Ser. Mater. Sci. Eng. 529 (2019) 12033.
[6] M. Cisternas Fernández, M. Založnik, H. Combeau, U. Hecht, Ther-mosolutal convection and macrosegregation during directional solidi-fication of TiAl alloys in centrifugal casting, Int. J. Heat Mass Transf. 154 (2020) 119698.
[7] A. Viardin, J. Zollinger, L. Sturz, M. Apel, J. Eiken, R. Berger, U. Hecht,Columnar dendritic solidification of TiAl under diffusive and hypergravity conditions investigated by phase-field simulations, Comput. Mater. Sci. 172 (2020) 109358.
[8] N. Reilly,Heterogeneities in the fabrication of titanium aluminides : Characterization and control of their formation during centrifugal casting, Ph.D. thesis, Université de Lorraine (dec 2016).
[9] C. C. Battalle, R. N. Grugel, A. B. Hmelo, T. G. Wang,The effect of enhanced gravity levels on microstructural development in Pb-50 wt pct Sn alloys during controlled directional solidification, Metall. Mater. Trans. A 25 (4) (1994) 865–870.
[10] I. Steinbach,Pattern formation in constrained dendritic growth with solutal buoyancy, Acta Mater. 57 (9) (2009) 2640–2645.
[11] M. Apel, H.-J. Diepers, I. Steinbach,On the effect of interdendritic flow on primary dendrite spacing: A phase field study and analytical scaling relations, Model. Cast. Weld. Adv. Solidif. Process. (2006) 505–512.
[12] H.-J. Diepers, I. Steinbach,Interaction of interdendritic convection and dendritic primary spacing: phase-field simulation and analytical modeling, in: Solidification and Gravity IV, Vol. 508 of Materials Science Forum, Trans Tech Publications Ltd, 2006, pp. 145–150. [13] C. Beckermann, H.-J. Diepers, I. Steinbach, A. Karma, X. Tong,
Modeling melt convection in phase-field simulations of solidification, J. Comput. Phys. 154 (2) (1999) 468–496.
[14] T. Takaki, S. Sakane, M. Ohno, Y. Shibuta,Competitive growth during directional solidification of a binary alloy with natural convection: two-dimensional phase-field study, Model. Simul. Mater. Sci. Eng. 27 (5) (2019) 54001.
[15] S. Sakane, T. Takaki, R. Rojas, M. Ohno, Y. Shibuta, T. Shimokawabe, T. Aoki,Multi-GPUs parallel computation of dendrite growth in forced convection using the phase-field-lattice Boltzmann model, J. Cryst. Growth 474 (November 2016) (2017) 154–159.
[16] S. Sakane, T. Takaki, M. Ohno, Y. Shibuta, T. Aoki,Acceleration of phase-field lattice Boltzmann simulation of dendrite growth with thermosolutal convection by the multi-GPUs parallel computation with multiple mesh and time step method, Model. Simul. Mater. Sci. Eng. 27 (5) (2019) 54004.
[17] I. Steinbach, C. Beckermann, B. Kauerauf, Q. Li, J. Guo, Three-dimensional modeling of equiaxed dendritic growth on a mesoscopic scale, Acta Mater. 47 (3) (1999) 971–982.