HAL Id: hal-01135607
https://hal-mines-paristech.archives-ouvertes.fr/hal-01135607
Submitted on 25 Mar 2015HAL is a multi-disciplinary open access archive for the deposit and dissemination of sci-entific research documents, whether they are pub-lished or not. The documents may come from teaching and research institutions in France or abroad, or from public or private research centers.
L’archive ouverte pluridisciplinaire HAL, est destinée au dépôt et à la diffusion de documents scientifiques de niveau recherche, publiés ou non, émanant des établissements d’enseignement et de recherche français ou étrangers, des laboratoires publics ou privés.
A cost analysis of the Copenhagen emission reduction
pledges
Olivia Ricci, Sandrine Selosse
To cite this version:
Olivia Ricci, Sandrine Selosse. A cost analysis of the Copenhagen emission reduction pledges. [Re-search Report] Working Paper 2013-01-08, Chaire Modélisation prospective au service du développe-ment durable. 2013, pp.12 - Les Cahiers de la Chaire. �hal-01135607�
Les Cahiers de la Chaire
Chair
e Modé
lisa
tion pr
ospectiv
e au se
rvice du dé
veloppe
me
nt dur
able
A cost analysis of the
Copenhagen emission reduction pledges
Olivia RICCI and Sandrine SELOSSE
January 2013
A cost analysis of the Copenhagen emission reduction pledges
Olivia Ricci and Sandrine Selosse
Mines ParisTech, Centre for Applied Mathematics Rue Claude Daunesse, BP207, 06904 Sophia Antipolis, France olivia.ricci@mines-paristech.fr, sandrine.selosse@mines-paristech.fr
Abstract
As part of the Copenhagen Accord, countries have submitted emissions reduction pledges for 2020. Using a long term optimization model (TIAM-FR), we evaluate the implications of these submissions for emission reductions, carbon prices and total cost of the energy system. Our study finds that the pledges are not sufficient to meet the global recommended 2-2.4°C objective. Furthermore, reaching the overall 2°-2.4C objective would involve significant costs for China and India that explains the difficulty of international negotiations.
Keywords
Global warming, Copenhagen Accord, long term optimization model, abatement cost
Acknowledgment
This research was supported by the Chair Modeling for sustainable development, driven by MINES ParisTech, Ecole des Ponts ParisTech, AgroParisTech, and ParisTech, supported by ADEME, EDF, RENAULT, SCHNEIDER ELECTRIC and TOTAL.
Les Cahiers de la Chaire – Janvier 2013
2
1. Introduction
Global warming is in essence an economic and political problem. The atmosphere is a global public good. Greenhouse gas (GHG) emissions contributing to global warming have the same damaging effect regardless of the country in which they originate. All regions of the world are affected regardless of whether and to what extent they contribute to the problem. Protecting the atmosphere and therefore preventing global warming implies a drastic reduction in total greenhouse gas emissions. However, in the absence of an international agreement on emissions control, countries adopt free-riding behaviours. Each country counts on others to reduce emissions and to incur the resulting abatement cost. The Kyoto Protocol was the first international agreement in which some countries (Annex I to the protocol) committed to emission reduction targets on the period 2008-2012. A cap-and-trade system was introduced to enable the emergence of an international carbon price in order to efficiently to attain the overall objective. The protocol’s impact has however been limited, because of the lack of commitments by rapidly growing emerging countries such as China, India and Brazil, and the non-ratification of the United States. The challenge of the Copenhagen summit in 2009 was to determine the rules for the post-Kyoto period. It was therefore essential to ensure the ratification of a global agreement on emission reduction targets and to include all major industrialized and emerging countries. Even if negotiations during the summit failed to reach a global agreement, in late January 2010 some countries including major emerging nations pledged their commitments to the United Nations Framework Convention on Climate Change (UNFCCC) as part of the Copenhagen Agreement. Emissions control commitments now cover 80% of 2005 global GHG emissions compared to barely more than a quarter for the Kyoto Protocol.
Those commitments, which have very different terms and conditions, remain to be evaluated. In fact, the Copenhagen Accord has adopted a different approach to the Kyoto Protocol by allowing “variable geometry” commitments depending on the country (Casella et al. 2010). Annexe I countries have committed to reducing emissions on an absolute basis while all major emerging counties made commitments in relative terms. For instance, China and India pledged to reduce emissions per unit of GDP relative to 2005. Published analysis of the Copenhagen pledges converge to the same conclusion: if the national commitments made in Copenhagen reflect a significant shift relative to trend scenarios, however, this shift remains far removed from the IPCC recommendations to limit temperature increase of over 2°C (Dellink et al. 2010; Den Elzen et al. 2011a, Casella et al. 2010; Peterson et al. 2011; Criqui and Ilasca 2010; Stern and Taylor 2010). Peterson et al. (2011) also showed that the pledges are not costly in either GDP or welfare terms. With partial and general equilibrium approach empirical studies found that the cost for developed countries is less than 0.5% of GDP in 2020 and that the effects are more heterogeneous across developing countries (Saveyn 2011; den Elzen et al. 2011b; Peterson et al.2011).
We contribute to the growing body of literature on the environmental and economic impact of the Copenhagen commitments by introducing the pledges in the bottom-up optimisation model TIAM-FR. The model depicts the energy system over the period 2005-2050 in such a way as to minimise the net total cost of the system under a number of environmental, technological and demand constraints. To evaluate those commitments we have considered the most optimistic pledges for 2020 and made assumptions on the 2050 targets based on announced political ambitions of each country. We then compared those pledges to a business-as-usual scenario and to a global scenario compatible with the IPCC
Les Cahiers de la Chaire – Janvier 2013
3
consensual 2-2.4°C objective (IPCC, 2007) where all countries are constrained by a global mitigation target.
We aim to answer the following questions:
- Can we reach the 2°C with the most favourable pledges announced by countries? - What are the induced regional energy system costs of those two climate scenarios?
2. Model and climate policies
2.1 TIAM-FR model
This analysis is based on TIAM-FR model (the French version of the TIMES Integrated Assessment Model) a bottom-up optimization model developed under the Energy Technology Systems Analysis Program (ETSAP). It depicts the world energy system with a detailed description of different energy forms, resources, technologies and end-uses (Ricci and Selosse 2012). End-use demands (i.e. energy services) are based on socio-economic assumptions and are exogenous over the planning horizon (2005-2050). The basic principle of the model is a large linear optimization of substitution possibilities in the energy system between explicit technologies and commodity flows under constraints. The model assumes perfect markets and foresight therefore, it is suitable for normative analysis. The model minimises the total discounted cost of the energy system over the entire model horizon.
The model is geographically integrated in 15 global regions (Industrialized countries: Australia-New Zealand (AUS); Canada (CAN), United-States of America (USA), Western Europe (EU-15, Iceland, Malta, Norway and Switzerland, WEU), Eastern Europe (EEU), Japan (JPN); Fast developing countries: India (IND), China (includes Hong Kong excludes Chinese Taipei, CHI); Developing countries: Africa (AFR), Central and South America (CSA), Middle-East (includes Turkey, MEA), Mexico (MEX), South-Korea (SKO), Other developing Asian countries (includes Chinese Taipei and Pacific Islands, ODA), Former Soviet Union (include the Baltic states, FSU)). The regions are linked by energy trading variables. The trade variables transform the set of regional modules into a single multiregional energy model, where actions taken in one region may affect all other regions. This feature is essential when global as well as regional energy and emission policies are simulated. For each region, a total net present value of the stream of annual costs, discounted to the year 2005 is computed. These regional discounted costs are then aggregated into a single total cost which is the objective function to be minimized by the model. Annual costs include investment costs, operation and maintenance costs, costs of fuels (mining and imports), the cost of trade and the residual value of technologies at the end of the horizon.
The objective function is:
1 , ∗ ,
∈
where NPV is the net present value of the total cost; ANNcost(r,y) is the total annual cost in region r and year y; d(r,y) is the discount rate, refy is the reference year for discounting, years is the set of years and R the set of regions (Loulou, 2008).
Les Cahiers de la Chaire – Janvier 2013
4
Through its integrated climate module, the model makes it possible to analyse and make assumptions on atmospheric GHG concentrations and temperature changes. It integrates CO2, CH4 and N2O.
2.2 Climate policies
Two climate scenarios and a business-as-usual (BAU) scenario are simulated in the model:
- BAU scenario: In the BAU scenario, no climate policy is assumed.
- Glob_50 scenario: The Glob_50 scenario assumes that world CO2 emissions are reduced by 50% in 2050 compared to 2000 level. This scenario is compatible with the UNFCCC consensual 2-2.4°C objective (as specified by IPCC, 2007). All regions are bounded by the global climate constraint.
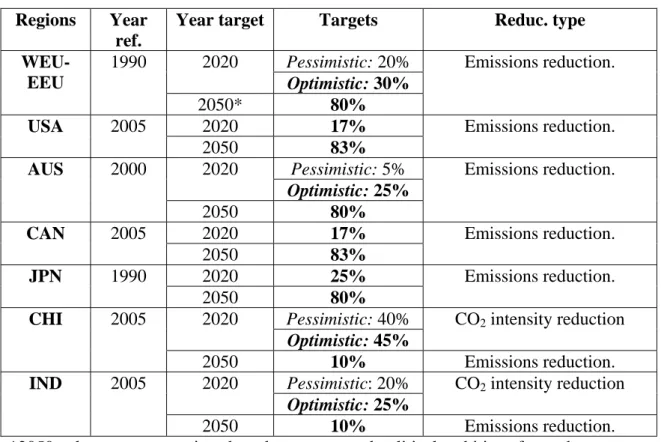
- Cop_15 scenario: This scenario represents the most optimistic CO2 mitigation targets by 2020, as expressed in the Copenhagen Agreement by Europe, the United States, Australia, Canada, Japan, China and India. Targets for 2050 were assumed according to political ambitions of each country expressed in the literature. This is a regional scenario where only those countries are bounded by the climate constraint. Table I presents the Copenhagen pledges.
Table I: Cop 15 targets and 2050 assumptions for CO2 emissions
Regions Year ref.
Year target Targets Reduc. type
WEU-EEU
1990 2020 Pessimistic: 20% Emissions reduction.
Optimistic: 30%
2050* 80%
USA 2005 2020 17% Emissions reduction.
2050 83%
AUS 2000 2020 Pessimistic: 5% Emissions reduction.
Optimistic: 25%
2050 80%
CAN 2005 2020 17% Emissions reduction.
2050 83%
JPN 1990 2020 25% Emissions reduction.
2050 80%
CHI 2005 2020 Pessimistic: 40% CO2 intensity reduction
Optimistic: 45%
2050 10% Emissions reduction. IND 2005 2020 Pessimistic: 20% CO2 intensity reduction
Optimistic: 25%
2050 10% Emissions reduction. *2050 values are assumptions based on announced political ambitions for each country except China and India when we purposely chose a stringent emission reduction target
Les Cahiers de la Chaire – Janvier 2013
5
3. Results
The results focus on the impact of the climate policies on CO2 emissions and energy system costs.
3.1. Environmental impact of climate policies
In the BAU scenario, the atmospheric concentration of CO2 reaches 472 ppm in 2050, while beyond 400 ppm CO2, it will not be possible to stabilise global warming below 2-2.4°C (IPCC, 2007). In Cop_15 atmospheric CO2 concentration continues growing to reach 433 ppm in 2050. Meanwhile, the global constraint (Glob_50) that consists in reducing CO2 emissions by 50% compared to the year 2000 allows a stabilization of the atmospheric concentration of CO2 at 403 ppm in our model. To meet the 2-2.4°C target (Glob_50), global CO2 emissions should decrease by 4.47 Gt by 2020 and by 40.99 Gt by 2050 compared to the BAU pathway. However, in Cop_15 global emissions are only reduced by 2.23 Gt by 2020 and by 28.46 Gt by 2050 compared to the BAU. Table II shows how the emission reduction effort is shared out between countries in the two target scenarios.
Table II: CO2 emissions reductions compare the BAU (Gt CO2)
Regions 2020 2050
Glob_50 Cop_15 Glob_50 Cop_15 Industrialized countries -1.138 -2.174 -11.54 -13.58 Fast developing countries -1.405 -0.135 -17.87 -15.067 Developing countries -1.927 +0.072 -11.57 +0.181
World -4.47 -2.237 -40.99 -28.46
In Cop_15, CO2 emissions are primarily led by industrialized countries in 2020. In 2050, ambitious assumptions for China and India (10% emission reductions) lead to a reduction of 15 Gt of CO2 emissions compare to the BAU. India and China contribute more than 50% of the overall objective. Glob_50 benefits industrialized countries in 2020 and 2050 compare to Cop_15, while developing countries are heavily constrained in 2020 and 2050. Contribution from fast developing countries is also higher in this scenario.
We find that the optimistic commitments pledged by countries in Cop_15 do not reduce emissions enough in 2020 and, even favourable assumptions for 2050 are not sufficient to meet the global 2-2.4°C objective. Moreover, to achieve the expected global objective we show that fast developing countries should reduce their emissions to a greater extent and that developing countries will need to participate to CO2 emission reduction efforts.
3.2. Economic impact of climate policies
This section evaluates the energy system cost implications of the two climate scenarios. The total system cost resulting from the Copenhagen pledges (Cop_15) and the global constraint (Glob_50) consists of investment cost, variable cost, cost of fuels (mining, import), annual fix operation and maintenance costs as well as the cost of trade (import-export). Table III shows the abatement costs and carbon marginal cost (carbon price) per regions.
In Cop_15, total system abatement cost expressed as the cost of additional mitigation expenditure compared to the BAU scenario in 2020 is estimated at US$ 61 billion (increase of 0.5% compare to the BAU). The largest share of this cost is incurred by industrialized
Les Cahiers de la Chaire – Janvier 2013
6
countries (92% of the global cost). Abatement cost is relatively high for Europe, Australia and Japan. These are also the countries with the highest emission reduction constraint for 2020 (table I). The carbon marginal costs are also the highest for those regions, reflecting the severity of the constraint (34 USD/tCO2 for Australia, 58 USD/tCO2 for Europe and 92 USD/tCO2 for Japan). In 2050, fast developing countries (India and China) are more constrained by our emissions reductions assumptions than their commitments for 2020, therefore additional abatement costs (compared to BAU 2050) are higher for those regions (about US$ 600 billion). In 2050, the marginal carbon cost reaches 447 USD/tCO2 in Japan, 245 USD/tCO2 in Europe, 86 USD/tCO2 in China and 75 USD/tCO2 in India.
In Glob_50, the model minimises the global cost of the system. Abatement cost is higher than Cop_15 for almost all developing countries and it increases sharply for China and India from 2020. In 2050, 45% of the total abatement cost is incurred by China. Developing and industrialized countries contribute to the global abatement cost at respectively 22% and 23%. Japan and Europe, where marginal abatement costs are high benefit from this policy. In 2050, abatement costs in those countries are 60% less important than in Cop_15. The carbon price in Glob_50 for all regions is 11 USD/tCO2 in 2020, 48 USD/tCO2 in 2030, 74 USD/tCO2 in 2040 and 94 USD/tCO2 in 2050.
The additional global discounted cost on the period 2005-2050 with a discount rate at 5% (in absolute terms, compared to the BAU) is US$ 3610 billion in Glob_50 and US$ 3050 billion in Cop_15. In relative terms it represents an increase of 2% in the global scenario and of 1.6% in Cop_15. In Glob_50, the countries with the lowest discounted cost are industrialized countries. Even if this last scenario minimises the global discounted cost of the system it appears to be costly for fast developing and developing countries. For instance, the actualised cost of the system increases by 6.3% compare to the BAU for China, by 5.8% for India and by 3.1% for Africa.
Table III: Abatement costs and carbon prices per regions
Regions
Regional abatement cost (M US$)* Carbon marginal cost in Cop_15 (USD/tCO2) Glob_50 Cop_15 2020 2050 2020 2050 2020 2050 AFR 3,542 40,412 259 13,585 - - AUS 3700 6,114 2,877 660 34 41 CAN -886 6,784 727 4,443 12 16 CHI 24,676 639,203 2,353 493,888 - 86 CSA 5,203 39,885 3,523 6,533 - - EEU 1,345 35,195 18,616 49,629 58 245 FSU 1,897 75,136 -1553 4,608 - - IND 6,207 147,698 -97 81,294 - 70 JPN 31 24,424 17,842 88,034 92 447 MEA -462 36,374 3,879 -9427 - - MEX 847 12,518 1,014 2,103 - - ODA 657 87,752 -4112 2,599 - - SKO 2834 30,722 -503 -1453 - - USA -1658 181,594 75 251,722 - 183 WEU 3521 87,561 16,575 226,091 58 245
*The regional abatement cost is the cost of additional mitigation expenditure compared to the BAU scenario for each region. Negative sign indicates benefits due to exports.
Les Cahiers de la Chaire – Janvier 2013
7
4. Conclusion
This paper assesses the environmental and economic effects of the Copenhagen Accord through a specific analysis of the pledges announced by countries in 2010. It compares it with the least cost option of a global agreement compatible with the 2°C target. Even applying the most ambitious Copenhagen pledges for 2020 and favourable assumptions for 2050, the emissions trend remains incompatible with the 2°C recommendation. Furthermore, reaching the overall 2°C target involves significant costs for China and India that explains the difficulty of international negotiations. The 2°C objective seems very unlikely unless large financial transfers for financing abatement cost in emerging countries are considered.
5. References
Casella, H., Delbosc, A., de Perthuis, C. (2010) “Cancun: Year One of the Post-Copenhagen Era” Climate Report n°24, CDC Climat Research
Criqui, P., Ilasca, C. (2010) “Les engagement pris à Copenhague et la question de la comparabilité des efforts” Note de travail n°6/2010 LEPII.
Dellink, R., Briner G.,Clapp,C. (2010) “Costs, Revenues, and Effectiveness of the Copenhagen Accord Emission Pledges for 2020” OECD Environment Working Papers, No.22, OECD Publishing.doi:10.1787/5km975plmzg6-en.
den Elzen, M.G.J., Hof, A.F., Roelfsema, M. (2011a) “The emissions gap between the Copenhagen pledges and the 2°C climate goal: Options for closing risks that could widen the gap” Global Environmental Change 21, 733-743
den Elzen, M.G.J., et al. (2011b) “The Copenhagen Accord: abatement costs and carbon prices resulting from the submissions. Environnemental Science & Policy 14, 28–39.
IPCC (Intergovernmental Panel on Climate Change) (2007) “Climate Change 2007, Fourth Assessment Report (AR4)” Cambridge University Press, Cambridge.
Loulou R. (2008) “ETSAP-TIAM: the TIMES integrated assessment model. Part II: mathematical formulation” Computational Management Science 5: 41-66.
Peterson, E.B., Schleich, J., Duscha, V. (2011) “Environmental and economic effects of the Copenhagen pledges and more ambitious emission reduction targets” Energy Policy 39, 3697–3708.
Ricci, O., Selosse. S (2012) “Global and regional potential for bioelectricity with carbon capture and storage” Energy Policy 52, 689-698
Saveyn, B., Van Regermorter, D., Ciscar, J.C (2011) “Economic analysis of the climate pledges of the Copenhagen Accord for the EU and other major countries” Energy Economics 33, S34-S40
Les Cahiers de la Chaire – Janvier 2013
8
Stern, N., Taylor, C. (2010) “What do the appendices to the Copenhagen Accord tell us about global greenhouse gas emissions and the prospects for avoiding a rise in global average temperature of more than 2.8°C?” Centre for Climate Change Economics and Policy Grantham Research Institute on Climate Change and the Environment
Contact
Nadia MAÏZI
Directrice du Centre de Mathématiques Appliquées (CMA)
MINES ParisTech / CMA Rue Claude Daunesse BP 207
06904 Sophia Antipolis
Tel: +33(0)4 97 15 70 79 / Fax: +33(0)4 97 15 70 66 Courriel: nadia.maizi@mines-paristech.fr
Jean-Charles HOURCADE
Directeur du Centre International de Recherche sur l’Environnement et le Développemenr (CIRED)
CIRED
Campus du Jardin Tropical 45 avenue de la Belle Gabrielle 94736 Nogent sur Marne Cedex
Tel: +33(0)1 43 94 73 63 / Fax: +33(0)1 43 94 73 70 Courriel: hourcade@centre-cired.fr
Site Web: http://www.modelisation-prospective.org
Contact de la Chaire: contact@mail.modelisation-prospective.org


![[PDF] Programmation web université guide de formation | Cours Informatique](data:image/gif;base64,R0lGODlhAQABAIAAAP///wAAACH5BAEAAAAALAAAAAABAAEAAAICRAEAOw==)