HAL Id: hal-00316781
https://hal.archives-ouvertes.fr/hal-00316781
Submitted on 1 Jan 2000
HAL is a multi-disciplinary open access
archive for the deposit and dissemination of sci-entific research documents, whether they are pub-lished or not. The documents may come from teaching and research institutions in France or abroad, or from public or private research centers.
L’archive ouverte pluridisciplinaire HAL, est destinée au dépôt et à la diffusion de documents scientifiques de niveau recherche, publiés ou non, émanant des établissements d’enseignement et de recherche français ou étrangers, des laboratoires publics ou privés.
Plasma convection at high latitudes using the EISCAT
VHF and ESR incoherent scatter radars
J. M. Holt, A. P. van Eyken
To cite this version:
J. M. Holt, A. P. van Eyken. Plasma convection at high latitudes using the EISCAT VHF and ESR incoherent scatter radars. Annales Geophysicae, European Geosciences Union, 2000, 18 (9), pp.1088-1096. �hal-00316781�
Plasma convection at high latitudes using the EISCAT VHF
and ESR incoherent scatter radars
J. M. Holt1, A. P. van Eyken2
1MIT Haystack Observatory, Route 40, Westford MA 01886, USA 2EISCAT Scienti®c Association, N-9020 Tromsdalen, Norway
Received: 31 January 2000 / Revised: 16 June 2000 / Accepted: 21 June 2000
Abstract. The recent availability of substantial data sets taken by the EISCAT Svalbard Radar allows several important tests to be made on the determination of convection patterns from incoherent scatter radar results. During one 30-h period, the Svalbard Radar made 15 min scans combining local ®eld aligned obser-vations with two, low elevation positions selected to intersect the two beams of the Common Programme Four experiment being simultaneously conducted by the EISCAT VHF radar at Tromsù. The common volume results from the two radars are compared. The plasma convection velocities determined independently by the two radars are shown to agree very closely and the combined three-dimensional velocity data used to test the common assumption of negligible ®eld-aligned ¯ow in this regime.
Keywords: Ionosphere (auroral ionosphere; polar ionosphere) ± Magnetospheric physics (plasma convection)
1 Introduction
Since, the early 1980s, the mainland UHF and VHF radars (Folkestad et al., 1983; Baron, 1984) have been operated in beam-swinging and two-beam modes in a series of very successful experiments to measure plasma convection velocities in the region north of the Scandi-navian mainland. These experiments were initially conducted as United Kingdom special programmes using the UHF radar (van Eyken et al., 1984), moved onto the VHF radar when this became available and were subsequently adopted as Common Programme Four (CP4).
In early 1997, the ®rst attempts to determine convection velocities by beam-swinging the EISCAT Svalbard Radar (ESR, Wannberg et al., 1997) antenna
were attempted. The ®rst 30-h experiment with both the mainland VHF and Svalbard radars provided a dataset which has been used to compare the basic ionospheric parameters derived by the two facilities. The availability of convection velocity data determined simultaneously by two independent instruments covering the same geographical area allows precise, three-dimensional velocity vector determination to the north of the tristatic coverage region of the mainland radar for the ®rst time. The availability of three-dimensional data also allows practical testing of the crucial assumption that ®eld-aligned ¯ows can be neglected when interpreting CP4, and similar two-dimensional, high-latitude datasets.
These comparisons are essential before the extended latitudinal coverage of the EISCAT mainland and Svalbard radar systems can be exploited to measure crucial plasma convection parameters in association with other, existing and planned radar facilities. 2 Method
2.1 Mainland VHF radar
CP4 uses multiple 900 ls pulses with the VHF radar in split-beam mode to measure both towards the geo-graphic north and about 14° west of north simulta-neously. Each of the two VHF klystrons is used to drive one half of the antenna in circular polarisation. The antenna is directed at the minimum elevation of 30° and is electrically phase steered to generate the two beams. Identical modulations and receiver gating are used on the two halves to produce two identically range gated pro®les, with 65 km sampling and 135 km range reso-lution, in each integration period. Corresponding range gates along the pair of beams lie approximately equal distances either side of the local direction perpendicular to the magnetic L-shells.
The raw data are written to the input memory of the correlator as two successive streams, with the boresight data preceding that from the western beam. A basic integration period of 10 s was used, but the data were subsequently post-integrated for one minute before processing with GUISDAP 1.65 (Lehtinen and Huuskonen, 1996) to yield electron density, electron
Correspondence to: A. P. van Eyken e-mail: [email protected]
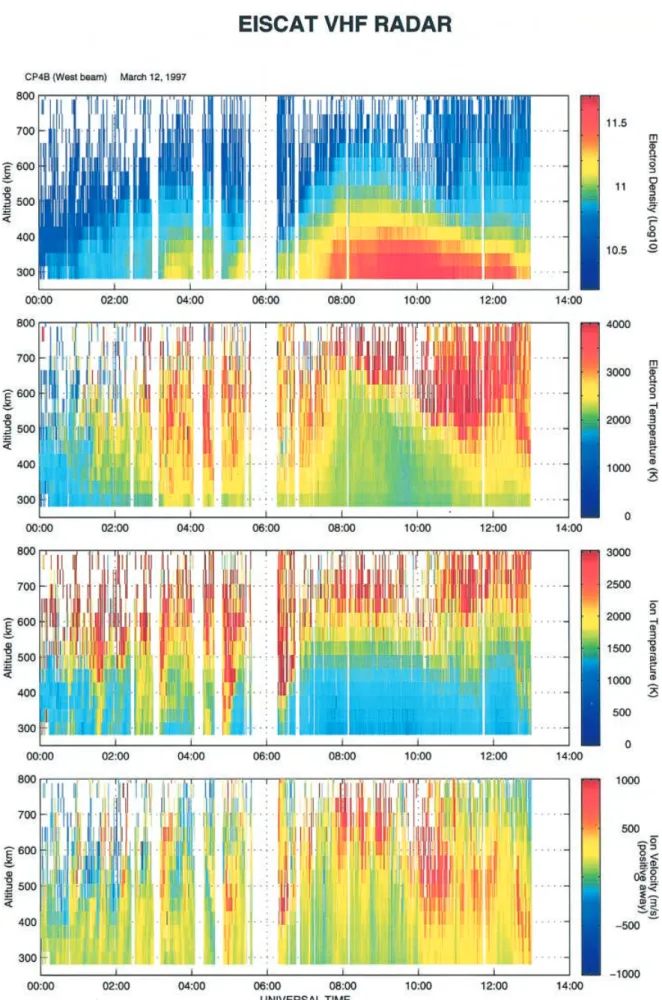
Fig. 1. a Electron density, b electron temperature, c ion temperature and d line-of-sight velocity determined for the western beam, CP4, between 0000 and 1300 UT 12 March
temperature, ion temperature and ion line-of-sight (los) velocity. Useable results are obtained from ranges approaching 80°N under favourable conditions. Figure 1 shows the four basic derived parameters from the latter part of the experiment on the western beam; note the clear velocity feature which transits from north to south across the ®eld of view.
CP4 is well suited to studies of ionospheric ¯ows in and to the north of the auroral zone, where the eect of the solar wind causes the plasma to stream over the pole away from the Sunward side of the Earth. However, during the day, and particularly around the local time sector of the cusp, the regions of greatest interest are far to the north and lie on the periphery of the radar ®eld of view, or even beyond (a major reason for the construc-tion of the EISCAT Svalbard Radar). During the minimum of the solar cycle, the latitudinal range of CP4 is considerably reduced due to the low ionisation density levels in the topside ionosphere. Nevertheless, good results are obtained to well above the F-region peak.
2.2 EISCAT Svalbard Radar
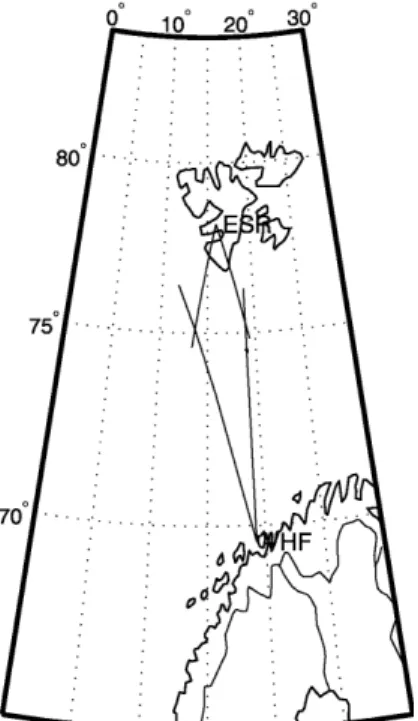
The ESR will typically be directed northwards from Svalbard. The interpretation of beam-swinging data will then become considerably more dicult as the pairs of beams may probe quite dierent plasma regimes and may indeed not even lie in the same plasma convection cell. However, the initial experiments have employed beam directions oriented generally towards the south, allowing a direct overlap with the present service area of the mainland systems, particularly CP4. The envelope of operations of the ESR at any time is limited to those directions in which the correct functioning of the aircraft-detection radar, and associated transmitter interlocks, has been demonstrated. At the time of this experiment, operations were restricted to elevations greater than 45°. Within this limitation, southward pointing directions from Longyearbyen were selected to give two beams which intersected matching gates along each of the two VHF beam directions employed in CP4. The common volumes between the two radars were located at about 420 km, well above the F-region peak, but nevertheless at an altitude where the topside ionisation density was suciently large to provide excellent signal returns to both radars. The geometry of the experiment is illustrated in Fig. 2.
Since this was an initial experiment, a relatively slow scan was adopted at the ESR with the antenna remain-ing for ®ve minutes at each of the three positions, two being low-elevation and the third ®eld-aligned. One minute post integrations were made to provide adequate statistics in the derived ionospheric parameters while restricting the data output to reasonable levels. Thus there were ®ve post-integrations for each dwell position, a short part of the ®rst of which represented data accumulated whilst the antenna was in motion.
The ESR pulse scheme used was the basic GUP0 code (Wannberg et al., 1997) used for the early ESR
operations. GUP0 is a multi-frequency, long pulse experiment intended for F-region and topside studies. This scheme uses four long pulses transmitted sequen-tially within each 6720 ls cycle to ®ll more than 80% of the available duty cycle (25%) of the transmitter. The four pulse group is transmitted on dierent frequencies in successive inter-pulse periods (ipps) in order to position the ®rst ambiguous range returns beyond 2000 km. A total of six receiver channels are used, background and calibration data being accumulated on channels without transmission in particular ipps, and the whole cycle repeats after every fourth ipp. In the original scheme, the four pulses were of equal length at 360 ls each. However, this lead to an unacceptable low-altitude clutter performance and the last pulse was therefore reduced to only 150 ls (for a total duty cycle of 18%). The basic integration time was 10 s, after which approximately 700 kBytes of raw, lag-pro®le, data were dumped to the local disk. Six such dumps were integrated together, allowing the construction of rea-sonable statistics, and processed by the GUISDAP 1.65 analysis program. The lag-pro®le matrix data was gated to produce a data set similar to those familiar from other radars. All frequency pairs were combined and the data from all such pairs further combined at each range where available. Since the receivers are opened simulta-neously on all frequencies, the altitude coverage of the dierent frequencies varies depending on their position within the transmit cycle. Thus the data in the range approximately 100±150 km arise from the short pulse only, while those from approximately 150±200 km include one additional long pulse, those between 200± 250 km include two long pulses and those beyond 250 km include data from all four pulses. The raw pro®les have been corrected to allow for variations in
Fig. 2. Sketch map of the observing directions from the EISCAT VHF and ESR facilities
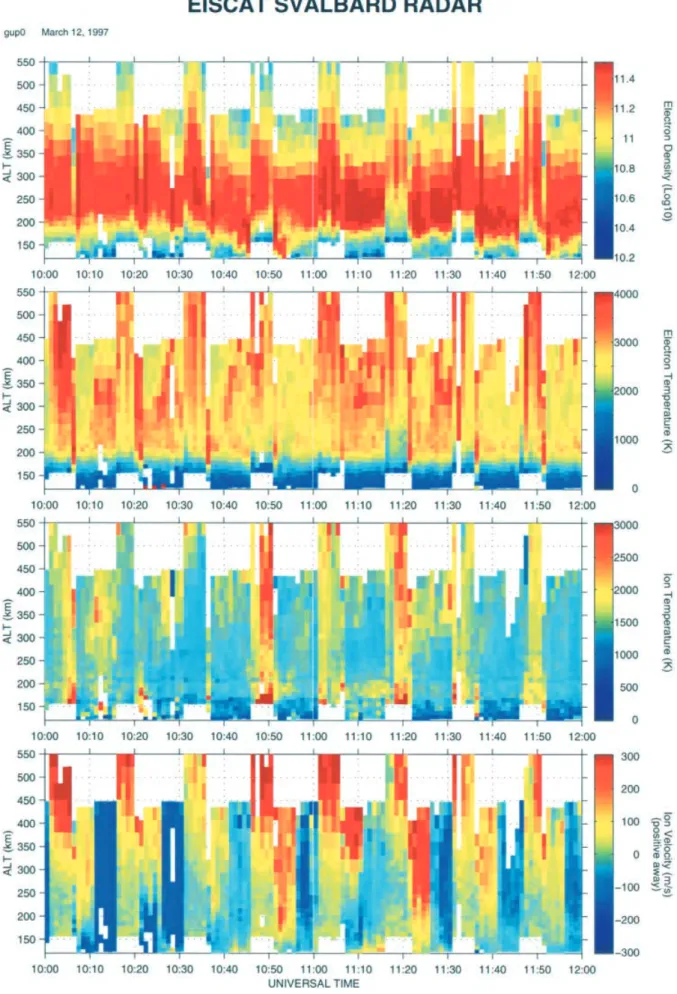
Fig. 3. a Electron density, b electron temperature, c ion temperature and d line-of-sight velocity determined by the Svalbard radar between 1000 and 1200 UT on 12 March, 1997
the noise ¯oor of the receiver throughout the ipp. Fitted parameters were electron density, electron temperature, ion temperature and ion line-of-sight velocity (Fig. 3).
The experimental period fell during an international co-ordinated incoherent scatter observation, day as-signed to the SUNDIAL project and the Millstone Hill (Foster et al., 1985) and Sondrestromfjord (Kelly et al., 1995) radars were also running in modes suitable for the derivation of convection velocities. The amalgamation of the data from these instruments, together with the full VHF and ESR data sets will be addressed in a later paper.
2.3 Data processing
The GUISDAP package presently produces output in a proprietary format but we have adapted a routine (used to make the radar data available over the WWW in real time) to produce ASCII data ®les which could be read directly into the MADRIGAL (Holt and Emery, 1996) database at Millstone Hill. This allowed the data sets to be stored, visualised and further processed using com-mon tools which support the standard interfaces of the database. This intermediate step will no longer be necessary in later versions of the GUISDAP package, which will produce output adhering to the NCAR standard directly.
With the data from both radars available in standard form, MADRIGAL database tools were used to bin the data points by time, geographic position and altitude allowing the extraction of the data corresponding to the two overlapping regions. When the geographic positions of the data points were computed using standard MADRIGAL library routines, the `overlapping' regions were found not to overlap quite as closely as had been intended, indicating the presence of some incompatible assumptions in the various calculations of range and altitude. However, the appropriate gates lie within 20 km of each other which is suciently small compared with the pulse lengths (75 km for the VHF radar and 50 km for the ESR) and beam widths (about 12, and 6 km respectively) to allow a direct comparison of the derived parameters.
3 Results
The horizontal size of the bins was 1° in latitude and 6° in longitude in order to include both beam directions for each radar. In addition to the directly measured parameters, this permits east and north velocity com-ponents to be determined from the line-of-sight veloc-ities by computing a least-squares ®t to the line-of-sight velocities within each bin (Holt et al., 1984). In each case, the usual assumption that V parallel is insigni®cant has been made, but it should be noted that any such ®eld-aligned velocity will have a greater eect in the ESR data due to the higher elevations currently employed. The perpendicular velocity components are assumed to be constant within the bin. If the vector
velocity is not constant, the derived components may be in error, which is unavoidable with monostatic beam-swinging experiments. The binning technique has three primary advantages over the more usual method of simply combining two line-of-sight measurements to determine two vector components. First, the technique is very general, which simpli®es determining vector velocities from new experiments. Second, the statistical error in the determination is reduced because more than two measured line-of-sight velocities are included in each vector velocity determination. Third, measure-ments from two or more radars with overlapping ®elds-of-view may be combined, as described later.
Figure 4 shows the derived velocity components for the two radars. The median statistical error in the northward velocity is 61 m/s for the VHF radar and 94 m/s for the ESR. The median statistical error in the eastward velocity is 176 m/s for the VHF radar and 159 m/s for the ESR. All errors reported here are based on values computed by the GUSDAP package for the basic derived parameters. The ®tting procedure which computes vector velocities from line-of-sight velocities propagates these errors through to errors in the velocity components. The measured line-of sight velocities are predominantly northward, which results in a smaller error in that component. Furthermore, even if the ¯ow is inhomogeneous within a bin, the derived northward component is a good estimate of the average northward velocity within that bin. The eastward velocity compo-nent has a larger statistical error because the measured velocities have a relatively small eastward component. The derived eastward velocity is also more subject to errors due to inhomogenieties within a bin, for example, a shear in the northward velocity. This can happen in structured regions, such as the Harang discontinuity, or when the velocities are changing on a time scale comparable to the time required to complete a beam swing.
The VHF radar (Fig. 4a) shows generally westward ¯ow in the afternoon and evening, turning to eastward ¯ow after midnight on 11 March and returning to westward ¯ow around 0600 on 12 March. The ¯ow speeds increase dramatically during the morning, peak-ing near 1.5 km/s at 1100 UT before decaypeak-ing to a few hundred metres/s around the end of the data at 1300 UT.
The northward component is less dramatic (Fig. 4c), showing small northward ¯ows before midnight on the ®rst day, turning southward and increasing between midnight and 0600 before decreasing and again turning northward around 1000 UT on 12 March.
These values are consistent with a two-cell convection pattern, in which the dusk cell is substantially larger than the dawn cell, with northwesterly ¯ows in the afternoon and dusk sectors, stronger southeasterly ¯ows as the radar moves into the dawn cell and re-entry into the `dusk' cell as early as 0600 UT.
The same analysis performed with the ESR data also yields plots of northward and eastward velocities. However, the eastward ¯ows (Fig. 4b), while of the same magnitude as those measured with the VHF radar,
had apparently the exact opposite sign, clearly evidenced by comparison of the period of rapid ¯ow near 1100 on 12 March as seen on the two radars. Reversing the sign of the ESR velocities (as in the ®gures) brought near perfect agreement in this interval, and reasonable agreement throughout the remaining period. The sign error was subsequently traced to the adoption of dierent conventions in the ESR and original VHF analyses; a modi®cation to the GUISDAP analysis output was implemented to prevent the reoccurrence of this problem. The largest deviation in the two results is after 1000 UT on 12 March, when the northward ¯ow observed by the ESR was signi®cantly larger than that observed by the VHF radar.
Inspection of magnetograms from Longyearbyen and Tromsù shows a clear enhancement in the H-component between 0930 and 1000 UT, at Longyearbyen, and a greater enhancement between 1300 and 1500 UT, at Tromsù. Since the radar common volumes are approx-imately one third of the way between the two magne-tometers, these observations match well with the time of the velocity feature seen in the radar data near 1100 UT. The feature is also clearly visible in Fig. 1 as mentioned earlier. Quick look data from the CUTLASS coherent
radar pair (Lester et al., 1997) also shows evidence of a propagating feature at this time and a more detailed multi-instrument study is in preparation.
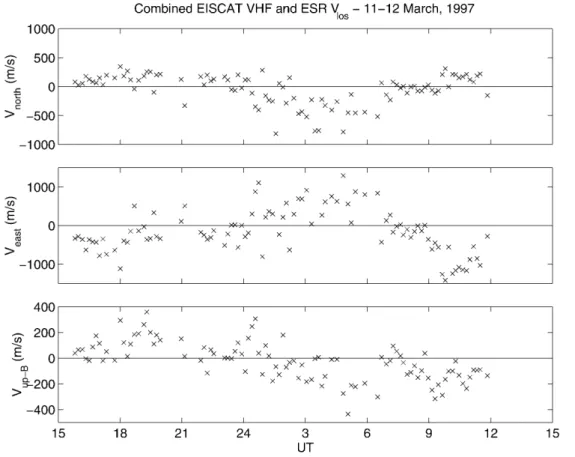
Since the data are statistically dierent between the two radar determinations, with the greatest dierences occurring for small perpendicular velocities, it is possible that the assumption of negligible ®eld-aligned ¯ow is not valid at these times. This data set allows us to combine the four line-of-sight velocities to obtain full vector information at the mid point, including the ®eld-aligned component (Fig. 5). Here it can be seen that the ®eld-aligned velocity is upward before 0100 UT and down-ward after that time, oscillating between 0 and 400 m/s. Meanwhile, the two perpendicular components comput-ed from the combincomput-ed data sets exhibitcomput-ed rcomput-educcomput-ed scatter, but the major features remained unchanged. Note that the northward ¯ow observed after 1000 UT on 12 March matches the VHF result more closely than the ESR result. This results from the fact that the ESR measurements are at a higher elevation angle, and hence more sensitive to the ®eld-aligned ¯ow. The enhanced line-of-sight velocities after 1000 UT, which were inter-preted as being due to enhanced northward in Fig. 4d, are interpreted as enhanced ®eld-aligned ¯ow in Fig. 5.
Fig. 4a±d. Upper panel: E±W velocity determined by a the EISCAT VHF radar and b the Svalbard radar. Lower panel: N±S velocity determined by c the VHF and d the ESR. The median statistical error
in the northward velocity is 61 m/s for the VHF radar and 94 m/s for the ESR. The median statistical error in the eastward velocity is 176 m/s for the VHF radar and 159 m/s for the ESR
The median error in the eastward velocity is 51 m/s, about 1/3 the size of the errors in Fig. 4. The median error in the northward velocity is actually somewhat larger than in Fig. 4 because this component is
corre-lated with the parallel component, which was previously assumed to be zero.
Figure 6 shows the eect of neglecting the ®eld-aligned velocity on the VHF velocity components. The
Fig. 5. Full vector convection velocities derived by combining the four line-of-sight velocities determined by the ESR and VHF radar. The median error in the northward velocity is 116 m/s. The median error in the eastward velocity is 51 m/s. The median error in the parallel velocity is 46 m/s
Fig. 6. Dierence between the eastward and northward velocity components determined from the VHF data alone, and from the VHF and ESR data together, including the ®eld-aligned veloc-ity component. The median error in the northward velocity dier-ence is 175 m/s. The median error in the eastward velocity dierence is 74 m/s
additional systematic error in the VHF velocity com-ponents is as high as 500 m/s after 0900 UT on 12 March.
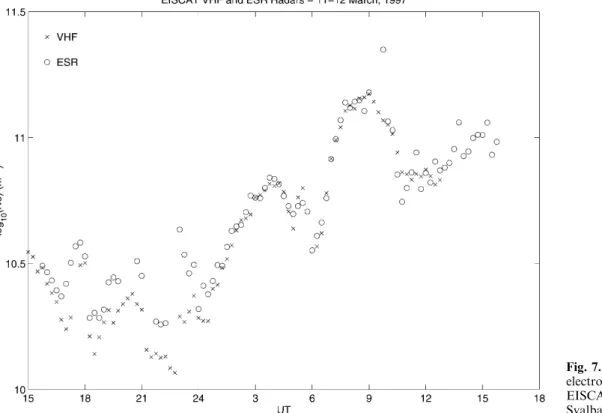
The same dataset allows the comparison of the derived electron densities in the common volumes
(Fig. 7) in order to make an independent check of the calibration constant used in the ESR analysis. The duration of the time bins was 15 min for Figs. 7 and 8 to decrease scatter and improve the clarity of ®gures. The remarkable agreement between the datasets over the
Fig. 7. Time variation of derived electron density from the EISCAT VHF radar (x) and Svalbard radar (o)
Fig. 8. a Time variation of derived ion temperature from the EISCAT VHF radar (x) and Svalbard radar (o) and b the corresponding electron tempera-ture data
entire observation period shows that the two radars (ESR and VHF) are rather accurately calibrated against each other. An absolute determination of the correct value for each radar requires either plasma line observations, or data from a suitably located ionosonde (on Bjùrnoya for example), neither of which are presently available. Finally, Fig. 8a shows the compar-ison between the ion temperature determinations by the two radars and Fig. 8b the same for the electron temperatures.
4 Discussion
In general, the ESR and the VHF radar determine the same ®eld perpendicular vector velocity ®elds and the combination of the data from the two radars has allowed the successful extraction of the ®eld-aligned velocity component in the overlap region. While it is clearly premature to make general statements about the assumptions made in the velocity combinations used in earlier work with CP4, it is probable that the scatter in small velocity estimates exhibits a spurious excess variability due to the assumption of negligible ®eld aligned ¯ow. In addition, systematic errors in the single-radar velocities are possible, as shown in Fig. 6. The independent determinations of ionisation density and ion and electron temperatures in the same target volumes by the two radars produce data sets which show the same general behaviours. Other work has suggested that the occurrence of scatter from non-thermal plasma populations is considerably more com-mon in ESR data than has been previously observed. This would result in an increased scatter for data interpreted in terms of thermal plasma parameters, particularly in the ion and electron temperatures. However, the relative scatter in the two determinations is similar; the median error in Ti is 36 K for the VHF
radar and 45 K for the ESR, while the median error in Te is 38 K for the VHF radar and 44 K for the ESR.
Thus, at least within identical target volumes, no dierent treatment is necessary for the ESR than that employed, at dierent k-vector, for the VHF radar.
In summary, we have successfully demonstrated that the ESR and VHF determine the same vector velocity ®elds. We have identi®ed a sign error in the derived ESR velocities, deduced the ®eld-aligned velocity component for the ®rst time and checked the calibration of the ESR density determinations. We now feel con®dent to envisage experiments which redirect the ESR towards higher latitudes in order to determine ¯ow velocities
over a much wider latitudinal range than ever before achieved by ground based radars.
With the advent within a few years of the Relocatable Atmospheric Observatory, which is expected to be located initially at Resolute Bay, Canada, incoherent scatter radars will provide spatially continuous velocity measurements from EISCAT to Arecibo.
Acknowledgements. We are indebted to the Director and sta of EISCAT for operating the facility and supplying the data. EISCAT is an International Association supported by Finland (SA), France (CNRS), the Federal Republic of Germany (MPG), Japan (NIPR), Norway (NFR), Sweden (NFR) and the United Kingdom (PPARC). We also thank S. Cariglia for porting these data sets to the MADRIGAL system, the Auroral Observatory of the University of Tromsù for magnetometer data from Longyearbyen and Tromsù and M. Lester, of the University of Leicester, UK, for the quick look CUTLASS data.
Topical Editor M. Lester thanks M. Sulzer and another referee for their help in evaluating this paper.
References
Baron, M., The EISCAT facility, J. Atmos. Terr. Phys., 46, 469± 472, 1984.
van Eyken, A. P., H. Rishbeth, D. M. Willis, and S. W. H. Cowley, Initial EISCAT observations of plasma convection at invariant latitudes 70±77, J. Atmos. Terr. Phys., 46, 635±641, 1984. Folkestad, K., T. Hagfors, and S. Westerlund, EISCAT: An
updated description of technical characteristics and operational capabilities, Radio Sci., 18, 867±879, 1983.
Foster, J. C., J. M. Holt, G. B. Loriot, and W. L. Oliver, World Day ionospheric observations at Millstone Hill, EOS Trans. AGU, 66, 457±458, 1985.
Holt, J. M., and B. A. Emery, CEDAR Data Base Committee report, NCAR Technical Note, NCAR/TN-427+PPR, 1996. Holt, J. M., J. V. Evans, W. L. Oliver, and R. H. Wand, Millstone
Hill Observations of Ionospheric Convection, Physics of space plasmas, Scienti®c Publishers, 53±72, 1984.
Kelly, J. D., C. J. Heinselman, J. F. Vickrey, and R. R. Vondrak, The Sondrestrom radar and accompanying ground-based instrumentation, Space Sci. Rev., 71, 797, 1995.
Lehtinen, M., and A. Huuskonen, General incoherent scatter analysis and GUISDAP error estimates valid for high signal strengths, J. Atmos. Terr. Phys., 58, 435±464, 1996.
Lester, M., T. B. Jones, T. R. Robinson, E. C. Thomas, T. K. Yeoman, R. Pellinen, A. Huuskonen, H. Opgenoorth, M. Persson, A. Pellinen-Wannberg, and I. Haggstrom, CUTLASS ± a tool for co-ordinated cluster/ground based investigations of the solar terrestrial system, in satellite-ground based source book, E SA Special Publications, ESA-SP 1198, 1997.
Wannberg, U. G., I. Wolf, L.-G. Vanhainen, K. Koskennlemi, J. RoÈttger, M. Postila, J. Markkanen, R. Jacobsen, A. Stenberg, R. Larsen, S. Eliassen, S. Heck, and A. Huuskonen, The EISCAT Svalbard Radar, a case study in modern incoherent scatter radar system design, Radio Sci., 32, 2283± 2307, 1997.