HAL Id: hal-01657951
https://hal.archives-ouvertes.fr/hal-01657951
Submitted on 17 May 2018
HAL is a multi-disciplinary open access archive for the deposit and dissemination of sci-entific research documents, whether they are pub-lished or not. The documents may come from teaching and research institutions in France or abroad, or from public or private research centers.
L’archive ouverte pluridisciplinaire HAL, est destinée au dépôt et à la diffusion de documents scientifiques de niveau recherche, publiés ou non, émanant des établissements d’enseignement et de recherche français ou étrangers, des laboratoires publics ou privés.
acids in the EDEN mother-child cohort
Martine Armand, Jonathan Y. Bernard, Anne Forhan, Barbara Heude,
Marie-Aline Charles
To cite this version:
Martine Armand, Jonathan Y. Bernard, Anne Forhan, Barbara Heude, Marie-Aline Charles. Maternal nutritional determinants of colostrum fatty acids in the EDEN mother-child cohort. Clinical Nutrition, Elsevier, In press, �10.1016/j.clnu.2017.10.007�. �hal-01657951�
Maternal nutritional determinants of colostrum fatty acids in the EDEN
mother-child cohort
Martine Armand a, *, Jonathan Y Bernard b, c, Anne Forhan b, c, Barbara Heude b, c, 1, Marie-Aline
Charles b, c, 1, and the EDEN mother-child cohort study group a Aix Marseille Univ, CNRS, CRMBM, Marseille, France b
INSERM UMR1153 Centre of Research in Epidemiology and Statistics Sorbonne Paris Cité (CRESS), Developmental Origins of Health and Disease (ORCHAD) Team, F-94807 Villejuif, France
c Paris Descartes University, F-75006, Paris, France
* Corresponding author. CRMBM, UMR CNRS 7339, Faculté de Médecine Timone, 27 Bd Jean Moulin, 13385 Marseille cedex 05, France. E-mail address: martine.armand@univ-amu.fr
1 Equally contributed as the last authors.
Abbreviations used: AA, arachidonic acid; ALA, α-linolenic acid; DGLA, dihomo γ-linolenic acid; DHA, docosahexaenoic acid; DNL, de novo lipogenesis; DPA, docosapentaenoic acid; DTA, docosatetraenoic acid; E, energy; EPA, eicosapentaenoic acid; GLA, γ-linolenic acid; LA, linoleic acid; LC-PUFA, long chain polyunsaturated fatty acids; MUFA, monounsaturated fatty acids; PUFA, polyunsaturated fatty acids; SCD1, Stearoyl-CoA-Desaturase 1; SFA, saturated fatty acids.
SUMMARY
Background & aims: Programming of infant development and later health may depend on early-milk polyunsaturated fatty acids (PUFA) contents, that are very variable between women for reasons not well elucidated. Indeed, a high n-6/n-3 PUFA in milk was associated with higher adiposity, arterial pressure and lower psychomotor scores in childhood. We aimed to explore the respective contribution of several maternal and perinatal factors to the variability of linoleic (LA), α-linolenic (ALA), arachidonic (AA), and docosahexaenoic (DHA) acid levels in early milk.
Methods: Fatty acids of 934 colostrum samples from the EDEN mother-child cohort were analysed by gas chromatography. The dietary intakes during the last trimester of pregnancy were estimated using a quantitative food frequency questionnaire. Relationship between milk PUFA and dietary fatty acids, and other maternal or pregnancy variables were analysed by multiple linear regression.
Results: The means (± SD) of colostrum LA, ALA, AA and DHA levels were, respectively, 9.85 ± 1.85, 0.65 ± 0.22, 0.86 ± 0.16, and 0.64 ± 0.19 % of total fatty acids. Obese mothers colostrum contained the highest level of LA and AA and the lowest level of ALA and DHA. Colostrum LA, AA and DHA levels were higher in primiparous women. Mother’s age was positively associated with colostrum AA and DHA. Dietary n-6 PUFA were associated with higher LA and lower DHA levels in colostrum, while dietary n-3 PUFA were related to higher LA and lower AA levels. Contrary to what was observed for DHA, AA level in colostrum was not related to its dietary intake. High dietary AA/DHA and total n-6/n-3 ratios were critical for the content of DHA in colostrum lipids.
Conclusions: Our study brings new insights in the understanding of the main maternal factors involved in PUFA levels variability in early milk. These data are important to consider for dietary counseling for women prior to and during pregnancy.
Keywords: maternal determinants, colostrum PUFA, pregnant women diet, BMI class, cohort
1. Introduction
Environmental exposures during the first 1,000 days of life (from conception until 2 years of age), a critical window recently targeted by the World Health Organization (WHO), influences children growth, development, and later health. Early nutrition, and especially through mothers dietary intakes, is one of the essential exposure factors in the “Developmental Origin of Health and Diseases” (DOHaD) framework, first via nurturing the preimplantation embryo, then via the placental transfer of nutrients to the fetus, and lastly via human milk to breastfed infants [1-3].
Human milk is considered the most appropriate food for optimal development of the infant partly because of its n-6 and n-3 polyunsaturated fatty acid (PUFA) content and specifically, linoleic (LA) and arachidonic (AA) acids, and α-linolenic (ALA) and docosahexaenoic (DHA) acids [4]. Indeed, PUFA are constituents of tissue cells membrane and display many regulatory functions as in the inflammatory process through metabolites or for the set-up of gene expression levels [4-6]. Therefore they are essential for general growth and the development of several key organs in the newborn, such as brain, cardiovascular system and intestine [4,7-10]. PUFA content in human milk is quite variable. It originates from several maternal sources (storage in white adipose tissue, long chain (LC) PUFA biosynthesis from the food precursors LA and ALA in liver), and is sensitive to mother’s diet [11,12], lactation period [13] and maternal overweight [14,15]. Although knowledge about the individual importance of these factors would be helpful to optimize PUFA human milk content, few studies have considered them, and none concomitantly, in a large number of mothers (available studies comprise from 5 to 180 women).
The “early milk”, i.e. colostrum, may be of considerable biological importance since it provides the initial supply of PUFA to the breastfed newborns. In the EDEN cohort, we previously reported a lower cognitive development in 2-3 year-old children when formerly breastfed by mothers whose colostrum had the higher LA levels (9.7-15.9% of total fatty acids) as compared to the lower LA levels (5.4-9.7%) [16]. In addition, the intelligence quotient at 5-6 years was lower for children previously fed colostrum with highest LA levels combined with lowest DHA (< 0.64%) and AA (< 0.86%) levels [17]. In this context, we aimed at better understanding the sources of variability of colostrum PUFA levels, especially the modifiable maternal and pregnancy factors, using data from the EDEN mother-child cohort [18].
2. Methods
2.1. Study population
The participants are part of the EDEN mother-child cohort study, a French prospective cohort designed to investigate the role of pre- and postnatal environmental factors involved in child development and health. Recruitment started in 2003 in the university hospitals of Poitiers (mid-West part of France) and Nancy (North-East of France) and ended up in 2006 with the inclusion of 2,002 mothers. A detailed protocol of the EDEN cohort study has been previously published [18]. Briefly, the cohort consisted of pregnant women enrolled before 24 wk of gestation and of their newborn (95% full-term) whom development has been followed through numerous parameters until the age of 10 y. For the present study, we focused on 934 women (flowchart on Fig. 1) with available data on fatty acids in colostrum. The local ethics research committee (CCPP for biomedical research, Bicêtre Hospital) and the Data Protection Authority (CNIL) approved the study. Informed written consents were obtained from the mother for herself at inclusion.
2.2. Colostrum sampling and analysis of the fatty acid composition
Colostrum samples of about 5 mL were collected at the hospitals between 2 and 5 days after delivery (Mean ± SD: 3.9 ± 1.1 d) during one feed by manual expression and were stored
at -80°C until analysis. A direct methylation procedure was performed on 100 µL of colostrum at 100°C for 1 h with methanol/hexane (4:1, v/v) and acetyl chloride by adapting a published method [19]. This quicker procedure was compared to a more time consuming method routinely used in the laboratory (milk lipid extraction using chloroform/methanol 2:1 followed by methylation using boron trifluoride [10]) and showed comparable results (data not shown). Fatty acid methyl-esters (FAME) were analyzed by gas chromatography (Perkin Elmer Clarus 600, flame ionization detector, Totalchrom software, hydrogen as gas carrier) using a fused silica capillary fast column (BPX 70, 10 m x 0.1 mm i.d., 0.2 µm film thickness, Sigma-Supelco). The initial oven temperature was set at 60°C, raised to 200°C at 20°C/min, then to 225°C at 7°C/min with one min hold, and to 250°C at 160°C/min with one min hold. The control of the proportionality between FAME peaks area (in µV*sec), and their identification based on their retention time, were performed using an external calibrator FAME standard (GLC 674, Nu-Chek Prep, Waterville, NM, USA). Each Fatty acid level was expressed as the proportion of total fatty acids present in the chromatogram (weight percent). Intra-assay reproducibility of the direct method was obtained by repeated analysis of three different human milk samples (5 or 10 aliquots each). Coefficients of variability for fatty acids contributing for more than 1% or for 0.1-1% of total fatty acids were comprised from 0.12 to 1.48 or from 0.84 to 2.28, respectively. Internal standard (tridecanoic acid, Sigma-Fluka) was added to quantify total lipid content. We further calculated the sum or ratios of specific fatty acids as surrogate indexes of de novo lipogenesis (DNL) in the liver (sum of 16:0 + 16:17 + 18:1 9 + 20:1 n-9), of DNL in the breast (sum of 10:0 + 12:0 + 14:0 + 14:1), of Steaoryl-CoA-Desaturase 1 (SCD1) i.e. Δ9-desaturase activity (SCD1-16 product/substrate ratio: 16:1 n-7/16:0; SCD1-18: 18:1 n-9/18:0), of Δ5-desaturase activity (20:4 n-6/20:3 n-6 i.e. AA/DGLA) and of Δ6-desaturase activity (20:3 n-6/18:2 n-6 i.e. DGLA/LA), as previously published for milk [20,21]. The DHA Sufficiency Index was also calculated (22:6 n-3/22:5 n-6 i.e. DHA/n-6 DPA) [22].
2.3. Dietary assessment
A food-frequency questionnaire (FFQ), adapted from a validated one [23], based on 137 different foods or food groups combined with pictures from 12 food types for portion size evaluation, was completed by the women to assess their usual diet during the third trimester of pregnancy, as previously described [24]. Total energy, protein, carbohydrate, lipid and alcohol intakes were calculated by using the SU.VI.MAX nutrient database, whereby the majority of the nutrient information comes from French nutrient composition database [24]. The 137 items were therefore clustered into 33 food groups according to their nature (e.g. Meat, Eggs, Poultry, Fish & Seafood, Cheese, Fruits, Vegetables, etc).
Except for some cooked dishes (ready meals or dishes with well-known recipes), the nutrient composition of food items was assessed without potential added fat. A specific food group named “Added-Fat after cooking” inquired about the frequency of added fat (butter, margarine, cream), and another one called “Sauces” about added sauces (dressing, ketchup, mayonnaise), in the plate. Intake of different fatty acids including LA, ALA, AA, DHA, eicosapentaneoic acid (EPA) and n-3 docosapentaenoic acid (n-3 DPA) was calculated from the nutrient composition table and by summation within a same food group. We therefore calculated the respective contribution (percentage) of each food group to the total maternal intake of saturated fatty acids (SFA), monounsaturated fatty acids (MUFA), total PUFA, total n-6 PUFA, total n-3 PUFA, LA, ALA, AA, EPA, n-3 DPA and DHA.
In addition, mothers were asked about their habits in fat use for cooking, frying or seasoning (butter, margarine, coconut butter, and different types of vegetable oil). Oils were combined into three groups according to their richness in n-3 PUFA (colza, mixtures), in n-6 PUFA
(sunflower, corn) or in MUFA (peanut, olive). Women were therefore categorized into users vs. non-users for each type of added fat and each group of vegetable oil.
2.4. Other collected data
Women declared their weight just before pregnancy, and midwives measured mothers height (wall Seca 206 stadiometer, Hamburg Germany) during the first visit scheduled between 24 and 28 weeks of amenorrhea. Pre-pregnancy BMI was calculated (weight kg/height m2), and
categorized according to the WHO four classes: underweight (BMI < 18.5), normal weight (18.5-24.9), overweight (25-29.9) and obesity (BMI ≥ 30). Gestational age at delivery was determined from the date of the last menstrual period and early standard ultrasound fetal measurement. Maternal age at delivery, parity and newborn sex were extracted from clinical records. Smoking habits during pregnancy were collected from self-administered questionnaire during pregnancy and after delivery, and women were qualified as smokers or not smokers during pregnancy. Maternal education level was estimated based on the highest diploma obtained and expressed in years of attended school.
2.5. Statistical analyses
Data are means ± SD unless otherwise indications. The impact of the number of days between birth and colostrum sampling (referred as “sampling day” throughout the paper) on fatty acid colostrum level was investigated by Spearman’s correlation coefficients. For each fatty acid, the colostrum level was compared between BMI categories using multivariable linear regression analysis adjusted for center and sampling day.
Correlations between fatty acids intake during pregnancy (expressed as % of total lipid intake) and fatty acids in colostrum (expressed as % of total fatty acids) were investigated using partial Spearman’s correlation coefficients after adjustment for center and sampling day. Because of the existence of strong correlations between the different fatty acids, we did not perform any correction for multiple testing.
We then focused on the levels of LA, ALA, DHA and AA in colostrum to explore their main independent determinants in multivariable linear regression models. Their values were standardized in order to compare the effect size of the different contributors between models. All models initially included center, sampling day, mother’s age at delivery, gestational age at delivery, pre-pregnancy BMI categories, primiparous status, smoking, maternal education level, main food groups contributors, potential competitors intake (n-3 PUFA intake for LA and AA, n-6 PUFA intake for ALA and DHA), and Added-Fat intake (for cooking and after cooking). The main food contributors were those accounting for about 33% of the total intake for ALA and LA and for about 55% of total intake for DHA and AA (“Cheese”, “Added-fats”, and “Fresh/dried fruits” for ALA, “Fish and seafood” for DHA, “Sauces” and “Bread” for LA, “Eggs and meats” regrouping intake from “Eggs”, “Poultry” and “Meats” groups for AA). Factors with P-values over 15% were excluded from the models using backward selections.
All analyses were performed with SAS version 9.3 (SAS Institute, Inc., Cary, NC, USA) and significance was assumed at P < 0.05.
3. Results
3.1. Descriptive results
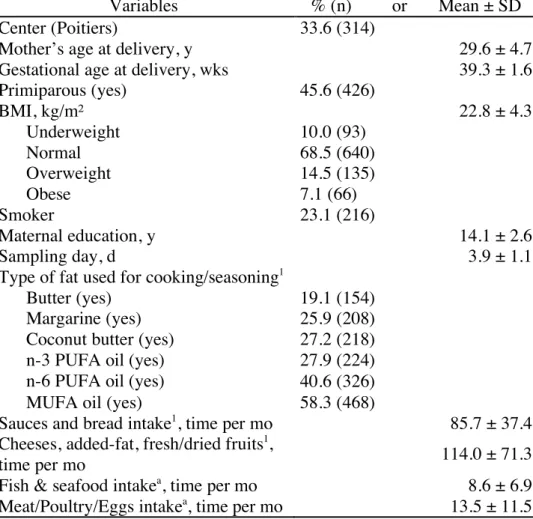
Main characteristics of the population are reported in Table 1.
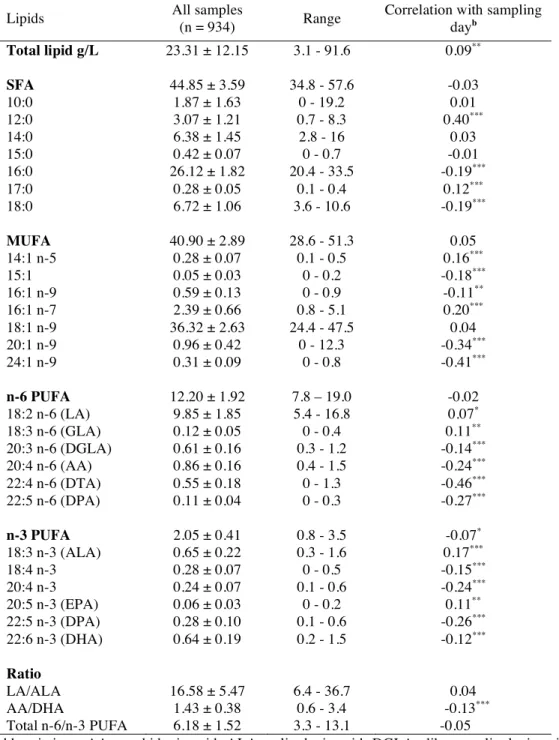
Table 2 displays the colostrum fatty acid levels in the whole study population, and shows that
sampling day was positively correlated with LA and ALA levels, and negatively with most of their derivates LC-PUFA, and with LC-MUFA levels including nervonic acid (24:1 n-9).
Table 3 shows the women’s dietary intake during the last trimester of pregnancy and
contributing to LA intake, and “Eggs, Meats & Poultry” were the main sources of AA intake. The two main sources of ALA were “Cheese” and “Added-Fat after cooking”, and the main dietary contributors to DHA maternal intake were in decreasing order “Fish and seafood”, “Fast foods” (i.e. hamburger, pizza, sandwich, savory pie, toasties and cheese sandwich, puff pastry roll), and “Eggs”.
3.2. Relationship between colostrum fatty acid levels and maternal pre-pregnancy BMI
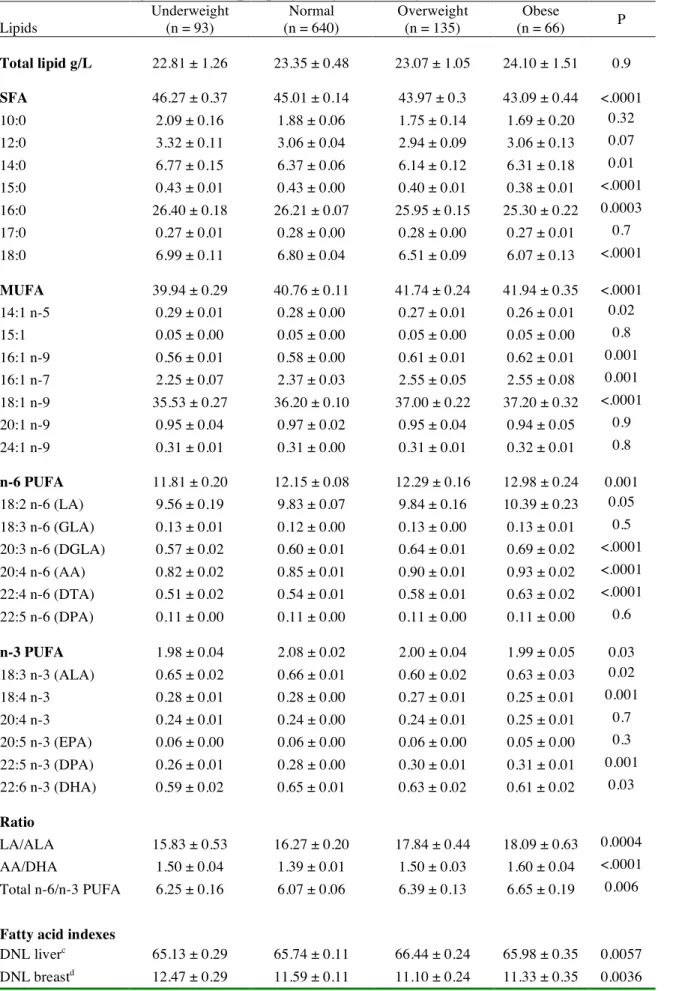
Total SFA in colostrum, and especially the pentadecanoic acid (15:0), palmitic acid and stearic acid (18:0), displayed the strongest negative associations with pre-pregnancy BMI (Table 4). On the opposite, total MUFA (mainly palmitoleic acid i.e. 16:1 n-7, 16:1 n-9, and oleic acid) and total n-6 PUFA (mainly LA, dihomo γ−linolenic (DGLA), AA and docosatetraenoic acid (DTA)) levels were positively associated with BMI categories. Among n-3 PUFA, only the DPA showed a positive association with BMI, whereas total n-3 PUFA, ALA and DHA displayed inverse U-shaped associations, the highest values being observed in women with normal BMI. LA/ALA ratio was positively associated with increasing BMI categories. AA/DHA and total n-6/total n-3 PUFA ratios followed an U-shaped association with BMI, i.e. women with normal pre-pregnancy BMI had the lowest ratios and obese mothers the highest. The colostrum DHA Sufficiency Index followed an inverse U-shaped association with BMI. The colostrum indexes for DNL-liver, and for SCD1-16, SCD1-18 and Δ6-desaturase enzymatic activities were all positively associated with BMI, while indexes for DNL-breast and for Δ5-desaturase (P-trend 0.053) enzymatic activity were negatively associated with it. 3.3. Correlations between fatty acids dietary intake during the last trimester of pregnancy and colostrum fatty acid levels
Table 5 shows that, after adjusting for center and sampling day, the correlations between
maternal intake in a given fatty acid and the corresponding fatty acid in colostrum were in general positive, the strongest correlations being for DHA and EPA. Noticeable exception was observed for AA with no correlation. Regarding ratios, the correlation was strong for AA/DHA, and moderate for total n-6/n-3 PUFA. Correlations between different fatty acid families were noticeable: maternal dietary SFA were negatively associated with colostrum PUFA (especially LA and ALA), and similarly total dietary PUFA (total n-6 and n-3 PUFA) were negatively associated with milk SFA; dietary MUFA were positively associated with colostrum n-6 PUFA, and especially LA, and negatively with colostrum DHA, leading to positive correlations with AA/DHA and total n-6/n-3 PUFA ratios. ALA intake by mothers correlated moderately with EPA and DHA in milk. Dietary AA/DHA and total n-6/n-3 PUFA were negatively correlated with the content in EPA, DPA n-3 and DHA in colostrum lipids. 3.4. Respective contribution of maternal factors to ALA, DHA, LA and AA levels in colostrum Results of the multivariable linear regression models explaining ALA and DHA, and LA and AA colostrum levels variability are shown in Tables 6 and 7, respectively.
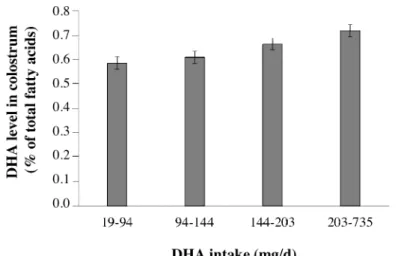
The strongest contributors of ALA levels in colostrum, showing a positive association, were sampling day and n-6 PUFA intake, then use of MUFA-rich oils (i.e. olive and peanut oils) and mother’s age at delivery. Main ALA contributors with a negative association were the use of coconut butter (rich in SFA) and pre-pregnancy overweight status. The strongest predictor of DHA was fish and seafood intake with an increase of 0.039 SD of the DHA level for one additional serving per month. The relationship between dietary intake of DHA and DHA level in colostrum was, however, not strictly proportional (Fig. 2). Maternal age at delivery and primiparous status also significantly contributed to the level of DHA in colostrum through a positive association, while sampling day was negatively associated. Abnormal pre-pregnancy
BMI and smoking tended to be predictors of lower DHA level in colostrum. All together, theses factors explained 16.3% of colostrum DHA content variability.
The consumption of n-6 PUFA-rich vegetable oils (i.e., sunflower and corn oils) was the main contributor of LA levels in colostrum, followed by pre-pregnancy obesity and primiparous status, all showing a positive association. Predictors with a negative association were an underweight status before pregnancy and energy intake. The most important contributors to AA colostrum level were sampling day (negative association) and maternal pre-pregnancy BMI (negative association with underweight status and positive association with overweight/obese status, when normal BMI class was taken as a reference). Colostrum AA level was also positively associated with maternal age and primiparous status, and was lower in mothers who declared using MUFA-rich oil. The variables included in this model explained 13.5% of the colostrum AA content variability. Alcohol consumption was not significantly associated with the colostrum PUFA levels (data not shown). Nevertheless, taken all together the factors we explored explained only a part of the PUFA variability (i.e. 5 to 16% of variance explained).
4. Discussion
In the EDEN mother-child cohort, we found several maternal (BMI, age, diet, smoking status) or perinatal (parity, lactation period) factors independently associated with LA, ALA, AA and DHA levels in early milk. Albeit the factors we explored showed a modest overall contribution to the PUFA variation in colostrum, the knowledge of their respective impact is valuable due to recent associations reported between early/mature milk PUFA levels and offspring outcomes later in life. Indeed, high LA level and high LA/ALA and total n-6/n-3 PUFA ratios in milk were found correlated to lower psychomotor scores at 14-18 months of age [25,26] or at 2-3 or 5-6 years old [16,17], a negative correlation was reported between milk DHA level (from 0.34 to 0.59% of total fatty acids) and fat mass in girls of 6-9 years old [27], and diastolic and systolic pressure was lower in 12 years old infants previously breastfed with a milk containing at least 0.51% of n-3 PUFA [9].
The rapid changes in colostrum PUFA profile over time after birth are consistent with other observations reported between day 3 and day 5 [28]. This factor turned out to be the strongest predictor of the variability of the colostrum AA level while it explained only about 10% of the total variance for DHA level. This is probably linked to the mobilization of fatty acids stored in the maternal white adipose tissue, which was reported to be richer in AA than DHA [29].
Pre-pregnancy BMI represented another important predictor of PUFA levels in early milk. Colostrum of obese mothers had the highest level of n-6 PUFA and lower levels of ALA and DHA, indicating a worse balanced PUFA profile (higher LA/ALA, AA/DHA and total n-6/n-3 PUFA ratios) than women with lower pre-pregnancy BMI. This observation is consistent with what was reported in the colostrum of Swedish obese mothers [14], although the n-3 PUFA difference between obese and normal women was lower in our study. A higher level in LA was also reported in mature milk from Argentine obese mothers [15]. All these PUFA variations due to high pre-pregnancy BMI may worsen during lactation by being more pronounced in mature milk [14,15]. A novelty raised herein is that being underweight before pregnancy was associated with lower DHA level to the same extent than obesity, leading to higher total n-6/n-3 PUFA and AA/DHA ratios. Interestingly the average intake in DHA during the last trimester of pregnancy in each BMI class subgroup was similar (0.17-0.18 g/d) and so did not seem to intervene in these differences. In contrast, colostrum fatty acids indexes orientated towards specific maternal metabolic anomalies. Indeed, increase in DNL liver index together with a decrease in DNL breast index, an increase in SCD1-16, SCD1-18 and Δ6-desaturase indexes,
and a decrease in Δ5-desaturase index, were evocative of the known decrease in insulin sensitivity associated with increasing BMI [20,30]. Furthermore, a recent meta-analysis highlighted a high plasma lipids DGLA level in overweight/obese subjects as a very relevant biomarker in the pathogenesis of obesity, that reflects disturbances in Δ6 (elevated through DGLA/LA ratio) and Δ5 (decreased through AA/DGLA ratio) desaturases activities [31]. We found that this altered LC-PUFA status also characterized the fatty acid profile of early milk from overweight/obese mothers. Since foods DGLA content is very low, the increased level of DGLA in the colostrum of obese women may reflect an increased conversion rate of LA and a decreased conversion rate of DGLA in AA, as reported by others in plasma lipids [31]. The lower Δ5-desaturase activity consecutive to adiposity [32] can explain the lower DHA level in their colostrum, while the higher AA level (as well as the higher LA level) could be due to a higher supply from the elevated amount of white adipose tissue, since a higher storage of AA was reported to correlate with obesity and metabolic dysregulations [31]. This explains the consistent linear relationship between colostrum AA levels and pre-pregnancy BMI. The lower colostrum DHA level in underweight women could be linked to a lower DHA status of these women as suggested by their lower milk DHA sufficiency index.
Maternal diet is known to influence milk fatty acids composition, however, the share attributable to diet is less documented [11,12,33]. The inverse relationship we report between mother dietary SFA and PUFA in milk is consistent with others [12,33]. In addition, a specific source of SFA (coconut butter) led to low ALA level in our colostrums samples. We confirm a positive association between dietary MUFA and colostrum PUFA level [12], especially with LA, and to a lesser extent with ALA. MUFA oil was one contributor influencing n-6 and n-3 PUFA in colostrum probably because of the existing competition between the n-9 (via oleic acid), n-6 (via LA as precursor) and n-3 (via ALA as precursor) pathways for the same desaturase and elongase enzymes in the body. The colostrum of mothers declaring using MUFA oil was thus higher in ALA and lower in AA possibly because of a lower conversion rate of ALA into DHA and of LA into AA. Due to competition, dietary n-6 fatty acids were predictive of a higher ALA and a lower DHA levels in colostrum, while dietary n-3 fatty acids would be associated with higher LA and lower AA levels. Moreover, while the daily dietary intake of LA was high (mainly from sauces and the use of n-6 PUFA oils), it correlated moderately to LA level in colostrum. The daily dietary supply in AA (mainly from meat, chicken and eggs) was close to the DHA supply (mainly from fish and seafood), but the AA level in early milk was not related to the dietary intake [33], whereas the DHA intake showed the highest association with colostrum level [33]. The moderate relationship we found between the dietary LA and its level in colostrum is consistent with a study estimating that about 30% of dietary LA is transferred into milk lipids [34]. In addition, the AA converted from dietary LA represents about 1% of total milk AA secreted [34]. It means that a major proportion of LA and AA of milk lipids derives from storage in the adipose tissues [29]. A strong positive association between fish and other seafood consumption and DHA in milk has been known for long [35], but herein the association was moderately high (Rho = 0.29, P < 0.0001) and not proportional to the amount of DHA intake (from 19 to 735 mg/d) in accordance with the literature [11,12]. This can be explained by the fact that DHA in early milk is likely to originate from many sources i.e. diet, mobilization from adipose tissue storage and biosynthesis from dietary ALA (Rho = 0.13, P < 0.0001, herein). In addition, maternal variants of genes involved in LC-PUFA biosynthesis such as the FADS1/FADS2 cluster [36-38], also capable of modifying the association between fish intake and DHA level in milk [37], and the ELOVLs [21], are powerful factors controlling the levels of AA and DHA in milk.
Other maternal factors were found independently associated with ALA, DHA, LA or AA levels in colostrum. Primiparous status was one of them possibly because optimal essential fatty acids and LC-PUFA maternal status is not attained after several pregnancies [22]. Maternal age could explain AA and DHA levels through an increased in Δ5-desaturase activity with age [32]. The negative association of smoking with colostrum DHA, but not AA level, could be due to a decreased conversion rate of ALA via a specific inhibition of the Δ5 desaturation by toxic xenobiotics [39].
Some limitations and strengths of our study can be pointed out. A first limitation is the collection of a fraction of colostrum (5 mL) taken during breast-feeding instead of a sample from a total production (i.e. from 15-60 mL). However, the colostrum fatty acids profile is quite homogeneous throughout a single production, at the contrary of mature milk (fore versus hind milk), and the analysis of sample collected any time during suckling is representative of the entire produced colostrum [28]. Another limitation is the collection of colostrum at the maternity unit where mothers received a standard hospital diet instead of following their usual diet. However, it is more likely that the high inter-individual variability obtained resulted from the impregnation of the personal diet and maternal status rather than of the homogeneous food received during the few days of hospitalization [12]. The main strength of this study is to rely on a large sample of women through the use of the Eden cohort’s database, which renders these results very robust.
In conclusion, our study brings new insights in the understanding of the main maternal factors involved in PUFA levels variability in early milk. These data are important to consider for dietary counseling for women prior to and during pregnancy. For instance, a normal pre-pregnancy BMI and a better choice in dietary fat sources for improving PUFA’s storage quality and biosynthesis, represent two main targets to achieve for improving the PUFA status in early milk.
Funding sources
EDEN (French study of pre- and early postnatal determinants of the child’s development and health) was supported by Foundation for Medical Research (FRM), National Agency for Research (ANR), National Institute for Research in Public Health (IRESP: TGIR cohorte santé 2008 program), French Ministry of Health (DGS), French Ministry of Research, INSERM Bone and Joint Diseases National Research (PRO-A) and Human Nutrition National Research Programs, Paris–Sud University, Nestlé, French National Institute for Population Health Surveillance (InVS), French National Institute for Health Education (INPES), the European Union FP7 programmes (FP7/2007-2013, HELIX, ESCAPE, ENRIECO, Medall projects), Diabetes National Research Program (through a collaboration with the French Association of Diabetic Patients (AFD)), French Agency for Environmental Health Safety (now ANSES), Mutuelle Générale de l’Education Nationale (MGEN), French National Agency for Food Security, and the French-speaking association for the study of diabetes and metabolism (ALFEDIAM). The present project received specific funding from the PremUp foundation (foundation for scientific cooperation in connection with pregnancy and prematurity) and the Groupe Lipides Nutrition (GLN) for the biological analyses of colostrum samples.
Study sponsors were not involved in the design of the study, data collection and analysis, interpretation of data, decision to publish, or preparation of the manuscript.
Statement of authorship
MA: colostrum samples analysis, data folders; JYB, BH, and AF: dietary records analysis, statistical analyses; MAC and BH: principal investigators of the EDEN mother-child cohort
study; MA, JYB, AF, BH, MAC: interpretation of the data and critical revision of the manuscript for important intellectual content; MA and BH: writing of the manuscript. All authors read and approved the final manuscript.
Conflict of interest
None of the authors declared a conflict of interest.
Acknowledgments
The authors thank the participating families, the midwife research assistants (Lorraine Douhaud, Sophie Bedel, Brigitte Lortholary, Sophie Gabriel, Muriel Rogeon, and Monique Malinbaum) for data collection, the data entry operators (Patricia Lavoine, Josiane Sahuquillo and Ginette Debotte), and Cyrielle Garcia for technical assistance in GC analysis. The following members of the EDEN mother-child cohort study group are warmly thanked: Isabella Annesi-Maesano, Jonathan Y. Bernard, Jérémie Botton, Marie-Aline Charles, Patricia Dargent-Molina, Blandine de Lauzon-Guillain, Pierre Ducimetière, Maria De Agostini, Bernard Foliguet, Anne Forhan, Xavier Fritel, Alice Germa, Valérie Goua, Régis Hankard, Barbara Heude, Monique Kaminski, Béatrice Larroque†, Nathalie Lelong, Johanna Lepeule, Guillaume Magnin, Laetitia Marchand, Cathy Nabet, Fabrice Pierre, Rémy Slama, Marie-Josèphe Saurel-Cubizolles, Michel Schweitzer, Olivier Thiebaugeorges.
References
[1] Barker DJP. The fetal origins of adult disease. Fetal and Maternal Medicine Review 1994;6:71-80.
[2] Singhal A, Lucas A. Early origins of cardiovascular disease: is there a unifying hypothesis? Lancet 2004;363:1642-5. [3] Neville MC, Anderson SM, McManaman JL, Badger TM, Bunik M, Contractor N, Crume T, Dabelea D, Donovan SM, Forman N, et al. Lactation and neonatal nutrition: defining and refining the critical questions. J Mammary Gland Biol Neoplasia 2012;17:167-88.
[4] Hamosh M, Henderson TR, Kemper MA, Orr NM, Gil A, Hamosh P. Long-chain polyunsaturated fatty acids (LC-PUFA) during early development: contribution of milk LC-PUFA to accretion rates varies among organs. In: Newburg D ed. Bioactive components of Human Milk. Kluwer Academic/Plenum Publishers, NY, 2001:397-401.
[5] Arnardottir H, Orr SK, Dalli J, Serhan CN. Human milk proresolving mediators stimulate resolution of acute inflammation. Mucosal Immunol 2016;9:757-66.
[6] Bordoni A, Di Nunzio M, Danesi F, Biagi PL. Polyunsaturated fatty acids: From diet to binding to ppars and other nuclear receptors. Genes Nutr 2006;1:95-106.
[7] Carlson SE. Early determinants of development: a lipid perspective. Am J Clin Nutr 2009;89:1523S-9S.
[8] Innis SM. Impact of maternal diet on human milk composition and neurological development of infants. Am J Clin Nutr 2014;99:734S-41S.
[9] van Rossem L, Wijga AH, de Jongste JC, Koppelman GH, Oldenwening M, Postma DS, Abrahamse-Berkeveld M, van de Heijning B, Brunekreef B, Smit HA. Blood pressure in 12-year-old children is associated with fatty acid composition of human milk: the prevention and incidence os asthma and mite allergy birth cohort. Hypertension 2012;60:1055-60.
[10] Garcia C, Duan RD, Brévaut-Malaty V, Gire C, Millet V, Simeoni U, Bernard M, Armand M. Bioactive compounds in human milk and maturity of the intestine in premature newborns: an overview. Cell Mol Biol 2013;59:108-31.
[11] Garcia C, Millet V, Coste T C, Mimoun M, Ridet A, Antona C, Simeoni U, Armand M. French mothers' milk deficient in DHA contains phospholipid species of potential interest for infant development. J Pediatr Gastroenterol Nutr 2011;53:206-12. [12] Bravi F, Wiens F, Decarli A, Dal Pont A, Agostoni C, Ferraroni M. Impact of maternal nutrition on breast-milk composition: a systematic review. Am J Clin Nutr 2016; 104:646-62.
[13] Moltó-Puigmartí C, Castellote AI, Carbonell-Estrany X, López-Sabater MC. Differences in fat content and fatty acid proportions among colostrum, transitional, and mature milk from women delivering very preterm, preterm, and term infants. Clin Nutr 2011;30:116-23.
[14] Storck Lindholm E, Strandvik B, Altman D, Möller A, Palme Kilander C. Different fatty acid pattern in breast milk of obese compared to normal-weight mothers. Prostaglandins Leukot Essent Fatty Acids 2013;88:211-7.
[15] Marín MC, Sanjurjo A, Rodrigo MA, de Alaniz MJ. Long-chain polyunsaturated fatty acids in breast milk in La Plata, Argentina: relationship with maternal nutritional status. Prostaglandins Leukot Essent Fatty Acids 2005;73:355-60.
[16] Bernard J Y, Armand M, Garcia C, Forhan A, M De Agostini, Charles M, Heude B. The association between linoleic acid levels in colostrum and child cognition at 2 and 3 y in the EDEN cohort. Pediatr Res 2015;77:829-35.
[17] Bernard JY, Armand M, Peyre H, Garcia C, Forhan A, De AgostiniM, CharlesMA, Heude B. Breastfeeding, polyunsaturated fatty acid levels in colostrum and child intelligence quotient at 5-6 years: the EDEN cohort. J Pediatr. 2017;183:43-50.
[18] Heude B, Forhan A, Slama R, Douhaud L, Bedel S, Saurel-Cubizolles MJ, Hankard R, Thiebaugeorges O, De Agostini M, Annesi-Maesano I, et al., and the EDEN mother-child cohort study group. Cohort Profile: The EDEN mother-child cohort
on the prenatal and early postnatal determinants of child health and development. Int J Epidemiol 2016;45:353-63.
[19] Masood A, Stark KD, Salem N Jr. A simplified and efficient method for the analysis of fatty acid methyl esters suitable for large clinical studies. J Lipid Res 2005;46:2299-305.
[20] Kuipers RS, Luxwolda MF, Dijck-Brouwer DAJ, Muskiet FAJ. Differences in preterm and term milk fatty acid compositions may be caused by the different hormonal milieu of early parturition. Prostaglandins Leukotrienes and Essential Fatty Acids 2011;85:369-379.
[21] Morales E, Bustamante M, Gonzalez JR, Guxens M, Torrent M, Mendez M, Garcia-Esteban R, Julvez J, Forns J, Vrijheid M, et al. Genetic variants of the FADS gene cluster and ELOVL gene family, colostrums LC-PUFA levels, breastfeeding, and child cognition. PLoS One 2011;6:e17181.
[22] Al MD, van Houwelingen AC, Hornstra G. Relation between birth order and the maternal and neonatal docosahexaenoic acid status. Eur J Clin Nutr 1997;51:548-53.
[23] Deschamps V, de Lauzon-Guillain B, Lafay L, Borys JM, Charles MA, Romon M. Reproducibility and relative validity of a food-frequency questionnaire among French adults and adolescents. Eur J Clin Nutr 2009;63:282-91.
[24] Drouillet P, Forhan A, De Lauzon-Guillain B, Thiébaugeorges O, Goua V, Magnin G, Schweitzer M, Kaminski M, Ducimetière P, Charles MA. Maternal fatty acid intake and fetal growth: evidence for an association in overweight women. The 'EDEN mother-child' cohort (study of pre- and early postnatal determinants of the child's development and health). Br J Nutr 2009;101:583-91.
[25] Guxens M, Mendez MA, Moltó-Puigmartí C, Julvez J, García-Esteban R, Forns J, Ferrer M, Vrijheid M, López-Sabater MC, Sunyer J. Breastfeeding, long-chain polyunsaturated fatty acids in colostrum, and infant mental development. Pediatrics 2011;128:e880-9.
[26] Sabel KG, Strandvik B, Petzold M, Lundqvist-Persson C. Motor, mental and behavioral developments in infancy are associated with fatty acid pattern in breast milk and plasma of premature infants. Prostaglandins Leukot Essent Fatty Acids 2012;86:183-8.
[27] Pedersen L, Lauritzen L, Brasholt M, Buhl T, Bisgaard H. Polyunsaturated fatty acid content of mother's milk is associated with childhood body composition. Pediatr Res 2012;72:631-6.
[28] Gibson RA, Kneebone GM. Effect of sampling on fatty acid composition of human colostrum. J Nutr 1980;110:1671-5. [29] Martin JC, Bougnoux P, Fignon A, Theret V, Antoine JM, Lamisse F, Couet C. Dependence of human milk essential fatty acids on adipose stores during lactation. Am J Clin Nutr 1993;58:653-9.
[30] Corpeleijn E, Feskens EJ, Jansen EH, Mensink M, Saris WH, de Bruin TW, Blaak EE. Improvements in glucose tolerance and insulin sensitivity after lifestyle intervention are related to changes in serum fatty acid profile and desaturase activities: the SLIM study. Diabetologia 2006;49:2392-401.
[31] Fekete K, Györei E, Lohner S, Verduci E, Agostoni C, Decsi T. Long-chain polyunsaturated fatty acid status in obesity : a systematic review and meta-analysis. Obes Rev 2015;16:488-97.
[32] Zhou YE, Kubow S, Dewailly E, Julien P, Egeland GM. Decreased activity of desaturase 5 in association with obesity and insulin resistance aggravates declining long-chain n-3 fatty acid status in Cree undergoing dietary transition. Br J Nutr 2009;102:888-94.
[33] Kim H, Kang S, Jung BM, Yi H, Jung Ji A, Chang N. Breast milk fatty acid composition and fatty acid intake of lactating mothers in South Korea. Br J Nutr 2017;
[34] Demmelmair H, Baumheuer M, Koletzko B, Dokoupil K, Kratl G. Metabolism of U13C-labeled linoleic acid in lactating women. J Lipid Res 1998;39:1389-96.
[35] Lauritzen L, Jørgensen MH, Hansen HS, Michaelsen KF. Fluctuations in human milk long-chain PUFA levels in relation to dietary fish intake. Lipids 2002;37:237-44.
[36] Xie L, Innis SM. Genetic variants of the FADS1 FADS2 gene cluster are associated with altered (n-6) and (n-3) essential fatty acids in plasma and erythrocyte phospholipids in women during pregnancy and in breast milk during lactation. J Nutr 2008;138:2222-8.
[37] Moltó-Puigmartí C, Plat J, Mensink RP, Müller A, Jansen E, Zeegers MP, Thijs C. FADS1 FADS2 gene variants modify the association between fish intake and the docosahexaenoic acid proportions in human milk. Am J Clin Nutr 2010;91:1368-76.
[38] Lattka E, Rzehak P, Szabó É, Jakobik V, Weck M, Weyermann M, Grallert H, Rothenbacher D, Heinrich J, Brenner H, et al. Genetic variants in the FADS gene cluster are associated with arachidonic acid concentrations of human breast milk at 1.5 and 6 mo postpartum and influence the course of milk dodecanoic, tetracosenoic, and trans-9-octadecenoic acid concentrations over the duration of lactation. Am J Clin Nutr 2011;93:382-91.
[39] Marangoni F, Colombo C, De Angelis L, Gambaro V, Agostoni C, Giovannini M, Galli C. Cigarette smoke negatively and dose-dependently affects the biosynthetic pathway of the n-3 polyunsaturated fatty acid series in human mammary epithelial cells. Lipids 2004;39:633-7.
Fig. 1. Flowchart of selected women for whom colostrum fatty acid content was analyzed and who answered the Food Frequency Questionnaires within the EDEN mother-child cohort study.
Fig. 2. Colostrum DHA level (mean ± SEM; expressed as % of total fatty acids) according to quartiles of DHA maternal intake during pregnancy in the EDEN cohort (n = 802). The y-axis represents least-square means after adjustment for BMI (4 classes), center of recruitment, sampling day, primiparous status, mothers’ age at delivery, gestational age at delivery, smoking during pregnancy, total n-6 PUFA intake, fish and seafood intake. P-trend was < 0.001.
TABLES
Table 1: Characteristics of the population from the EDEN mother-child
cohort study (n = 934).
Variables % (n) or Mean ± SD
Center (Poitiers) 33.6 (314)
Mother’s age at delivery, y 29.6 ± 4.7
Gestational age at delivery, wks 39.3 ± 1.6
Primiparous (yes) 45.6 (426) BMI, kg/m² 22.8 ± 4.3 Underweight 10.0 (93) Normal 68.5 (640) Overweight 14.5 (135) Obese 7.1 (66) Smoker 23.1 (216) Maternal education, y 14.1 ± 2.6 Sampling day, d 3.9 ± 1.1
Type of fat used for cooking/seasoning1
Butter (yes) 19.1 (154)
Margarine (yes) 25.9 (208)
Coconut butter (yes) 27.2 (218)
n-3 PUFA oil (yes) 27.9 (224)
n-6 PUFA oil (yes) 40.6 (326)
MUFA oil (yes) 58.3 (468)
Sauces and bread intake1, time per mo 85.7 ± 37.4
Cheeses, added-fat, fresh/dried fruits1,
time per mo 114.0 ± 71.3
Fish & seafood intakea, time per mo 8.6 ± 6.9
Meat/Poultry/Eggs intakea, time per mo 13.5 ± 11.5
Abbreviations: MUFA, monounsaturated fatty acids; PUFA, polyunsaturated fatty acids.
Table 2: Colostrum total lipid content and fatty acid levels, and correlation
with sampling day in the EDEN cohorta.
Lipids All samples
(n = 934) Range
Correlation with sampling dayb Total lipid g/L 23.31 ± 12.15 3.1 - 91.6 0.09** SFA 44.85 ± 3.59 34.8 - 57.6 -0.03 10:0 1.87 ± 1.63 0 - 19.2 0.01 12:0 3.07 ± 1.21 0.7 - 8.3 0.40*** 14:0 6.38 ± 1.45 2.8 - 16 0.03 15:0 0.42 ± 0.07 0 - 0.7 -0.01 16:0 26.12 ± 1.82 20.4 - 33.5 -0.19*** 17:0 0.28 ± 0.05 0.1 - 0.4 0.12*** 18:0 6.72 ± 1.06 3.6 - 10.6 -0.19*** MUFA 40.90 ± 2.89 28.6 - 51.3 0.05 14:1 n-5 0.28 ± 0.07 0.1 - 0.5 0.16*** 15:1 0.05 ± 0.03 0 - 0.2 -0.18*** 16:1 n-9 0.59 ± 0.13 0 - 0.9 -0.11** 16:1 n-7 2.39 ± 0.66 0.8 - 5.1 0.20*** 18:1 n-9 36.32 ± 2.63 24.4 - 47.5 0.04 20:1 n-9 0.96 ± 0.42 0 - 12.3 -0.34*** 24:1 n-9 0.31 ± 0.09 0 - 0.8 -0.41*** n-6 PUFA 12.20 ± 1.92 7.8 – 19.0 -0.02 18:2 n-6 (LA) 9.85 ± 1.85 5.4 - 16.8 0.07* 18:3 n-6 (GLA) 0.12 ± 0.05 0 - 0.4 0.11** 20:3 n-6 (DGLA) 0.61 ± 0.16 0.3 - 1.2 -0.14*** 20:4 n-6 (AA) 0.86 ± 0.16 0.4 - 1.5 -0.24*** 22:4 n-6 (DTA) 0.55 ± 0.18 0 - 1.3 -0.46*** 22:5 n-6 (DPA) 0.11 ± 0.04 0 - 0.3 -0.27*** n-3 PUFA 2.05 ± 0.41 0.8 - 3.5 -0.07* 18:3 n-3 (ALA) 0.65 ± 0.22 0.3 - 1.6 0.17*** 18:4 n-3 0.28 ± 0.07 0 - 0.5 -0.15*** 20:4 n-3 0.24 ± 0.07 0.1 - 0.6 -0.24*** 20:5 n-3 (EPA) 0.06 ± 0.03 0 - 0.2 0.11** 22:5 n-3 (DPA) 0.28 ± 0.10 0.1 - 0.6 -0.26*** 22:6 n-3 (DHA) 0.64 ± 0.19 0.2 - 1.5 -0.12*** Ratio LA/ALA 16.58 ± 5.47 6.4 - 36.7 0.04 AA/DHA 1.43 ± 0.38 0.6 - 3.4 -0.13*** Total n-6/n-3 PUFA 6.18 ± 1.52 3.3 - 13.1 -0.05
Abbreviations: AA, arachidonic acid; ALA, α-linolenic acid; DGLA, dihomo γ-linolenic acid; DHA, docosahexaenoic acid; DPA, docosapentaenoic acid; DTA, docosatetraenoic acid; EPA, eicosapentaenoic acid; GLA, γ-linolenic acid; LA, linoleic acid; MUFA, monounsaturated fatty acids; PUFA, polyunsaturated fatty acids; SFA, saturated fatty acids. a Data are means ± SD and range
(minimal and maximal values), and fatty acid levels are expressed as % total fatty acids. b Spearman’s
Table 3: Maternal macronutrient and fatty acid intakes during the last
trimester of pregnancy and description of lipid main food group sources in the EDEN cohort (n = 803)a.
Nutritional factors Daily intakes (m ± SD [min-max]) or food group contribution (%) Total energy intake, kcal/db 2231 ± 726 [1003 - 4929]
Total energy intake, kJ/d 9327 ± 3035 [4192 - 20604]
Proteins, E% 16.6 ± 3.1 [7.4 - 31.2] Carbohydrates, E% 43.6 ± 7.5 [19.9 - 70.3] Lipids, E% 39.3 ± 6.6 [21.8 - 62.4] SFA, E% 18.0 ± 3.7 [7.9 - 33.1] SFA, g/d 45.2 ± 19.7 [13.6 - 150.4] Cheese, SFA% 21.0 Added-Fatc, SFA% 16.6
Fermented milk, SFA% 8.1
Fast Foods, SFA% 6.2
Cakes, SFA% 6.2 MUFA, E% 14.2 ± 2.6 [7.3 - 24.9] MUFA, g/d 35.4 ± 14.4 [11.0 - 124.6] Cheese, MUFA% 13.4 Added-Fat, MUFA % 12.1 Saucesd, MUFA % 10.1 Meats, MUFA % 8.5 PUFA, E% 4.7 ± 1.2 [2.1 - 10.6] PUFA, g/d 11.6 ± 5.0 [3.1 - 38.9] Sauces, PUFA% 21.8 Bread, PUFA% 8.0 Snacks, PUFA% 6.2 Added-Fat, PUFA% 5.9 Cakes, PUFA% 5.7
Fast Foods, PUFA% 5.6
PUFA n-6, E% 4.0 ± 1.2 [1.6 - 9.6] PUFA n-6, g/d 9.9 ± 4.5 [2.3 - 34.4] LA, E% 3.9 ± 1.2 [1.6 - 9.5] LA, g/d 9.7 ± 4.5 [2.3 - 33.8] Sauces, LA% 25.1 Bread, LA% 8.4 Snacks, LA% 6.9 Cakes, LA% 5.8 Added-Fat, LA% 5.6
Fast Foods, LA% 5.4
AA, E% 0.06 ± 0.03 [0.02 - 0.21]
AA, g/d 0.15 ± 0.08 [0.02 - 0.66]
Eggs, AA% 19.3
Meats, AA% 16.8
Fishes & seafoods, AA% 11.2 PUFA n-3, E% 0.46 ± 0.10 [0.17 - 0.85] PUFA n-3, g/d 1.15 ± 0.45 [0.32 - 2.89] ALA, E% 0.36 ± 0.06 [0.15 - 0.67] ALA, g/d 0.89 ± 0.35 [0.27 - 2.30] Cheese, ALA% 13.5 Added-Fat, ALA% 11.9
Fresh/dried fruits, ALA% 7.2
EPA, E% 0.03 ± 0.02 [0.00 - 0.16]
EPA, g/d 0.08 ± 0.06 [0.01 - 0.39]
Fishes & seafoods, EPA% 66.5
Fast Foods, EPA% 15.3
Meats, EPA% 9.5
DPA, E% 0.02 ± 0.01 [0.003 - 0.07]
DPA, g/d 0.04 ± 0.02 [0.007 - 0.23]
Fishes & seafoods, DPA% 30.7
Meats, DPA% 19.6
DHA, E% 0.07 ± 0.05 [0.01 - 0.33]
DHA, g/d 0.17 ± 0.12 [0.02 - 0.73]
Fishes & seafoods, DHA% 56.1
Fast Foods, DHA% 13.5
Eggs, DHA% 11.9
LA/ALA 10.99 ± 2.71 [3.78 - 20.51]
AA/DHA 1.06 ± 0.53 [0.2 - 4.2] Total n-6/n-3 PUFA 8.74 ± 2.43 [3.19 - 17.56]
Abbreviations: AA, arachidonic acid; ALA, α-linolenic acid; DHA, docosahexaenoic acid; n-3 DPA, n-3 Docosapentaenoic acid; E, energy; EPA, eicosapentaenoic acid; LA, linoleic acid; MUFA, monounsaturated fatty acids; PUFA, polyunsaturated fatty acids; SFA, saturated fatty acids.
a Data are means ± SD [min-max] or percentages.
b Alcohol consumption represents 0.53% ± 1.6% of total energy intake.
c “Added-Fat” corresponds to any fat added after cooking by the mother in the plate (butter,
margarine, cream).
d “Sauces” corresponds to any fat added by the mother in the plate (dressing, ketchup,
Table 4: Total lipid content, fatty acid levels and fatty acid indexes for enzymatic activities of
colostrum according to maternal pre-pregnancy BMI categories in the EDEN cohort (n = 934)a,b.
Lipids Underweight (n = 93) Normal (n = 640) Overweight (n = 135) Obese (n = 66) P Total lipid g/L 22.81 ± 1.26 23.35 ± 0.48 23.07 ± 1.05 24.10 ± 1.51 0.9 SFA 46.27 ± 0.37 45.01 ± 0.14 43.97 ± 0.3 43.09 ± 0.44 <.0001 10:0 2.09 ± 0.16 1.88 ± 0.06 1.75 ± 0.14 1.69 ± 0.20 0.32 12:0 3.32 ± 0.11 3.06 ± 0.04 2.94 ± 0.09 3.06 ± 0.13 0.07 14:0 6.77 ± 0.15 6.37 ± 0.06 6.14 ± 0.12 6.31 ± 0.18 0.01 15:0 0.43 ± 0.01 0.43 ± 0.00 0.40 ± 0.01 0.38 ± 0.01 <.0001 16:0 26.40 ± 0.18 26.21 ± 0.07 25.95 ± 0.15 25.30 ± 0.22 0.0003 17:0 0.27 ± 0.01 0.28 ± 0.00 0.28 ± 0.00 0.27 ± 0.01 0.7 18:0 6.99 ± 0.11 6.80 ± 0.04 6.51 ± 0.09 6.07 ± 0.13 <.0001 MUFA 39.94 ± 0.29 40.76 ± 0.11 41.74 ± 0.24 41.94 ± 0.35 <.0001 14:1 n-5 0.29 ± 0.01 0.28 ± 0.00 0.27 ± 0.01 0.26 ± 0.01 0.02 15:1 0.05 ± 0.00 0.05 ± 0.00 0.05 ± 0.00 0.05 ± 0.00 0.8 16:1 n-9 0.56 ± 0.01 0.58 ± 0.00 0.61 ± 0.01 0.62 ± 0.01 0.001 16:1 n-7 2.25 ± 0.07 2.37 ± 0.03 2.55 ± 0.05 2.55 ± 0.08 0.001 18:1 n-9 35.53 ± 0.27 36.20 ± 0.10 37.00 ± 0.22 37.20 ± 0.32 <.0001 20:1 n-9 0.95 ± 0.04 0.97 ± 0.02 0.95 ± 0.04 0.94 ± 0.05 0.9 24:1 n-9 0.31 ± 0.01 0.31 ± 0.00 0.31 ± 0.01 0.32 ± 0.01 0.8 n-6 PUFA 11.81 ± 0.20 12.15 ± 0.08 12.29 ± 0.16 12.98 ± 0.24 0.001 18:2 n-6 (LA) 9.56 ± 0.19 9.83 ± 0.07 9.84 ± 0.16 10.39 ± 0.23 0.05 18:3 n-6 (GLA) 0.13 ± 0.01 0.12 ± 0.00 0.13 ± 0.00 0.13 ± 0.01 0.5 20:3 n-6 (DGLA) 0.57 ± 0.02 0.60 ± 0.01 0.64 ± 0.01 0.69 ± 0.02 <.0001 20:4 n-6 (AA) 0.82 ± 0.02 0.85 ± 0.01 0.90 ± 0.01 0.93 ± 0.02 <.0001 22:4 n-6 (DTA) 0.51 ± 0.02 0.54 ± 0.01 0.58 ± 0.01 0.63 ± 0.02 <.0001 22:5 n-6 (DPA) 0.11 ± 0.00 0.11 ± 0.00 0.11 ± 0.00 0.11 ± 0.00 0.6 n-3 PUFA 1.98 ± 0.04 2.08 ± 0.02 2.00 ± 0.04 1.99 ± 0.05 0.03 18:3 n-3 (ALA) 0.65 ± 0.02 0.66 ± 0.01 0.60 ± 0.02 0.63 ± 0.03 0.02 18:4 n-3 0.28 ± 0.01 0.28 ± 0.00 0.27 ± 0.01 0.25 ± 0.01 0.001 20:4 n-3 0.24 ± 0.01 0.24 ± 0.00 0.24 ± 0.01 0.25 ± 0.01 0.7 20:5 n-3 (EPA) 0.06 ± 0.00 0.06 ± 0.00 0.06 ± 0.00 0.05 ± 0.00 0.3 22:5 n-3 (DPA) 0.26 ± 0.01 0.28 ± 0.00 0.30 ± 0.01 0.31 ± 0.01 0.001 22:6 n-3 (DHA) 0.59 ± 0.02 0.65 ± 0.01 0.63 ± 0.02 0.61 ± 0.02 0.03 Ratio LA/ALA 15.83 ± 0.53 16.27 ± 0.20 17.84 ± 0.44 18.09 ± 0.63 0.0004 AA/DHA 1.50 ± 0.04 1.39 ± 0.01 1.50 ± 0.03 1.60 ± 0.04 <.0001 Total n-6/n-3 PUFA 6.25 ± 0.16 6.07 ± 0.06 6.39 ± 0.13 6.65 ± 0.19 0.006
Fatty acid indexes
DNL liverc 65.13 ± 0.29 65.74 ± 0.11 66.44 ± 0.24 65.98 ± 0.35 0.0057
SCD1-16e 0.086 ± 0.003 0.091 ± 0.001 0.098 ± 0.002 0.102 ± 0.003 <.0001
SCD1-18f 5.21 ± 0.1 5.46 ± 0.04 5.85 ± 0.08 6.25 ± 0.12 <.0001
Δ5 desaturaseg 1.51 ± 0.04 1.49 ± 0.01 1.46 ± 0.03 1.40 ± 0.04 0.2385
Δ6 desaturaseh 0.061 ± 0.002 0.063 ± 0.001 0.067 ± 0.002 0.069 ± 0.002 0.0061
DHA Sufficiencyi 6.18 ± 0.28 6.75 ± 0.11 6.37 ± 0.23 6.24 ± 0.34 0.0953
Abbreviations: AA, arachidonic acid; ALA, α-linolenic acid; DGLA, dihomo γ-linolenic acid; DHA, docosahexaenoic acid; DNL, de novo lipogenesis; DPA, docosapentaenoic acid; DTA, docosatetraenoic acid; EPA, eicosapentaenoic acid; GLA, γ-linolenic acid; LA, linoleic acid; MUFA, monounsaturated fatty acids; PUFA, polyunsaturated fatty acids; SCD, Stearoyl-CoA-Desaturase; SFA, saturated fatty acids.
a Data are means ± SEM, and fatty acid levels are expressed as % total fatty acids. b Means are adjusted for center and sampling day.
c Sum of 16:0 + 16:1n-7 + 18:1n-9 + 20:1n-9, for DNL index in the liver. d Sum of 10:0 + 12:0 + 14:0 + 14:1, for DNL index in the breast.
e Product/substrate ratio for SCD 1 (or Δ9 desaturase) activity index: 16:1n-7/16:0. f Product/substrate ratio for SCD 1 (or Δ9 desaturase) activity index: 18:1n-9/18:0. g Product/substrate ratio for Δ5 desaturase activity index: 20:4 n-6/20:3 n-6 (AA/DGLA). h Product/substrate ratio for Δ6 desaturase activity index: 20:3 n-6/18:2 n-6 (DGLA/LA). i DHA Sufficiency Index: 22:6 n-3/22:5 n-6 (DHA/n-6 DPA).
Table 5: Correlations between fatty acid intake during pregnancy and colostrum fatty acid
levels in the EDEN cohort (n = 803)a,b. Fatty acids
in diet
(% lipids) Fatty acids in colostrum (% total fatty acids)
SFA MUFA PUFA PUFA
n-6 LA AA
PUFA
n-3 ALA EPA DPA DHA LA/ALA AA/DHA n-6/n-3
SFA 0.10 -0.02 -0.13 -0.14 -0.15 0.00 -0.04 -0.10 -0.01 0.02 0.01 0.00 -0.01 -0.06 MUFA -0.02 -0.04 0.09 0.11 0.11 -0.01 -0.04 0.06 -0.05 -0.08 -0.09 0.01 0.10 0.11 PUFA -0.12 0.04 0.15 0.14 0.16 -0.01 0.11 0.12 0.06 0.02 0.05 -0.02 -0.06 0.01 n-6 PUFA -0.11 0.03 0.14 0.14 0.16 -0.01 0.09 0.12 0.04 0.00 0.02 -0.02 -0.04 0.02 LA -0.11 0.03 0.14 0.14 0.16 -0.01 0.09 0.12 0.04 0.00 0.02 -0.02 -0.04 0.02 AA 0.00 -0.02 0.03 0.02 0.01 -0.01 0.04 0.05 0.02 0.02 0.02 -0.04 -0.03 -0.02 n-3 PUFA -0.07 0.03 0.09 0.04 0.05 -0.02 0.23 0.07 0.24 0.20 0.27 -0.03 -0.34 -0.17 ALA -0.07 0.03 0.08 0.05 0.07 -0.01 0.17 0.10 0.13 0.10 0.13 -0.06 -0.17 -0.11 EPA -0.04 0.02 0.05 0.00 0.00 0.01 0.20 0.02 0.25 0.21 0.30 -0.01 -0.35 -0.17 DPA -0.02 -0.02 0.06 0.03 0.02 0.01 0.11 0.06 0.14 0.11 0.15 -0.03 -0.17 -0.08 DHA -0.02 0.00 0.04 -0.01 -0.01 -0.01 0.20 0.03 0.24 0.21 0.29 -0.02 -0.35 -0.18 LA/ALA -0.06 0.00 0.10 0.11 0.12 -0.01 0.02 0.08 -0.03 -0.03 -0.03 -0.01 0.04 0.07 AA/DHA 0.05 -0.04 -0.04 0.01 0.01 -0.01 -0.22 -0.01 -0.28 -0.24 -0.33 0.00 0.38 0.20 n-6/n-3 -0.05 0.01 0.07 0.10 0.11 -0.02 -0.07 0.07 -0.14 -0.13 -0.16 -0.01 0.18 0.13
Abbreviations: AA, arachidonic acid; ALA, α-linolenic acid; DHA, docosahexaenoic acid; DPA, n-3 Docosapentaenoic acid; EPA, eicosapentaenoic acid; LA, linoleic acid; MUFA, monounsaturated fatty acids; PUFA, polyunsaturated fatty acids; SFA, saturated fatty acids. Bold: low, moderate and highest significant correlations.
a Partial Spearman's correlation coefficients adjusted for center and sampling day.
b Absolute correlation coefficients under 0.07 did not significantly differ from 0 (P-value > 0.05). Absolute
Table 6: Multivariable modelsa for predictors of ALA or DHA colostrum levels in the EDEN cohort (n = 803).
Model for standardizedb ALA colostrum
level as the outcome
Model for standardizedb DHA colostrum level as
the outcome
β (SE) P % explained variance β (SE) P % explained variance
Fish & seafood intake (times/mo) 0.039 (0.005) <.0001 6.28
Cheese, Added-Fat,
Fresh/dried fruits, (times/mo) -0.001 (0.001) 0.044 0.45
MUFA Oil (Yes) 0.113 (0.068) 0.097 0.30
Coconut butter (Yes) -0.181 (0.075) 0.016 0.63
n-6 fatty acids intake (g/d) 0.022 (0.008) 0.006 0.82 -0.002 (0.001) 0.11 0.27
Sampling day (d) 0.091 (0.032) 0.005 0.87 -0.122 (0.032) 0.0001 1.54
Mother’s age at delivery (y) 0.015 (0.008) 0.058 0.40 0.028 (0.008) 0.0003 1.41
Body Mass Index 0.123 0.63 0.08 0.73
Underweight 0.07 (0.115) -0.261 (0.113)
Normal Taken as reference Taken as reference
Overweight -0.216 (0.098) -0.019 (0.096)
Obese -0.069 (0.135) -0.191 (0.132)
Primiparous (Yes) 0.104 (0.074) 0.16 0.22 0.206 (0.073) 0.005 0.85
Smoker (Yes) -0.145 (0.078) 0.06 0.37
Totalc (for explained variance) 13.5 16.3
Abbreviations: ALA, α-linolenic acid; DHA, docosahexaenoic acid;MUFA, monounsaturated fatty acids; SE, standard error.
a adjusted for center. b As ALA and DHA values expressed in % of colostrum total fatty acids were standardized (value-means/
standard deviation), the beta coefficients (β) represent the difference of their respective standard deviation related to one unit variation in the explanatory variable. c Total variance explained by the full model.
Table 7: Multivariable modelsa for predictors of LA or AA colostrum levels in the EDEN cohort (n = 803).
Model for standardizedb LA colostrum level
as the outcome Model for standardized
b AA colostrum level as the outcome β (SE) P % explained variance β (SE) P % explained variance
Eggs & meats (times/mo) -0.005 (0.003) 0.12 0.26
Sauces & bread (times/mo) 0.001 (0.001) 0.44 0.07
n-6 PUFA Oil (Yes) 0.253 (0.073) 0.0005 1.46
MUFA Oil (Yes) -0.197 (0.067) 0.004 0.94
Energy intake (Kcal/100/d) -0.024 (0.09) 0.011 0.79
n-3 fatty acids intake (g/d) 0.184 (0.141) 0.19 0.21 -0.035 (0.075) 0.64 0.02
Sampling day (d) 0.023 (0.033) 0.49 0.06 -0.283 (0.032) <.0001 8.50
Mother’s age at delivery (y) 0.024 (0.008) 0.002 1.05
Body Mass Index 0.15 0.63 <.0001 2.75
Underweight -0.092 (0.119) -0.196 (0.114)
Normal Taken as reference Taken as reference
Overweight 0.069 (0.102) 0.275 (0.097)
Obese 0.286 (0.142) 0.501 (0.134)
Primiparous (Yes) 0.141 (0.072) 0.050 0.46 0.241 (0.074) 0.0011 1.17
Totalc 5.4 13.5
Abbreviations: AA, arachidonic acid; LA, linoleic acid; MUFA, monounsaturated fatty acids; PUFA, polyunsaturated fatty acids; SE, standard error. a adjusted for center and gestational age at delivery. b As LA and AA values expressed in % of colostrum total
fatty acids were standardized (value-means/standard deviation), the beta coefficient (β) represents the difference of their respective standard deviation related to one unit variation in the explanatory variable. c Total variance explained by the full model.