HAL Id: hal-02377570
https://hal.archives-ouvertes.fr/hal-02377570
Submitted on 2 Jan 2021
HAL is a multi-disciplinary open access
archive for the deposit and dissemination of
sci-entific research documents, whether they are
pub-lished or not. The documents may come from
L’archive ouverte pluridisciplinaire HAL, est
destinée au dépôt et à la diffusion de documents
scientifiques de niveau recherche, publiés ou non,
émanant des établissements d’enseignement et de
Cosmogenic and nucleogenic 21Ne in quartz in a
28-meter sandstone core from the McMurdo Dry
Valleys, Antarctica
Greg Balco, Pierre-Henri Blard, D. L. Shuster, John H Stone, Laurent
Zimmermann
To cite this version:
Greg Balco, Pierre-Henri Blard, D. L. Shuster, John H Stone, Laurent Zimmermann. Cosmogenic
and nucleogenic 21Ne in quartz in a 28-meter sandstone core from the McMurdo Dry Valleys,
Antarc-tica. Quaternary Geochronology, Elsevier, 2019, 52, pp.63-76. �10.1016/j.quageo.2019.02.006�.
�hal-02377570�
Cosmogenic and nucleogenic
21Ne in quartz in a 28-meter
sandstone core from the McMurdo Dry Valleys, Antarctica
Greg Balco⇤,a, Pierre-Henri Blardb, David L. Shusterd,a, John O.H. Stonec, Laurent
Zimmermannb
aBerkeley Geochronology Center, 2455 Ridge Road, Berkeley CA 94709 USA
bCRPG, CNRS-Universit´e de Lorraine, UMR 7358, 15 rue Notre Dame des Pauvres, 54501
Vandoeuvre-l`es-Nancy, France
cEarth and Space Sciences, University of Washington, Seattle WA USA
dDepartment of Earth and Planetary Science, 479 McCone Hall, University of California, Berkeley CA
94720, USA
Abstract
We measured concentrations of Ne isotopes in quartz in a 27.6-meter sandstone core from a low-erosion-rate site at 2183 m elevation at Beacon Heights in the
Antarc-tic Dry Valleys. Surface concentrations of cosmogenic21Ne indicate a surface exposure
age of at least 4.1 Ma and an erosion rate no higher than ca. 14 cm Myr 1. 21Ne
con-centrations in the upper few centimeters of the core show evidence for secondary spal-logenic neutron escape e↵ects at the rock surface, which is predicted by first-principles models of cosmogenic-nuclide production but is not commonly observed in natural
ex-amples. We used a model for21Ne production by various mechanisms fit to the
obser-vations to distinguish cosmic-ray-produced21Ne from nucleogenic21Ne produced by
decay of trace U and Th present in quartz, and also constrain rates of subsurface21Ne
production by cosmic-ray muons. Core samples have a quartz (U-Th)/Ne closure age, reflecting cooling below ⇠95°C, near 160 Ma, which is consistent with existing apatite fission-track data and the 183 Ma emplacement of nearby Ferrar dolerite intrusions.
Constraints on 21Ne production by muons derived from model fitting are consistent
with a previously proposed value of 0.79 mb at 190 GeV for the cross-section for21Ne
production by fast muon interactions, but indicate that21Ne production by negative
muon capture is likely negligible.
Key words: neon-21, cosmogenic-nuclide geochemistry, (U-Th)/Ne thermochronology, McMurdo Dry Valleys, Antarctica
1. Introduction 1
This paper describes mass-spectrometric measurements of neon abundance and iso- 2
tope composition in quartz in a sandstone bedrock core from the Antarctic Dry Valleys. 3
⇤Corresponding author. Tel. 510.644.9200 Fax 510.644.9201
The purpose of the measurements is to quantify the magnitude, relative importance, and 4
depth-dependence of21Ne production in near-surface rocks due to cosmic-ray neutron 5
spallation and cosmic-ray muon interactions. In addition, we quantify non-cosmogenic 6
production of21Ne in quartz by alpha capture reactions due to decay of naturally occur- 7
ring U and Th. This is important because cosmic-ray-produced21Ne is commonly used 8
in a variety of applications in Earth surface processes research, including surface expo- 9
sure dating, erosion rate estimation, and burial dating (see summary in Dunai, 2010), 10
and these applications require accurate estimates of surface and subsurface production 11
rates by these processes. 12
The various mechanisms for cosmogenic-nuclide production display di↵erent func- 13
tional dependences on depth below the surface. Thus, by collecting samples at a range 14
of depths where di↵erent production processes are dominant, one can quantify the 15
relative magnitude of the di↵erent processes, and also obtain estimates for parame- 16
ters such as attenuation thicknesses and interaction cross-sections that are necessary 17
for production rate calculations. Cosmogenic21Ne, like other commonly measured 18
cosmic-ray-produced nuclides (e.g.,10Be or26Al), is produced at the Earth’s surface 19
primarily by spallation reactions induced by high-energy neutrons in the energy range 20
30 MeV - 1 GeV, the rate of which decreases exponentially with mass depth below the 21
surface with an e-folding length in the range 140-160 g cm 2. Production by weakly 22
interacting muons is approximately two orders of magnitude less than spallogenic pro- 23
duction at the surface, but decreases much more slowly with depth, so production 24
below several meters depth is predominantly due to muons. In contrast to10Be and 25
26Al, however,21Ne is also produced in significant quantities by capture of alpha par- 26
ticles derived from decay of naturally occurring U and Th in minerals via the reaction 27
18O(↵,n)21Ne. Because21Ne is stable and has a geologic closure temperature in quartz 28
of ⇠95°C (for 10°C/Myr cooling rate; see Shuster and Farley (2005)), quartz in rocks 29
that reside near the surface for geologically long time periods accumulates significant 30
quantities of nucleogenic21Ne via this process, and this can present an obstacle to ac- 31
curately measuring the amount of cosmogenic21Ne. Given a series of subsurface21Ne 32
measurements from a core, however, nucleogenic and cosmogenic21Ne can be dis- 33
tinguished because cosmogenic21Ne concentrations depend only on mass depth below 34
the surface, whereas nucleogenic21Ne concentrations are not related to mass depth, but 35
instead depend on the U and Th concentrations and closure age for the target mineral. 36
In the rest of this paper, we describe measurements of Ne isotopes in the core 37
and related samples, and fit a forward model for nuclide concentrations to the core 38
data. This allows us to (i) quantify the depth-dependence of near-surface spallogenic 39
production; (ii) estimate the quartz (U-Th)/Ne closure age in sandstone bedrock at 40
this site; (iii) show that there is no evidence for significant negative muon capture 41
production of21Ne; and (iv) derive limits for the interaction cross-section for fast muon 42
production of21Ne. 43
2. Analytical methods 44
2.1. The Beacon Heights sandstone core. 45
In January, 2009, a group associated with the ”CRONUS-Earth” project and led by 46
the Devonian Beacon Heights Orthoquartzite (McElroy and Rose, 1987) from a plateau 48
at 77.85°S, 160.77°W and 2183 m elevation on University Peak, in the Beacon Heights 49
region of the Quartermain Mountains, a subrange of the Transantarctic Mountains ad- 50
jacent to the McMurdo Dry Valleys. The purpose of choosing this site is that surface 51
erosion rates are in the range of cm/Myr, most likely close to the lowest observed any- 52
where on Earth, and geological evidence from the Dry Valleys region indicates that the 53
site has most likely been continuously exposed at an extremely low erosion rate for 54
perhaps as long as ⇠14.5 Ma (see Lewis et al., 2007, and references therein). Thus, 55
cosmogenic-nuclide concentrations in surface bedrock at this site are extremely high, 56
permitting accurate measurement, and the low erosion rate implies that concentrations 57
of radionuclides such as10Be and26Al are likely close to equilibrium concentrations 58
where production is balanced by radioactive decay, which facilitates production rate es- 59
timates for these nuclides (Borchers et al., 2016; Phillips et al., 2016; Balco, 2017). As 60
we will discuss below, the advantage of high concentrations in estimating production 61
rates applies to stable nuclides, but the equilibrium simplification does not. 62
Stone and co-workers at the University of Washington (UW) sectioned the core, 63
measured the density of core segments, and supplied subsamples to a number of other 64
laboratories for analysis. For this study, two laboratories (BGC and CRPG) made Ne 65
isotope measurements on three lots of samples originally prepared in di↵erent labora- 66
tories (Table 1). A set of 20 samples was prepared at UW for10Be and26Al analysis 67
by crushing, sieving to a grain size of 0.125-0.5 mm, etching in 1% HF at 50-70°C 68
for at three periods of at least 24 hours, and sieving again to remove material less than 69
0.125 mm. Henceforth we refer to these samples as ‘UW-sourced.’ Aliquots of these 70
etched samples were then provided to BGC for Ne analysis and measurement of U and 71
Th concentrations. A di↵erent set of 3 samples (‘Tulane-sourced’) was prepared sep- 72
arately for analysis of in-situ-produced14C at Tulane University by crushing, sieving 73
to a grain size of 0.25-0.5 mm, and etching in a 1% HF / 1% HNO3 solution at 50°C 74
for 2 24-hour periods. Aliquots of these etched samples were also provided to BGC. A 75
final set of 11 samples (‘CRPG-sourced’) was prepared at CRPG by crushing core seg- 76
ments, sieving, and hand-picking of quartz grains. These were not HF-etched, and Ne 77
and U/Th measurements were made at CRPG. Lastly, CRPG provided aliquots of three 78
of the CRPG-sourced samples, as prepared for Ne measurements, to BGC for interlab- 79
oratory comparison purposes. These were analyzed at BGC as received from CRPG 80
without further processing. Thus, 23 HF-etched core samples were analyzed only at 81
BGC, 8 non-etched samples were analyzed only at CRPG, and 3 non-etched samples 82
were analyzed at both BGC and CRPG. In addition, both laboratories analyzed the the 83
CRONUS-A and CREU-1 (Jull et al., 2015; Vermeesch et al., 2015) quartz standards 84
at the same time as core samples. 85
2.2. Holocene erratics of Beacon group sandstones from Mackay Glacier. 86
To further investigate nucleogenic21Ne concentrations in quartz in Beacon Group 87
sandstones, we also made Ne measurements on a set of sandstone erratic clasts adja- 88
cent to Mackay Glacier, ca. 75 km north of the Beacon Heights core site. These sam- 89
ples are Beacon Group sandstones, although we do not know what stratigraphic level 90
they originated at, that were collected for purposes of exposure-dating of Last Glacial 91
reference and also in Jones (2015). These samples are useful to us because they have 93
Holocene10Be exposure ages that record the most recent deglaciation of the site, so we 94
assume that they originated from subglacial erosion of fresh rock that has not previ- 95
ously been exposed at the surface, and have only experienced a single period of surface 96
exposure during the Holocene. Thus, we can measure total excess21Ne concentrations 97
in these samples and subtract cosmogenic21Ne concentrations calculated from10Be 98
exposure ages to yield an estimate of nucleogenic21Ne. Quartz separates were pre- 99
pared from these samples by Jones at Victoria University of Wellington by sieving to 100
extract the 0.25-0.5 mm grain size fraction and etching in 5% HF for a total of 5 days. 101
Aliquots of the same purified quartz separate used for10Be analysis were supplied to 102
BGC for Ne analysis. 103
2.3. Neon measurements at BGC 104
All quartz samples received at BGC had already been purified by either HF-etching 105
(UW-sourced, Tulane-sourced, and Mackay Glacier erratics) or hand-picking (CRPG- 106
sourced), so we did not process them further before measurement. BGC has two noble 107
gas analytical systems (the ”MAP-II” and ”Ohio” systems) that both consist of MAP- 108
215 sector field mass spectrometers with modernized ion-counting electronics coupled 109
to fully automated gas extraction systems. We used the MAP-II system for analysis of 110
UW-sourced and CRPG-sourced core samples, and the Ohio system for later analysis 111
of the Tulane-sourced core samples and the Mackay Glacier erratics. 112
Both systems employ a laser diode ”microfurnace” heating system in which ca. 150 113
mg of quartz is encapsulated in a tantalum packet, and the packet is then heated with 114
the laser under vacuum. An optical pyrometer is coaxial with the laser beam delivery 115
optics, and laser and pyrometer are coupled to a Watlow PID controller, enabling the 116
sample to be heated at a precisely controlled pyrometer temperature. The pyrometer 117
temperature is calibrated for the emissivity of the Ta packet by heating a thermocouple 118
in an identical apparatus; note, however, that precise temperature measurement is not 119
relevant for this work. Analysis of each sample involved 2-4 heating steps with the 120
final step at 1150-1200°C (see supplementary Table S1). In both systems, gas extracted 121
from the sample by laser heating is reacted with one or more SAES getters and frozen 122
to activated charcoal at 33 K. After pumping away non-adsorbed gases (presumably 123
mostly helium in this case), neon is released into the mass spectrometer at 75 K. 124
In both systems, Ne signals are measured by ion counting using a Channeltron- 125
type multiplier on masses 20, 21, and 22. Signals on masses 20 and 22 are corrected 126
for40Ar++and CO++
2 , respectively, using a39Ar spike as described in Balco and Shuster 127
(2009). Absolute calibration of Ne abundance on both systems is made by peak height 128
comparison against aliquots of an air standard containing between 5 ⇥ 10 16 and 2 ⇥ 129
10 14 mol Ne, processed in the same way as the samples and analyzed several times 130
daily. Ne sensitivity was linear within this range at all times. Corrections for mass 131
discrimination, when necessary, are also based on the air standard. Volume calibration 132
of the pipette systems and measurement of the pressure of the air standards during 133
loading employed several reference volumes and Baratron capacitance manometers, 134
and the absolute calibration is completely independent between the two systems. As 135
discussed below, measurements of the CRONUS-A and CREU-1 standards show that 136
2.4. Neon measurements at CRPG 138
At CRPG, individual quartz grains were selected from unprocessed crushed sam- 139
ples by hand-picking under a binocular microscope and cleaned in acetone in an ultra- 140
sonic bath for 10 minutes. They were then wrapped in 0.025 mm Cu foil (Alfa Aesar, 141
99.8% Cu) and placed under vacuum in a steel carousel that was then baked for 10 142
hours at 80°C. Neon was extracted in a custom-designed single vacuum resistance fur- 143
nace equipped with a boron nitride crucible (Zimmermann et al., 2012). Most samples 144
were heated in two 25-minute heating steps at 400°and 1250°C, followed by a final step 145
at 1250-1300°C to ensure complete extraction (see supplementary Table S2). Released 146
gases were exposed to activated charcoal cooled to liquid nitrogen temperature, tita- 147
nium sponges (Johnson Matthey mesh m3N8/t2N8) and SAES getters (ST172/HI/20- 148
10/650C). Ne and He were not separated and both were introduced into a VG5400 mass 149
spectrometer. Three Ne isotopes were measured using an electron multiplier and Ortec 150
ion counter. Isobaric interferences of40Ar++on mass 20 and CO++
2 on mass 22 were 151
found to be negligible compared to the total amount of Ne present. The mass spec- 152
trometer sensitivity was determined by peak height comparison against a Ne standard 153
containing 2.7⇥10 14mol20Ne and atmospheric Ne isotope composition, and found to 154
be linear within the range of Ne pressures observed in sample measurements. Furnace 155
blanks at 1000-1300°C for 25 minutes were (2.1 ± 0.1) ⇥ 10 16, (5.4 ± 0.1) ⇥ 10 19, and 156
(4.2 ± 0.2) ⇥ 10 17mol20Ne,21Ne, and22Ne respectively. 157
2.5. U and Th measurements at BGC and Caltech 158
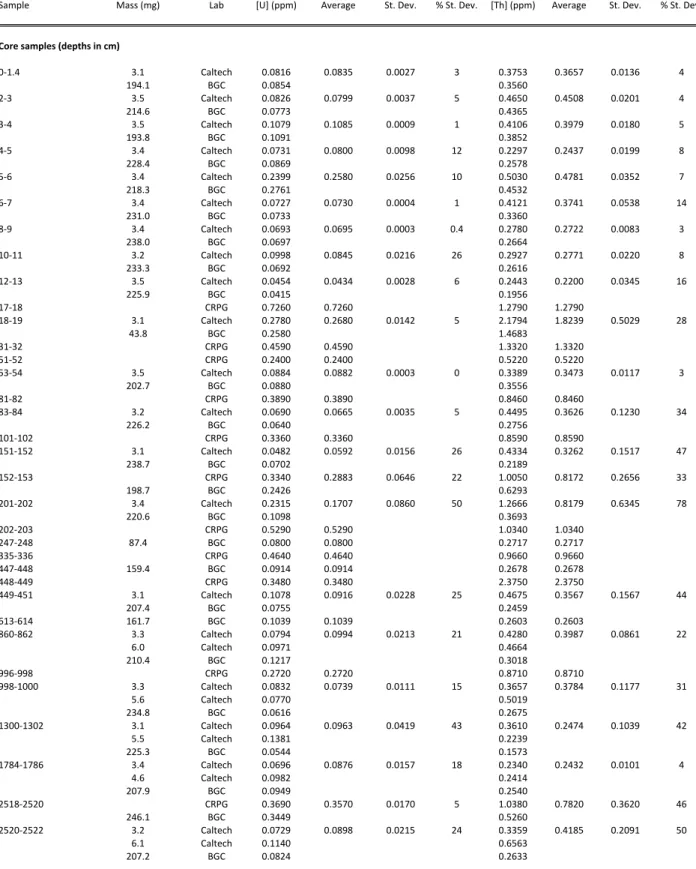
We measured U and Th concentrations in aliquots of the same purified quartz used 159
for Ne measurements by isotope dilution mass spectrometry (Tables 1,2; supplemen- 160
tary Table S4). Initially, we analyzed very small (3-6 mg) aliquots of the prepared 161
quartz at Caltech using a procedure developed for single grain (U-Th)/He chronom- 162
etry (House et al., 2000), in which the sample is spiked with a mixed235U - 230Th 163
spike, dissolved in concentrated HF, evaporated to dryness, and redissolved in a di- 164
lute HNO3solution for measurement of U and Th isotope ratios by ICP-MS. Although 165
nominal uncertainties in the resulting concentrations derived from the precision of the 166
isotope ratio measurements are less than 1%, U concentrations in replicates of some 167
samples di↵ered by up to 35%, and Th concentrations by up to 60%. We attributed this 168
to a nugget e↵ect caused by inhomogeneity of detrital quartz grains in the sandstone 169
combined with the small sample size, so we then analyzed much larger aliquots (100- 170
300 mg) of UW-sourced and Tulane-sourced samples, as well as the Mackay Glacier 171
erratics, at BGC. We used a similar procedure in which we dissolved the quartz in con- 172
centrated HF, evaporated SiF4to remove Si, redissolved remaining trace elements in a 173
dilute HNO3- trace HF mixture, spiked a subsample of this solution with a mixed233U 174
-229Th spike, and measured U and Th isotope ratios in the spiked subsample using a 175
Thermo Neptune ICP-MS. Although we cannot internally verify quantitative recovery 176
of U and Th after sample drydown using this procedure, experiments with a normal 177
solution containing known U and Th concentrations indicated complete recovery. 178
Replicate measurements on large aliquots also showed large di↵erences in U and 179
Th concentrations (see supplementary Table S4). This is consistent with the idea that 180
significant fractions of U and Th in these samples may be concentrated in rare individ- 181
also shows that the e↵ect is not mitigated by increasing the sample size. We hypothe- 183
size that this e↵ect may be characteristic of detrital sandstones containing quartz grains 184
with a diverse provenance, and might not be observed in quartz in igneous or metamor- 185
phic rocks. Regardless, it is clear that the actual reproducibility of these measurements 186
is much less precise than the nominal measurement uncertainties for each aliquot, so 187
we have disregarded the nominal measurement uncertainties. In Tables 1 and 2, we 188
show average U and Th concentrations for all aliquots analysed for each sample, re- 189
gardless of aliquot size. Given the available data and lacking a complete explanation 190
for excess scatter, the true measurement uncertainty for U and Th measurements is 191
most likely best approximated by the average standard deviation of replicate measure- 192
ments on samples that were analyzed multiple times, which is is 17% for U and 27% 193
for Th. We revisit this issue later in the model-fitting section. 194
2.6. U and Th measurements at CRPG 195
U and Th concentrations in CRPG-sourced quartz samples were measured using 196
the standard procedure at the Service d’Analyse des Roches et des Minraux (SARM- 197
CRPG), which consists of LiBO2fusion, dissolution of the fusion residue, and ICPMS 198
measurement of U and Th concentration by peak height comparison with a standard. 199
2.7. Calculation of excess21Ne 200
Neon in natural quartz is typically a mixture of (i) ”trapped” neon with atmospheric 201
isotope composition, (ii) cosmogenic neon, and (iii) nucleogenic21Ne and22Ne de- 202
rived from alpha capture reactions on18O and 19F, respectively (Niedermann et al., 203
1993; Niedermann, 2002). In rare cases an additional ”trapped” component with non- 204
atmospheric isotope ratios is also present (e.g., Hetzel et al., 2002). Even in typical 205
cases where the trapped component has atmospheric composition, it is generally not 206
possible to accurately perform a three-component deconvolution from measurements 207
of three isotopes, because (i) the relative abundance of O and F, and thus the isotope 208
composition of the nucleogenic end member, are unlikely to be known, and (ii) nucle- 209
ogenic neon is typically a minor component that is present at the level of analytical 210
precision in the total neon concentration measurement, so it cannot be deconvolved 211
precisely. In this work, we found no evidence for a non-atmospheric trapped compo- 212
nent (see discussion below), so we assume that neon in all samples consists of a three- 213
component mixture of atmospheric, cosmogenic, and nucleogenic neon. Commonly, 214
one would estimate cosmogenic21Ne concentrations in this situation by assuming that 215
nucleogenic21Ne is negligible, assuming that the sample is a two-component mixture 216
of atmospheric and cosmogenic21Ne, and computing the cosmogenic21Ne concentra- 217
tion by a two-component deconvolution based on the21Ne/20Ne ratio. However, as we 218
show below, nucleogenic21Ne concentrations are significant in many of our samples, 219
so we did not use this procedure and for each analysis we computed excess21Ne with 220
respect to atmospheric composition (N21,xs) as: 221
N21,xs=N21,m R2120,aN20,m (1)
where N21,mis the total amount of21Ne released in an analysis, N20,mis the total 222
amount of20Ne released in an analysis, and R
2120,ais the21Ne/20Ne ratio in the atmo- 223
the amount of cosmogenic20Ne is negligible in comparison to the amount of20Ne con- 225
tributed by atmospheric neon. In this formulation N21,m, N20,m, and N21,xscould either 226
pertain to a number of atoms (e.g., units of mol) or a concentration (mol g 1or atoms 227
g 1). 228
Excess 21Ne computed in this way includes both cosmogenic and nucleogenic 229
21Ne. In subsequent sections we di↵erentiate these two components by fitting a for- 230
ward model for nucleogenic and cosmic-ray production of21Ne to the data. For com- 231
pleteness, note that we assume that no cosmogenic21Ne from initial exposure during 232
sandstone deposition in the Devonian is present; any such21Ne inventory that may have 233
existed is expected to have been lost during reheating associated with emplacement of 234
183 Ma Ferrar Dolerite intrusions (see additional discussion below). 235
3. Results 236
3.1. Neon isotope ratios 237
Complete three-isotope results of step-degassing neon measurements are shown in 238
the supplementary material. Neon isotope ratios in all analyses were indistinguishable 239
from a two-component mixing line between cosmogenic and atmospheric Ne. This 240
agrees with many previous neon measurements in quartz from Beacon Group sand- 241
stones (Summerfield et al., 1999; Balco and Shuster, 2009; Balco et al., 2014; Middle- 242
ton et al., 2012; Vermeesch et al., 2015). Although we will show later that cosmogenic 243
neon is nearly negligible in the Mackay Glacier erratics as well as some samples from 244
deep in the core, and therefore neon in these samples must contain only atmospheric 245
and nucleogenic components, we did not find that neon isotope ratios in these samples 246
were distinguishable from the atmospheric-cosmogenic mixing line. Primarily this is 247
because the precision of22Ne measurements is insufficient to distinguish nucleogenic 248
from cosmogenic21Ne enrichments in the presence of much larger amounts of atmo- 249
spheric Ne (also see discussion in Middleton et al., 2012). In addition, it is possible 250
that nucleogenic22Ne as well as21Ne is present, which could make it impossible to 251
distinguish nucleogenic from cosmogenic21Ne excesses no matter what the22Ne mea- 252
surement precision. Thus, as noted above, we have not attempted to di↵erentiate nu- 253
cleogenic and cosmogenic21Ne using the isotope ratio data alone, but instead compute 254
excess21Ne with respect to atmospheric composition and then resolve this quantity into 255
nucleogenic and cosmogenic contributions by considering the production systematics 256
of both. 257
The proportion of total neon attributable to trapped Ne with atmospheric composi- 258
tion varies systematically between groups of samples prepared in di↵erent laboratories. 259
CRPG-sourced samples, that were not HF-etched, had 124 ± 30 Matoms g 1(mean and 260
standard deviation of 11 samples)21Ne attributable to atmospheric Ne. UW-sourced 261
samples that were repeatedly HF-etched to achieve low Al concentrations necessary 262
for26Al measurement had 49 ± 11 Matoms g 1 (n = 20). This suggests that trapped 263
atmospheric Ne is preferentially located in grain coatings or in secondary diagenetic 264
silica cement, both of which would be removed during HF etching, rather than in quartz 265
grains itself. However, Tulane-sourced samples and Mackay Glacier erratics, that were 266
Matoms g 1, respectively, which may instead indicate a grain-size dependence: UW- 268
sourced samples were derived from finer grain-size fractions of crushed rock. 269
On the other hand, there is no evidence that sample pretreatment a↵ected cosmo- 270
genic21Ne concentrations. No such e↵ect is expected, because measurements of Ne 271
di↵usion kinetics in quartz (Shuster and Farley, 2005) do not predict significant di↵u- 272
sive Ne loss from heating to ⇠ 50°-70°C for several days during quartz etching. As 273
we show later, di↵erences in excess21Ne between di↵erently-treated sample lots can 274
be fully accounted for by di↵erences in nucleogenic Ne concentrations that arise from 275
corresponding di↵erences in U and Th concentrations. 276
3.2. Normalization between analytical systems 277
Measurements of the CRONUS-A and CREU-1 quartz standards showed that the 278
three noble gas analytical systems used for this work had significant di↵erences in 279
absolute calibration. Measurements of these standards at CRPG and on the BGC 280
MAP-II system during the period of the Beacon Heights core measurements are de- 281
scribed in Vermeesch et al. (2015) and show an o↵set of 13% between the two systems. 282
Later measurements of the CRONUS-A standard on the BGC Ohio system run at the 283
same time as core samples yielded a concentration of 319.0 ± 1.7 Matoms g 1 (error- 284
weighted mean and standard error of 15 measurements), and a di↵erent set of measure- 285
ments run at the same time as the Mackay Glacier samples yielded 320.1 ± 6.8 Matoms 286
g 1(error-weighted mean and standard error of 15 measurements) , which agree with 287
the consensus value for this standard given by Vermeesch et al. (2015), but di↵er from 288
results obtained on both the CRPG and BGC MAP-II systems. In addition, as noted 289
above, we performed replicate analyses of three core samples on the CRPG and BGC 290
MAP-II systems, and the results of these replicates were consistent with the o↵set de- 291
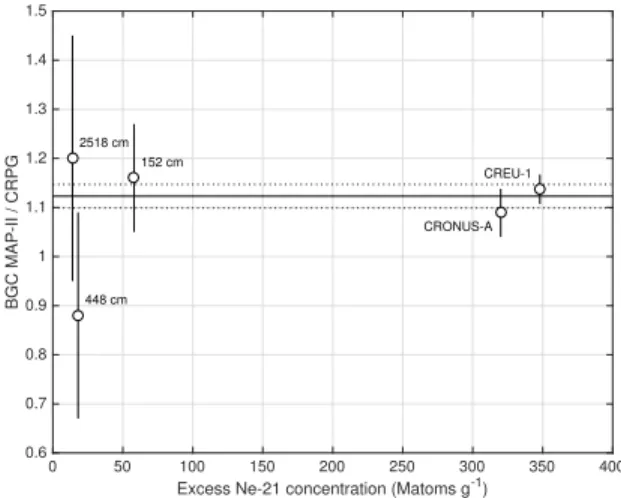
rived from the CRONUS-A and CREU-1 standards (Figure 1). To obtain an internally 292
consistent set of excess21Ne concentrations for subsequent analysis, therefore, we as- 293
sumed that the o↵sets in replicate measurements between analytical systems reflect 294
di↵erences in the absolute calibration of the primary gas standards used for sensitivity 295
calibration on each system, and renormalized all data to reference values for excess 296
21Ne concentrations given by Vermeesch et al. (2015) for CREU-1 and CRONUS-A of 297
348 and 320 Matoms g 1, respectively, using the following procedure. First, we renor- 298
malized CRPG data to be consistent with BGC MAP-II data using the error-weighted 299
mean of the o↵sets of all replicate data shown in Figure 1, which is 1.122. Second, we 300
then renormalized the resulting combined data set to a reference value for CRONUS-A 301
of 320 Matoms g 1using a correction factor of 0.944, which is based on a data set of 302
21 analyses of CRONUS-A performed on the BGC MAP-II system around the time 303
the core samples were analysed, including the measurements reported in Vermeesch 304
et al. (2015) as well as others. Third, measurements of CRONUS-A on the BGC Ohio 305
system were indistinguishable from the reference value of 320 Matoms g 1, so mea- 306
surements on this system were not renormalized. We propose that the result of this 307
procedure is an internally consistent set of measurements of excess21Ne referenced to 308
the summary values of CRONUS-A and CREU-1 proposed by Vermeesch et al. (2015). 309
Note that we did not apply uncertainties in the correction factors to compute expanded 310
we did this, we would no longer be able to treat measurement uncertainties as indepen- 312
dent between samples, which would complicate the model fitting exercises we describe 313
later. 314
0 50 100 150 200 250 300 350 400
Excess Ne-21 concentration (Matoms g-1)
0.6 0.7 0.8 0.9 1 1.1 1.2 1.3 1.4 1.5 BGC MAP-II / CRPG 152 cm 448 cm 2518 cm CREU-1 CRONUS-A
Figure 1: O↵set between excess21Ne concentrations as measured on BGC MAP-II and CRPG systems for
the CRONUS-A and CREU-1 standards and three core samples analysed on both systems. The y-axis is
the ratio of the excess21Ne concentration as measured on the BGC MAP-II system to that measured on the
CRPG system. Horizontal line shows the error-weighted mean of these data (1.123) used to normalize data
from these systems to each other as well as the corresponding standard error (0.024). The reduced 2statistic
with respect to the error-weighted mean is 0.6.
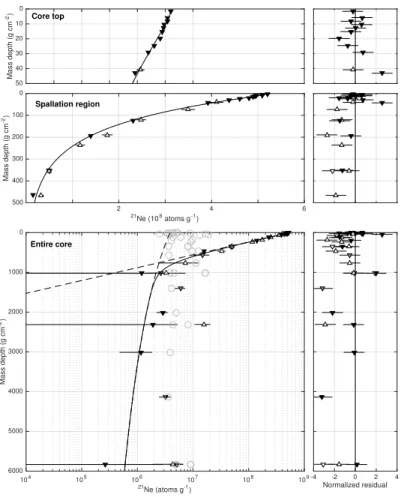
3.3. Basic observations 315
Figure 2 shows excess 21Ne concentrations in the core, normalized to standard 316
reference values as described above, as well as U and Th concentrations. In this section, 317
we highlight several important aspects of the results that we will seek to explain in 318
detail in subsequent sections. 319
3.3.1. Nucleogenic21Ne in shielded samples 320
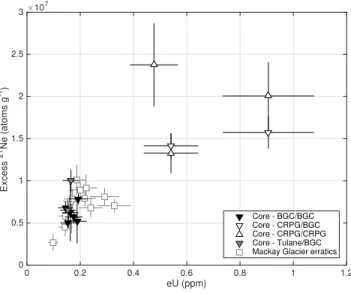
Figure 3 shows the relationship between excess 21Ne and eU in samples deeper 321
than 1000 g cm 2in the core, where cosmic-ray production is expected to be minimal. 322
eU approximates total alpha particle production from U and Th decay and is defined 323
as ([U] + 0.235[Th]), where [U] and [Th] are U and Th concentrations in ppm. This 324
relationship highlights two observations. First, U, Th, and21Ne concentrations are sys- 325
tematically lower in UW- and Tulane-sourced quartz samples, which were prepared 326
by HF-etching, than in CRPG-sourced samples, which were not HF-etched (also see 327
Figure 2). This indicates that in this lithology U and Th concentrations are higher in 328
secondary grain coatings or diagenetic silica cement, that were presumably preferen- 329
tially removed by HF etching, than in the interior of the quartz grains themselves. This 330
106 107 108 109 Excess 21Ne (atoms g-1) 0 1000 2000 3000 4000 5000 6000 Mass depth (g cm -2) Entire core 2 4 6 Excess 21Ne (108 atoms g-1) 0 100 200 300 400 500 Mass depth (g cm -2) Spallation region CRPG source/CRPG analysis UW source/BGC analysis CRPG source/BGC analysis Tulane source/BGC analysis 0 10 20 30 40 50 Mass depth (g cm -2) Core top 0 0.5 1 [U] (ppm) 0 1 2 3 [Th] (ppm)
Figure 2: Excess21Ne concentrations (left panels) and U and Th concentrations (right panels) in quartz
samples from the Beacon Heights core. The data are the same in all three sets of panels, but the axes are di↵erent so as to adequately show details in all parts of the core. Symbol shading denotes the sample lots: black, UW-sourced, white, CRPG-sourced, and gray, Tulane-sourced. Symbol shape denotes the location of the analysis: upward-pointing triangle, CRPG; downward-pointing, BGC.
present as contaminants in diagenetic silica cement. Second, eU is correlated with ex- 332
cess21Ne in the shielded part of the core (p = 0.004). Although presumably some 333
nonzero fraction of measured excess21Ne in deep core samples is cosmogenic, this 334
correlation indicates that the majority of excess21Ne in these samples is nucleogenic 335
rather than cosmogenic. 336
Figure 3 also shows the relationship between eU and nucleogenic 21Ne in the 337
Mackay Glacier erratic samples. Table 2 shows the calculation of nucleogenic21Ne 338
in these samples: we computed cosmogenic21Ne from measured10Be concentrations 339
by assuming an21Ne/10Be production ratio of 4 (see discussion below), then subtracted 340
this from the observed excess21Ne concentration to yield an estimate of nucleogenic 341
21Ne. eU and nucleogenic21Ne in these samples are correlated (p = 0.07), as expected 342
if we have correctly estimated nucleogenic21Ne, U, and Th concentrations, and are 343
consistent with the deep core samples. This also suggests that excess21Ne in deep core 344
samples is predominantly nucleogenic. 345
Table 2 also shows calculated Ne closure ages (using Equation 3 below) for the 346
Mackay Glacier erratics; these are scattered between 135-351 Ma with mean and stan- 347
dard deviation 233 ± 62 Ma. If we assume, as discussed above, that typical uncertain- 348
ties in U and Th concentrations are ⇠20% and ⇠30%, respectively, this implies a total 349
uncertainty in alpha particle production and thus in closure age estimates of ⇠20-25%. 350
A 25% uncertainty on each age would imply reduced 2 = 1.1 with respect to the 351
mean, indicating that these estimates of closure age are imprecise but at least internally 352
consistent. As discussed in more detail below, we expect the Ne closure age of Beacon 353
Group sandstones to be similar to or less than the 183 Ma age of Ferrar dolerite in- 354
trusions that are pervasive within Beacon Group sandstones in the Dry Valleys (Bernet 355
and Gaupp, 2005; Burgess et al., 2015), and these closure ages, although imprecise, are 356
consistent with this hypothesis. 357
3.3.2. Limited muon-produced inventory 358
An additional implication of the correlation between eU and excess21Ne in shown 359
in Figure 3 is that only a small fraction of excess21Ne observed in the core below 360
1000 g cm 2is cosmogenic; if excess21Ne was predominantly cosmogenic, we would 361
expect weak or no correlation with eU. Thus, the concentration of muon-produced 362
21Ne is much smaller than that of nucleogenic21Ne. This potentially makes it difficult 363
to accurately infer production rates due to muons from these data. 364
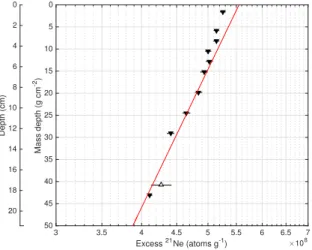
3.3.3. Surface fast neutron albedo e↵ect 365
Figure 4 shows that nuclide concentrations near the bedrock surface diverge from 366
the exponential relationship expected for spallogenic production. Presumably, this is 367
due to a secondary particle escape or ”albedo” e↵ect that arises from the fact that the 368
mean atomic weight of nuclei in rock is greater than that in air, so production of sec- 369
ondary neutrons with energies sufficient to induce21Ne production by Si spallation is 370
higher in rock than in air. Thus, the gradient in neutron density at the surface results in 371
”escape” of some neutrons from rock into air, and a corresponding reduction in21Ne 372
production at the surface. This e↵ect is predicted by first-principles particle transport 373
models of cosmic-ray interactions with the Earth that aim to simulate cosmogenic- 374
0 0.2 0.4 0.6 0.8 1 1.2 eU (ppm) 0 0.5 1 1.5 2 2.5 3 Excess 21 Ne (atoms g -1) ×107 Core - BGC/BGC Core - CRPG/BGC Core - CRPG/CRPG Core - Tulane/BGC Mackay Glacier erratics
Figure 3: Relationship between eU and excess21Ne in samples deeper than 1000 g cm 2in the core and
between eU and nucleogenic21Ne in Mackay Glacier erratics. The symbols for core samples are the same as
in Figure 2. Both eU and excess21Ne concentrations are significantly higher in CRPG-sourced samples that
were not HF-etched. Error bars show measurement uncertainties for21Ne concentrations and an assumed
et al., 2013). However, it is not generally observed in actual data sets of cosmogenic- 376
nuclide measurements, presumably because one would only expect to observe it where 377
(i) the surface erosion rate is low enough to prevent advection of rock from below 378
through the thin near-surface zone where this e↵ect is important, and (ii) nuclide con- 379
centrations are high enough that small deviations from an exponential relationship can 380
be accurately measured. To our knowledge, the only other data set that shows this ef- 381
fect is the26Al measurements from the same core (Borchers et al., 2016; Phillips et al., 382
2016). 383 3 3.5 4 4.5 5 5.5 6 6.5 7 Excess 21Ne (atoms g-1) ×108 0 5 10 15 20 25 30 35 40 45 50 Mass depth (g cm -2) 0 2 4 6 8 10 12 14 16 18 20 Depth (cm)
Figure 4: Excess21Ne in the uppermost 50 g cm 2of the core compared to a representative simple
exponen-tial depth dependence with an e-folding length of 140 g cm 2. Concentrations systematically diverge from
an exponential relationship in the upper ca. 20 g cm2. In this plot, excess21Ne concentrations have not
been corrected for variable amounts of nucleogenic21Ne resulting from varying [U] and [Th], so show more
scatter than would be present for cosmogenic21Ne alone. We discuss this in more detail in the model fitting
section below.
3.3.4. Comparison to10Be and26Al concentrations 384
Borchers et al. (2016) as well as Balco (2017) estimated muon interaction cross- 385
sections for10Be and26Al production by fitting a production model to10Be and26Al 386
concentrations in the Beacon Heights core under the assumption that10Be and 26Al 387
concentrations had reached equilbrium with steady erosion, that is, the surface had 388
been steadily eroding at the same rate for a duration of at least several half-lives of 389
these nuclides. However, surface21Ne concentrations at the site are not consistent with 390
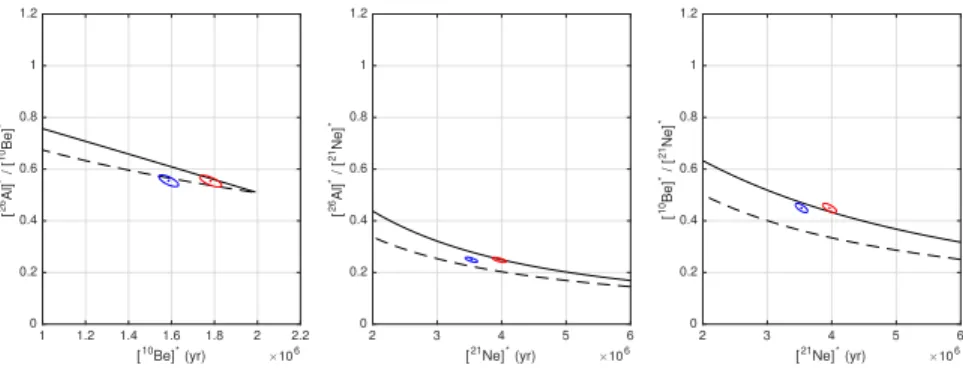
this assumption. Figure 5 shows surface10Be, 26Al, and 21Ne concentrations com- 391
pared to predicted concentrations for a single period of exposure with zero erosion (the 392
”simple exposure line”) and steady erosion for a long enough period for surface nu- 393
clide concentrations to reach equilibrium between production and loss by radioactive 394
decay (for radionuclides) and surface erosion (the ”steady erosion line”). Although the 395
1 1.2 1.4 1.6 1.8 2 2.2 [10Be]* (yr) ×106 0 0.2 0.4 0.6 0.8 1 1.2 [ 26Al] * / [ 10 Be] * 2 3 4 5 6 [21Ne]* (yr) ×106 0 0.2 0.4 0.6 0.8 1 1.2 [ 26Al] * / [ 21 Ne] * 2 3 4 5 6 [21Ne]* (yr) ×106 0 0.2 0.4 0.6 0.8 1 1.2 [ 10Be] * / [ 21Ne] *
Figure 5: Paired nuclide diagrams for normalized10Be,26Al, and21Ne concentrations in the core surface
sample. 10Be and26Al concentrations are from Borchers et al. (2016). In all diagrams, the solid black
line is the simple exposure line and the dashed black line is the steady erosion line. Red and blue ellipses show normalized nuclide concentrations predicted by the Antarctic atmosphere model of Stone (2000) and production rate scaling methods of Stone (2000) and Lifton et al. (2014), respectively, as implemented in version 3 of the online exposure age calculators described by Balco et al. (2008) and subsequently updated.
We assumed that the21Ne/10Be production ratio is 4.0 for both scaling methods (Balco and Shuster, 2009;
Kober et al., 2008; Amidon et al., 2009; Kober et al., 2011).
not. In contrast,21Ne-26Al and21Ne-10Be pairs are better predicted by simple expo- 397
sure at negligible erosion. This is not unexpected, because21Ne is not radioactive, so 398
it requires a much longer time to reach production-erosion equilibrium than radionu- 399
clides would require to reach production-decay-erosion equilibrium. This comparison 400
is somewhat complicated by the facts that our assumed surface production ratios (i) do 401
not take account of fast neutron albedo e↵ects discussed above, and (ii) are based on 402
some studies (e.g., Balco and Shuster, 2009) that estimated the21Ne/10Be production 403
ratio by using assumptions about muon production that we will show to be incorrect. 404
However, these e↵ects are much smaller than the di↵erence in predicted21Ne concen- 405
trations for steady-erosion and simple-exposure end members, so they do not a↵ect the 406
overall conclusion. In any case, this comparison indicates, as expected, that we can- 407
not take advantage of the assumption that surface nuclide concentrations have reached 408
production-erosion steady state to estimate21Ne production rates at this site. It also 409
indicates that the use of this assumption by Borchers et al. (2016) and Balco (2017) 410
may have caused them to slightly underestimate26Al and10Be production rates due to 411
negative muon capture, although this e↵ect is likely to be small. 412
4. Model fitting 413
In this section we formulate a forward model for excess21Ne concentrations in core 414
samples and attempt to use it to constrain several unknown parameters in the model that 415
are related to nucleogenic and muon-induced21Ne production. 416
Measured excess21Ne as calculated with Equation 1 includes nucleogenic21Ne as 417
well as cosmogenic21Ne produced by cosmic-ray neutron spallation and muon inter- 418
N21,xs=N21,nuc+N21,sp+N21,µ +N21,µ f (2) N21,xs (atoms g 1) is excess21Ne, N21,nuc (atoms g 1) is nucleogenic21Ne, N21,sp 420
(atoms g 1) is21Ne produced by high-energy neutron spallation, N21,µ (atoms g 1) is 421
21Ne produced by negative muon capture, and N21,µ f (atoms g 1) is21Ne produced by 422
fast muon interactions. 423
Nucleogenic21Ne due to U and Th decay is: 424
N21,nuc= X i fiFT,iY↵,iNi ⇣ eitc 1⌘ (3)
where the index i refers to each radionuclide that acts as an alpha particle source, 425
including232Th,235U, and238U. We disregard147Sm as insignificant. Niis the concen- 426
tration (atoms g 1) of nuclide i, iis the decay constant of nuclide i (yr 1), Y↵,iis the 427
yield of alpha particles throughout the decay chain of nuclide i (Y↵,232=6; Y↵,235=7, 428
and Y↵,238=8; we assume secular equilibrium for each decay chain), fiis the fraction 429
of alpha particles produced from decay of nuclide i that react with18O to produce21Ne; 430
and tcis a neon closure age (yr), which represents the time at which the mineral cooled 431
sufficiently to retain21Ne. The fractions f
ifor quartz are given by Cox et al. (2015) 432
and are f232=6.08 ⇥ 10 8; f235=5.62 ⇥ 10 8; and f238=4.04 ⇥ 10 8. We discuss the 433
factor FT,iin the next paragraph, leaving the neon closure age tCas the only unknown 434
parameter in this formula. 435
FT,iis a factor that describes the fraction of alpha particles that are ejected at grain 436
boundaries and thus cannot induce reactions within the grain (Farley et al., 1996). For 437
samples that were prepared by HF etching, alpha-depleted grain boundaries have pre- 438
sumably been removed and FT,i = 1 always. For CRPG-sourced samples that were 439
not HF-etched, this is not the case, but the observation that bulk U and Th concen- 440
trations decrease substantially with etching indicates that U and Th are concentrated 441
near grain boundaries, which violates the assumption of uniform U and Th distribution 442
needed to compute FT,iin the usual fashion. To address this, we observe that mean eU 443
in un-etched, CRPG-sourced samples is 2.8 times mean eU in etched samples. If we 444
assume that the U and Th removed by etching is located exactly at the grain boundary, 445
then 64% of eU is concentrated at the grain boundary. We can coarsely approximate 446
FT as a single, non-nuclide-dependent value for total alpha production by observing 447
that if 64% of eU is concentrated at the grain boundary, and by definition half of al- 448
pha particles produced at the grain boundary are not implanted within the grain, then 449
FT=(1 (0.64/2)) = 0.68. Although this approximation is speculative, it is consistent 450
with the data shown in Figure 3 in that for these data the observed mean ratio of excess 451
21Ne to eU in unetched, CRPG-sourced samples is less than that in HF-etched samples. 452
To summarize, we assume for all i that FT,i=1 for etched samples and FT,i=0.68 for 453
un-etched samples. 454
The remainder of the terms in Equation 2 describe cosmogenic21Ne. Cosmogenic- 455
nuclide production due to fast neutron spallation is, in nearly all other work (e.g., Lal, 456
1988), assumed to decrease exponentially with mass depth below the surface such that: 457
P21,sp(z) = P21,sp(0)e z
where z is mass depth below the surface (g cm 2), P
21,sp(z) is the21Ne produc- 458
tion rate due to spallation (atoms g 1 yr 1) at depth z, P
21,sp(0) is the surface 21Ne 459
production rate due to spallation (atoms g 1 yr 1), and ⇤
sp is an e↵ective e-folding 460
length for spallogenic production (g cm 2). However, in our data set, the evidence for 461
near-surface secondary particle escape e↵ects shown in Figure 4 means that a single- 462
exponential formula is not adequate. Because we do not have a first-principles estimate 463
of the exact form of the depth-dependence of the production rate due to this e↵ect, we 464
approximate it by assuming: 465
P21,sp(z) = P21,sp(0)e z
⇤sp P21,sp(0) fae ⇤az (5)
where f a (dimensionless) and ⇤a(g cm 2) account for near-surface escape losses 466
(e.g., see Phillips et al., 2001). 467
With this approximation, spallogenic21Ne as a function of mass depth z is: 468
N21,sp(z) = P21,sp(0) Z t 0 e z+✏⌧ ⇤spd⌧ P21,sp(0) fa Z t 0 e z+✏⌧ ⇤ad⌧ (6) N21,sp(z) = P21,sp(0)e z ⇤sp⇤sp ✏ ⇣ 1 e ⇤✏spt⌘ P21,sp(0) fae z ⇤a⇤a ✏ ⇣ 1 e ⇤a✏ t⌘ (7)
where t is the duration of exposure (yr) and ✏ is the surface erosion rate (g cm 2 469
yr 1). ⌧ is a variable of integration. 470
21Ne production by muons is taken from Heisinger et al. (2002a,b) and is: 471
N21,µ (z) = f21⇤ Z t 0 Rµ (z + ✏⌧) fCfdd⌧ (8) N21,µ f(z) = 0,21 Z t 0 (z + ✏⌧) (z + ✏⌧) ¯E ↵(z + ✏⌧)N id⌧ (9)
These two expressions are composed of (i) a muon flux (for fast muon interac- 472
tions) or stopping rate (for negative muon capture) integrated throughout the exposure 473
history of the sample, multiplied by (ii) a likelihood or cross-section for production 474
of 21Ne. The integral terms are fully defined at any depth z by formulae given in 475
Heisinger et al. (2002a,b) (see the Heisinger papers for the definition of the symbols). 476
We evaluate them using the ”Model 1A” MATLAB code of Balco (2017), setting the 477
parameter ↵ to 1 (see discussion in Borchers et al., 2016; Balco, 2017). Given expo- 478
sure time t and erosion rate ✏, this leaves as remaining unknown parameters a negative 479
muon capture probability for21Ne production from Si ( f⇤
21; dimensionless), and a fast 480
muon interaction cross-section for21Ne production from Si by 1 GeV muons (
0,21; 481
barns). Although Heisinger et al. experimentally determined values for these param- 482
eters for reactions producing many cosmogenic nuclides, they did not do so for21Ne. 483
Fernandez-Mosquera et al. (2008) estimated values from analogue reactions, but one 484
of our aims in this paper is to independently constrain the value of these parameters 485
Thus,21Ne concentrations in our samples can be predicted with a forward model 487
consisting of Equations 2, 3, 7, 8, and 9. Assuming the surface production rate of21Ne 488
is known, this model has 8 unknown parameters: the exposure time t; surface erosion 489
rate ✏, neon closure age tC; parameters describing the depth-dependence of spallogenic 490
production ⇤sp, ⇤a, and fa; and muon interaction parameters f21⇤ and 0,21. It is not 491
possible to estimate all these parameters at once; for example, many combinations of 492
age and erosion rate can be made to fit the data well by adjusting the muon interaction 493
cross-sections. In the case of radionuclides (e.g.,10Be,26Al,36Cl, or14C) measured at 494
a site that has experienced a long period of exposure at a low erosion rate, the situa- 495
tion can be simplified by assuming that the exposure time has been long enough that 496
the nuclide concentrations at any depth have reached equilibrium between production, 497
radioactive decay, and advection toward the surface due to erosion. In that case, given 498
that the surface production rate is known, one can determine the erosion rate and the 499
muon interaction cross-sections simultaneously (e.g., Stone et al., 1998; Balco, 2017). 500
If the erosion rate is low enough in relation to the decay constant of the nuclide in 501
question, then the muon interaction cross-sections can be determined independently 502
of the erosion rate. However, that is not possible with21Ne, because, for a stable nu- 503
clide, as the erosion rate approaches zero, the time required for nuclide concentrations 504
to reach production-erosion equilibrium approaches infinity. An additional complica- 505
tion (which is also applicable to radionuclides, although less important at low erosion 506
rates), is that the erosion rate may have been unsteady, so that the e↵ective erosion rate 507
experienced during the time that the near-surface spallogenic21Ne inventory accumu- 508
lated may be di↵erent from the e↵ective erosion rate during the longer period of time 509
in which the subsurface muon-produced21Ne inventory accumulated. 510
4.1. Zero-erosion end member 511
Because we cannot uniquely determine all unknown parameters, we will focus on 512
obtaining limits on some of them. We begin by assuming that the surface erosion rate ✏ 513
is zero and the surface21Ne production rate is 133 atoms g 1yr 1, which is computed 514
by calculating the10Be production rate for the ’St’ scaling method using version 3 of 515
the online exposure age calculator described by Balco et al. (2008) and subsequently 516
updated, and applying a total21Ne/10Be production ratio of 4.0 (Balco and Shuster, 517
2009; Amidon et al., 2009; Kober et al., 2011). This leaves seven unknown parameters: 518
t, tC, ⇤sp, ⇤a, fa, f21⇤, and 0,21. We fit this model to the data by minimizing a chi- 519
squared misfit statistic: 520
M =X j 2 66666 4p( NN21,xs,p, j N21,xs,m, j 21,xs,p, j)2+( N21,xs,m, j)2 3 77777 5 2 (10)
where N21,xs,m, j and N21,xs,m, j are the measured excess 21Ne concentration and 521
measurement uncertainty for sample j, and N21,xs,p, jis the excess21Ne concentration 522
predicted by the model for sample j. The uncertainty in the predicted concentration 523
N21,xs,p, jstems from the uncertainty in estimating nucleogenic21Ne concentrations, 524
which is in turn derived from uncertainties in measuring bulk U and Th concentrations. 525
As discussed above, this uncertainty is likely much greater than the nominal uncer- 526
samples equally, however, would not change the relative weighting of samples in the 528
model-fitting calculation, and we have little basis for arguing that any estimate of this 529
expanded uncertainty would be accurate, so for fitting models to the data we assume 530
N21,xs,p, j=0. The only constraint we imposed on the parameter values for this fitting 531
exercise is that all must be greater than zero. 532
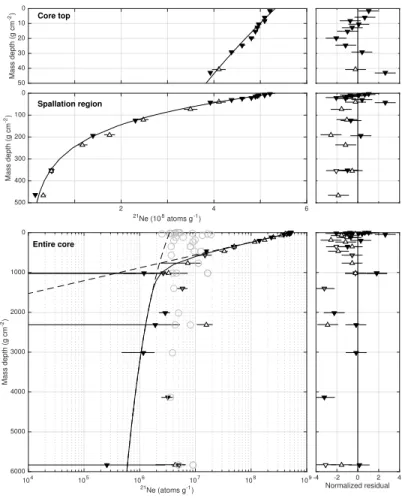
Figure 6 shows the result of fitting this model to the data. The minimum value of 533
the fitting parameter M is 133 for 30 degrees of freedom (37 data less 7 fitted parame- 534
ters). At face value this implies a vanishingly small probability that model-data misfit 535
is consistent with measurement uncertainties, but this value for M is unrealistically 536
high because we have not included any uncertainty in predicted21Ne concentrations 537
stemming from uncertainty in U and Th concentrations, and also possibly because we 538
did not include correlated uncertainties stemming from interlaboratory standardization. 539
For example, if we assume a 25% uncertainty in estimates of nucleogenic21Ne (see dis- 540
cussion above), M = 61 for this model fit, so it is unclear how to best to evaluate the 541
quality of the model fit. The best-fitting exposure age t is 4.1 Ma, in agreement with 542
the apparent10Be exposure age, as expected from Figure 5. Optimal values of param- 543
eters related to spallogenic production are ⇤sp=140.2 g cm 2, which agrees precisely 544
with values for26Al (144.7 ± 2.3) and10Be (140.5 ± 1.1) in the core determined by 545
Borchers et al. (2016); ⇤a=6.8 g cm 2; and fa=0.043. 546
The best-fitting neon closure age tCis 156 Ma. This implies substantial nucleogenic 547
21Ne concentrations in these samples, in the range 3-18 Matoms g 1for etched samples 548
and 7-19 Matoms g 1for un-etched samples. Nucleogenic21Ne accounts for nearly all 549
21Ne present in samples below ⇠1000 g cm 2depth (Fig. 6). 550
Because we assume a finite exposure time at zero erosion in this fitting exercise, 551
best-fitting values for muon interaction cross-sections should provide upper limits on 552
the true production rate due to muons. The best-fitting value for 0,21 is 0.0112 mil- 553
libarns (mb). Fernandez-Mosquera et al. (2008) estimated this cross-section to be 0.79 554
mb for 190 GeV muon energy, based on analogue reactions whose cross-sections at 555
190 GeV were experimentally measured by Heisinger et al. (2002b). In our muon cal- 556
culations, as discussed above, we assume that the energy dependence exponent ↵ for 557
this cross-section (see Heisinger et al., 2002b; Borchers et al., 2016) is 1, in which 558
case the value of 0,21 implied by the estimate of Fernandez-Mosquera et al. (2008) 559
is 0.79/(1901) = 0.0042 mb. This is consistent with the upper limit represented by 560
our best-fitting value. On the other hand, our best-fitting value for the negative muon 561
capture cross-section f⇤
21is zero, implying that21Ne is not produced by negative muon 562
capture. This agrees with the assessment of Kober et al. (2011), who proposed that no 563
suitable negative muon capture reaction on Si exists. However, Fernandez-Mosquera 564
et al. (2008) proposed several possible reactions. Our measurements are most consis- 565
tent with the argument that21Ne production by this pathway is negligible. 566
4.2. Steady-erosion end member 567
We now attempt to fit the data under the opposite end member assumption that the 568
site has experienced slow erosion for a much longer period of time than implied by 569
the apparent surface exposure age. Independent geologic evidence indicates that the 570
last significant topographic development in the Dry Valleys preceded 14.5 Ma (Sugden 571
104 105 106 107 108 109 21Ne (atoms g-1) 0 1000 2000 3000 4000 5000 6000 Mass depth (g cm -2) Entire core 2 4 6 21Ne (108 atoms g-1) 0 100 200 300 400 500 Mass depth (g cm -2) Spallation region 0 10 20 30 40 50 Mass depth (g cm -2) Core top -4 -2 0 2 4 Normalized residual
Figure 6: Fit of zero-erosion model to21Ne concentrations in the core. The left panels show data with the
best-fitting model; the right panels show normalized residuals. The data are the same in all panels, but the y-axes are di↵erent so as to adequately show details in all parts of the core. Gray circles (in lower panel only)
show nucleogenic21Ne concentrations predicted by best-fitting model parameters for each sample, and black
symbols (with same symbology as in Figure 2) show corresponding cosmogenic21Ne concentrations (thus,
these are di↵erent from the data plotted in Figure 2, which are total excess21Ne concentrations). The solid
line shows cosmogenic21Ne concentrations predicted by the best-fitting parameters, and the dashed lines in
14.5 Ma. In addition, we simplify the optimization problem by also assuming ⇤sp = 573
140 g cm 2. This leaves ✏, ⇤
a, fa, tC, 0,21, and f21⇤ as unknown parameters. Again, 574
here we impose only the constraint that all parameters must be positive. 575
104 105 106 107 108 109 21Ne (atoms g-1) 0 1000 2000 3000 4000 5000 6000 Mass depth (g cm -2) Entire core 2 4 6 21Ne (108 atoms g-1) 0 100 200 300 400 500 Mass depth (g cm -2) Spallation region 0 10 20 30 40 50 Mass depth (g cm -2) Core top -4 -2 0 2 4 Normalized residual
Figure 7: Fit of 14.5 Ma steady-erosion model to21Ne concentrations in the core. Figure elements are the
same as in Figure 6.
Figure 7 shows the result of fitting this model to the data. The minimum value 576
of the fitting parameter M is the same, and the overall fit to the data is similar, as is 577
evident by comparison of Figures 6 and 7. The best-fitting erosion rate over 14.5 Ma 578
is 3.3 ⇥ 10 5 g cm 2 yr 1, or 0.14 m Myr 1 for the mean rock density in the core of 579
2.31 g cm 3. The best-fitting value for t
C is again 156 Ma; as we expect from the fact 580
that U and Th concentrations are not correlated with depth in the core, this value is not 581
sensitive to assumptions about the exposure history. 582
Assuming steady erosion for a long period of time makes it difficult to fit the near- 583
surface spallogenic21Ne profile; this scenario requires ⇤
a=36 g cm 2and fa=0.15, 584
et al., 2013), and even with these much larger values the fit to the data is poor near the 586
surface (Fig 7). Heuristically, this is not surprising, because erosion acts to replace the 587
nuclide inventory produced at the surface with that produced in the subsurface region 588
that is not a↵ected by albedo e↵ects. Thus, in the presence of erosion, a more extreme 589
reduction in the production rate at the surface is needed to yield an observable e↵ect in 590
the near-surface concentrations. The difficulty of fitting the near-surface profile with a 591
steady-erosion model would tend to suggest that the true exposure history of the site is 592
transient and involves relatively rapid removal of meter-scale layers of rock, with near- 593
zero erosion between stripping events. This is potentially consistent with the stratified 594
nature of the bedrock: erosion at this site could occur primarily by lateral backwearing 595
of successive strata rather than steady surface degradation. 596
Again, the best-fitting value for f⇤
21 is zero, implying no production of 21Ne by 597
negative muon capture. The best fitting value of the fast muon interaction cross-section 598
0,21 for this scenario is 0.0033 mb. Given the assumption that the total exposure 599
history of the site can span no more than 14.5 Ma, this should provide a minimum 600
constraint on the muon production rate, so again this is consistent with the estimate 601
from analogue reactions by Fernandez-Mosquera et al. (2008). 602
4.3. Uncertainty analysis 603
The fact that models with very di↵erent exposure histories can be equivalently fit to 604
the data indicates that an attempt to estimate a formal uncertainty in any of our param- 605
eter estimates for a particular one of these models would not be meaningful. However, 606
one important conclusion of the discussion above is that our measurements imply that 607
production of21Ne by negative muon capture is zero or at least negligible. Thus, in this 608
section we explore further whether nonzero negative muon capture production would 609
be consistent with the observations, or if it is entirely precluded. In addition, we inves- 610
tigate the uncertainty in the estimate of Ne closure age. To do this, we use a simplified 611
model in which we assume values for the muon production parameters f⇤
21 and 0,21, 612
and simplify Equation 7 as: 613
N21,sp(z) = N21,sp(0)e z
⇤sp (11)
The e↵ect of this is that the spallogenic 21Ne inventory is parameterized simply 614
by a surface nuclide concentration N21,sp(0) instead of the exposure age and erosion 615
rate, which accommodates transient exposure histories by permitting spallogenic and 616
muon-produced inventories to reflect di↵erent e↵ective erosion rates. In other words, 617
it permits the muon-produced inventory to have accumulated over a longer time than 618
the spallogenic inventory, which would take place, for example, in the scenario of un- 619
steady erosion by backwearing of successive strata suggested above. We also disregard 620
measurements in the upper 20 g cm 2 of the core so that it is not necessary to fit the 621
near-surface deviation from a single exponential profile. We then assume ⇤sp=140 g 622
cm 2and a total exposure time of 14.5 Ma as above. This leaves only the neon closure 623
age tC, the erosion rate ✏, and the spallogenic surface nuclide concentration N21,sp(0) 624
as fitting parameters. Finally, we constrain all parameters to be greater than zero, and 625
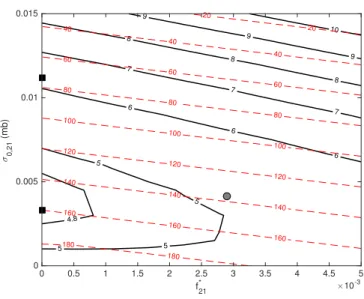
4.8 5 5 5 5 6 6 6 7 7 7 8 8 8 9 9 9 10 20 20 40 40 40 60 60 60 80 80 80 100 100 100 120 120 120 140 140 140 160 160 160 180 180 0 0.5 1 1.5 2 2.5 3 3.5 4 4.5 5 f* 21 ×10 -3 0 0.005 0.01 0.015 σ0,21 (mb)
Figure 8: The solid black lines are contours of best attainable value of the reduced chi-squared misfit statistic
2/⌫(e.g., M as defined above divided by the number of degrees of freedom) for a range of specified values
of f⇤
21and 0,21, using the simplified 14.5 Ma steady erosion model and the constraints described in the text.
Note that values of the fit statistic shown here are not comparable to those discussed for the complete models in the previous section, because near-surface data have been excluded and the fitting parameters are di↵erent.
In addition, they are calculated assuming zero uncertainty in predicted nucleogenic21Ne concentrations
(see text). Thus, they should not be taken to imply a realistic probability-of-fit. The gray circle shows the values for muon interaction cross-sections proposed by Fernandez-Mosquera et al. (2008), and the black squares show best-fitting values for the simple-exposure and steady-erosion models described in the previous
sections, which represent maximum and minimum constraints on f⇤
21, respectively. The dashed red lines are
contours of the neon closure age (in Ma) in the best-fitting model for each ( f⇤
which is slightly higher than the maximum erosion rate permitted by the surface21Ne 627
concentration. 628
Figure 8 shows the results of this fitting exercise for a range of values of f⇤
21 and 629
0,21. Although zero negative muon capture production results in the best fit, the ob- 630
servations can be fit nearly as well with some negative muon capture, as long as total 631
muon production remains relatively low. This is because nearly all the observed ex- 632
cess21Ne in deep samples is nucleogenic rather than muon-produced, which results 633
in poor resolution on muon production rates overall. Another important point high- 634
lighted in Figure 8 is that prescribing higher values of f⇤
21and 0,21in this calculation, 635
without permitting higher erosion rates than allowed by the surface21Ne concentra- 636
tion, apportions more of the excess21Ne concentration in the deep part of the core to 637
cosmogenic rather than nucleogenic production, which decreases the best-fitting neon 638
closure age. The approximate correspondence between the closure temperature of Ne 639
in quartz (Shuster and Farley, 2005) and that of the apatite fission-track system implies 640
that the true neon closure age of these samples must be greater than AFT ages of ⇠150 641
Ma at lower elevations nearby in the Dry Valleys (Gleadow and Fitzgerald, 1987, P. 642
Fitzgerald, written communication), and in addition it must presumably be lower than 643
the 183 Ma emplacement age of the Ferrar dolerite, sills of which intrude the Beacon 644
Fm. close to the core site (Burgess et al., 2015). This criterion also favors lower val- 645
ues for muon production rates, although, again, it does not completely preclude some 646
contribution from negative muon capture production. As discussed above, best-fitting 647
models have a neon closure age near 160 Ma, but the data can be fit nearly as well with 648
values between ⇠130-180 Ma. This is e↵ectively indistinguishable from closure ages 649
between 133-351 Ma obtained from the Mackay Glacier erratics discussed above. 650
5. Discussion and conclusions 651
In this section we highlight potentially useful conclusions of this study related to 652
(i) nucleogenic21Ne systematics in Beacon Group sandstone, and (ii) production of 653
cosmogenic21Ne in quartz by muon interactions. 654
5.1. Nucleogenic21Ne and the (U-Th)/Ne age of Beacon Group sandstone in the Dry 655
Valleys area 656
Quartz in Beacon Group sandstones contains significant concentrations of nucle- 657
ogenic21Ne. The mean and standard deviation of nucleogenic21Ne concentrations in 658
etched core samples implied by the best-fitting neon closure age of ⇠156 Ma is 5.2 659
± 3.4 Matoms g 1, which is e↵ectively the same as 7.1 ± 2.0 Matoms g 1 in etched 660
quartz measured in Mackay Glacier erratics. For un-etched core samples, it is 11.1 ± 661
3.6 Matoms g 1. Middleton et al. (2012) also estimated nucleogenic21Ne concentra- 662
tions in a set of Beacon Group sandstones from a di↵erent location in the Dry Valleys 663
by inferring nucleogenic21Ne from measurements of fissiogenic129Xe concentrations 664
and the assumption of simultaneous Ne and Xe closure. Their samples were HF-etched, 665
but not as extensively as ours (a single 24-hour period at room temperature), and they 666
inferred an average nucleogenic21Ne concentration of 7.7 ± 2.4 Matoms g 1, which is 667