HAL Id: hal-02123032
https://hal.archives-ouvertes.fr/hal-02123032
Submitted on 28 Aug 2020
HAL is a multi-disciplinary open access
archive for the deposit and dissemination of
sci-entific research documents, whether they are
pub-lished or not. The documents may come from
teaching and research institutions in France or
abroad, or from public or private research centers.
L’archive ouverte pluridisciplinaire HAL, est
destinée au dépôt et à la diffusion de documents
scientifiques de niveau recherche, publiés ou non,
émanant des établissements d’enseignement et de
recherche français ou étrangers, des laboratoires
publics ou privés.
Distributed under a Creative Commons Attribution - NonCommercial - NoDerivatives| 4.0
International License
glasses by secondary ionization mass spectrometry
Evelyn Füri, Etienne Deloule, Célia Dalou
To cite this version:
Evelyn Füri, Etienne Deloule, Célia Dalou. Nitrogen abundance and isotope analysis of silicate glasses
by secondary ionization mass spectrometry.
Chemical Geology, Elsevier, 2018, 493, pp.327-337.
Contents lists available atScienceDirect
Chemical Geology
journal homepage:www.elsevier.com/locate/chemgeo
Nitrogen abundance and isotope analysis of silicate glasses by secondary
ionization mass spectrometry
Evelyn Füri
a,⁎, Etienne Deloule
a, Célia Dalou
a,baCentre de Recherches Pétrographiques et Géochimiques, UMR 7358, CNRS-UL, 15 rue Notre Dame des Pauvres, BP20, 54501 Vandoeuvre-lès-Nancy Cedex, France bUniversity of Minnesota, Department of Earth Sciences, 108 Pillsbury Hall, Minneapolis, MN 55455, USA
A R T I C L E I N F O
Editor: K. Mezger Keywords: Nitrogen SIMS
Reference material synthesis Basaltic glass
Chondrules Semarkona
A B S T R A C T
Chondritic meteorites preserve extreme intra-sample15N/14N variations, which exceed, in some cases, the range
of nitrogen isotope ratios observed at the Solar System scale. These observations are based on in situ analyses of CN−molecular ions by secondary ionization mass spectrometry (SIMS) in carbon-rich phases. The distribution of nitrogen and its isotopes in silicate minerals and glasses has not been investigated to this date due to the lack of an appropriate analytical protocol, as well as of suitable N-bearing standards. In order to improve our knowledge of the nitrogen signature of both extraterrestrial and terrestrial silicate samples, we have developed a protocol for determining precise and accurate nitrogen abundances (and isotope ratios) in basaltic glasses using high mass resolution SIMS. Twelve (C-)N-bearing synthetic basaltic glasses, containing between < 1 and 18,443 ± 966 ppm N, form the suite of reference materials for this study. By targeting the CN−, NO−, AlN−, and SiN−secondary molecular ions, nitrogen abundances can be detected down to the ppm level in both carbon-bearing and carbon-free glasses. The analytical precision and reproducibility of isotope ratios in the form of
15N16O−/14N16O−is on the order of 11‰ and 10 to 17‰ (2σ), respectively, for reference glasses containing
≥100 ppm N. Thus, nitrogen isotope ratios can be determined with an uncertainty that is small enough to resolve nitrogen isotope variations in extraterrestrial silicates. The study of four chondrules of the ordinary chondrite Semarkona (LL3.0) reveals that the nitrogen distribution in the mesostasis is highly heterogeneous, with concentrations ranging from 0 to 1099 ± 168 ppm. Theδ15N values in mesostasis, olivine, and pyroxene
vary between−36 ± 50‰ and +55 ± 72‰, indicating that silicate phases in chondrules do not host par-ticularly15N-poor nitrogen.
1. Introduction
Nitrogen isotopes provide a powerful tool for tracing the origin of volatile elements on planetary bodies because the relative proportion of
14N and 15N shows outstanding variability among different Solar
System objects and reservoirs (Füri and Marty, 2015). Although tur-bulent mixing regionally homogenized the material available for planet formation– resulting in similar nitrogen isotope compositions for Earth and the Moon, the interior of Mars, and most chondrite groups (δ15N≈ 0 ± 50‰; e.g.,Füri et al., 2015a;Kerridge, 1985;Kung and
Clayton, 1978;Mathew and Marti, 2001;Pearson et al., 2006)–, mi-cron-sized zones with extreme nitrogen isotopic anomalies remain preserved in some chondritic meteorites. So-called15N-hotspots have
been detected in the insoluble organic matter of carbonaceous chon-drites (δ15N = 3200 ± 700‰;
Busemann et al., 2006) and in lithic clasts of the Isheyevo meteorite (δ15N = 4200 ± 1500‰ to
4900 ± 300‰;Bonal et al., 2010; Briani et al., 2009). In contrast,
osbornite (TiN) within a calcium‑aluminum-rich inclusion of Isheyevo records an exceptionally15N-poor, solar-like nitrogen isotope signature (δ15
N =−364 ± 12‰;Meibom et al., 2007). Bulk chondrules, milli-meter-sized silicate spheres in chondrites, also display a significant range of15N/14N ratios (δ15N≈ −100 to +170‰; Das and Murty,
2009;Fredriksson et al., 1985;Kung and Clayton, 1978;Mahajan and Murty, 2003;Murty and Marti, 1985) which lead previous authors to suggest that chondrule precursors carried various nitrogen components with distinct isotopic compositions, and that this heterogeneity was preserved during the high-temperature chondrule forming process(es). Silicates are inferred to be the carriers of isotopically light nitrogen in chondrules, whereas organics and metals or metal sulfides are thought to represent the 15N-enriched endmember (Fredriksson et al., 1985;
Murty and Marti, 1985). However, previous data were obtained through bulk analyses, and the nitrogen isotopic signature of distinct chondrule phases (mesostasis, silicate minerals, melt inclusions, metals, sulfides) has not been investigated to this date. Since chondrules have
https://doi.org/10.1016/j.chemgeo.2018.06.008
Received 9 January 2018; Received in revised form 9 June 2018; Accepted 12 June 2018
⁎Corresponding author.
E-mail address:[email protected](E. Füri).
Chemical Geology 493 (2018) 327–337
Available online 21 June 2018
0009-2541/ © 2018 The Authors. Published by Elsevier B.V. This is an open access article under the CC BY-NC-ND license (http://creativecommons.org/licenses/BY-NC-ND/4.0/).
recently been shown to contain relict olivine grains inherited from chondrule precursors (Marrocchi et al., 2018), and to preserve sig-nificant hydrogen and oxygen isotopic heterogeneities (Deloule and Robert, 1995;Marrocchi et al., 2016, 2018), in situ analyses are crucial for better understanding the origin and distribution of nitrogen in chondrules.
Nitrogen abundances and isotope ratios of geologic samples have historically been analyzed using isotope ratio mass spectrometers op-erated in dynamic pumping mode or noble gas mass spectrometers operated under static vacuum conditions (e.g.,Frick and Pepin, 1981;
Hashizume and Marty, 2004;Javoy and Pineau, 1991;Thiemens and Clayton, 1983). Although the latter technique requires only a small amount of material (≤5 mg; e.g.,Füri et al., 2015a), these bulk ana-lytical methods are destructive and do not provide any information on the spatial distribution of nitrogen within the sample. Nuclear reaction (Mosbah et al., 1993; Varela et al., 2003) and electron microprobe analyses (EPMA;Kadik et al., 2011;Li et al., 2015;Roskosz et al., 2013;
von der Handt and Dalou, 2016) allow for in situ measurements of nitrogen abundances in silicate glasses with detection limits on the order of 10 and 100 s–1000 s ppm, respectively. Since nitrogen nuclear microanalysis is based on the14N(d,p)15N reaction, and EPMA cannot distinguish between isotopes of the same element, isotope ratio mea-surements are not feasible by these techniques.
Secondary ionization mass spectrometry (SIMS) analysis represents a quasi non-destructive method for determining chemical and isotopic variations with a high lateral resolution (at a scale as small as≤10 μm) or a high depth resolution (≤10 nm). The measurement of nitrogen by SIMS is challenging because it does not form a stable elemental negative ion. However, an intense CN−signal forms in the presence of carbon, when the sample surface is bombarded with a Cs+ion beam (Zinner
et al., 1989). Thus, nitrogen isotope ratios have successfully been de-termined in the form of 12C15N−/12C14N−in a range of carbon-rich
materials such as pollen (e.g.,Lhuissier et al., 2000), organic matter (e.g.,Aléon et al., 2003;Busemann et al., 2006;Thomen et al., 2014), graphite (e.g., Mostefaoui et al., 2005), diamond (e.g., Hauri et al., 2002), SiC (Marty et al., 2011;Zinner et al., 1989), osbornite (Meibom et al., 2007), and iron meteorites (e.g., Sugiura, 1998). As an alter-native, for carbon-free samples such as silicate minerals and glasses, the NO−signal can be targeted for nitrogen abundance measurements, as demonstrated byLi et al. (2013)andRegier et al. (2016). The lack of an appropriate analytical protocol, as well as of suitable N-bearing stan-dards, has so far prevented the use of SIMS for nitrogen isotope analyses of silicates.
Here we present a novel protocol for in situ nitrogen abundance and isotope analyses in basaltic silicate glasses. The CAMECA IMS 1280 HR2 at the Centre de Recherches Pétrographiques et Géochimiques (CRPG, Nancy) can achieve a high mass resolution, i.e., MRP = m/Δm up to 18,000 in this study, allowing significant isobaric interferences from neighboring masses on the CN−, NO−, AlN−, and SiN−signals to be resolved. By targeting these secondary molecular ions, nitrogen abundances can be detected down to the ppm level in both carbon-bearing and carbon-free silicate samples. Furthermore, isotope ratios in the form of 15NO−/14NO− can be determined with an uncertainty of < 20‰ for reference glasses containing ≥100 ppm nitrogen. Hence, this technique is key for the study of nitrogen trapped within micron-sized silicate phases such as chondrule components (e.g., mesostasis). 2. Reference materials used for nitrogen analyses by SIMS 2.1. N-bearing basaltic glasses synthesized at atmospheric pressure
To investigate the nitrogen solubility in tholeiitic melt, Humbert (1998)experimentally produced basaltic glass samples with a range of nitrogen concentrations (< 1 to≥5000 ppm). Nitrogen equilibration experiments were carried out for 36 to 48 h at a temperature of 1400 to 1425 °C and at atmospheric pressure in a GERO HTVR 70–250 vertical
drop-quench furnace over a range of 18 log units of oxygen fugacity in a C-N-O vapor system (see Libourel et al. (2003) for details). Subse-quently, the nitrogen content and isotopic composition of the quenched run products was determined by CO2 laser extraction static mass
spectrometry (Humbert et al., 2000). The solubility of nitrogen in ba-saltic melt was found to be highly sensitive to the oxygen fugacity, with a drastic increase of the nitrogen concentration by several orders of magnitude under reducing conditions (i.e., between logfO2–10.7 and
−18).Libourel et al. (2003)proposed that this solubility increase can be related to changes in the mechanism of nitrogen dissolution in sili-cate melt: under oxidizing conditions, nitrogen dissolves physically as a N2molecule, whereas under reducing conditions, nitrogen is chemically
bounded to the silicate melt network as N3− species. Thus, basaltic glasses covering a wide range of nitrogen contents were obtained by simply varying the redox conditions of the equilibration experiments. Eight nitrogen-bearing glasses synthesized byHumbert (1998)are used in this study as reference materials for nitrogen abundance and isotope analyses by SIMS (Table 1). These glasses cover a concentration range between < 1 and 3906 ± 188 ppm N, and their δ15N value (where
δ15N is the permil deviation from the atmospheric15N/14N ratio of
0.003676) has been shown to be close to−4 ± 1‰ (Humbert, 1998), which corresponds to the isotopic composition of the N2gas used for
the experiments.
2.2. C-N-bearing basaltic glasses synthesized at high pressure
Six C-N-rich glasses were synthesized from N-MORB-like (Presnall and Hoover, 1984) starting material, obtained by mixing pre-dried, spectroscopically pure oxides and carbonates. The starting composition was prepared Fe-free to prevent iron nitride crystallization. The mixture was decarbonated by heating, ground in ethanol in an agate mortar, and nitrogen was added by using between 0.3 and 5 wt% Si3N4, which
has a strong reducing effect. Although in the absence of Fe, the fO2
could not be measured, it is expected that the samples are reduced within the same range as those ofDalou et al. (2016), i.e.,−13 < log fO2<−8.5.
Nitrogen equilibration experiments were carried out for six hours in a ½-inch piston cylinder at 1.2 ± 0.1 GPa and 1400 °C at the University of Minnesota. From outside to inside, assemblies consisted of a CaF2 sleeve surrounding a graphite furnace, and MgO cell parts,
which were dried beforehand at 1000 °C for 4 h and stored in a drying oven at 110 °C. The starting material was loaded into a graphite capsule to prevent nitrogen diffusion into metal capsules, to ensure reducing conditions (thus promoting the nitrogen dissolution into the melt phase; e.g.,Kadik et al., 2015;Libourel et al., 2003), and to provide a source of carbon. The graphite capsule was placed into an MgO sleeve and iso-lated from the thermocouple by a 1 mm MgO ring. The temperature was measured with a type B (Pt70Rh30/Pt94Rh6) thermocouple to
within ± 2 °C of the set point (Zhang and Hirschmann, 2016). Experi-ments were temperature-quenched rapidly before decompression (at a rate of ~175 °C/s) by turning off the power to the furnace. The re-covered capsules were cut lengthwise using a wire saw, and one half of each experimental charge was roughly ground into sub-millimetric fragments.
The clearest glass fragments (free of visible graphite, as observed under the microscope) are used as SIMS calibrants for this study, and a few chips of each sample were targeted for nitrogen concentration and isotope ratio analyses by CO2laser extraction static mass spectrometry
(Appendix A). Total nitrogen abundances of the six glasses vary be-tween 383 ± 33 and 18,443 ± 966 ppm, withδ15N values of−9.9 to −0.7‰ ( ± 2.5‰) (Table 1andAppendix A), and represent both N2
and N-H species (Dalou et al., 2017). Complementary SIMS analyses revealed that the CO2-equivalent carbon content of the glasses is highly
variable and heterogeneous, likely due to the presence of micron-sized graphite inclusions (Table 1andAppendix B). Furthermore, the glasses contain between 0.8 and 2.4 wt% H2O, which is assumed to have been
introduced into the samples as a result of air contamination of the starting material and/or the high-pressure assembly parts.
2.3. N-bearing SiC
A fragment of silicon carbide (SiC) containing terrestrial nitrogen was used in a previous study as a calibrant for SIMS analysis of solar wind nitrogen implanted into the SiC quadrant of the Solar Wind Concentrator on board NASA's Genesis spacecraft (Marty et al., 2011). The concentration of nitrogen in this material is ~10 ppm, and its
15N/14N ratio was found to be 3.722 × 10⁻³± 1.29 × 10⁻⁵
(δ15N = 12.5 ± 3.5‰) by laser ablation static mass spectrometry
analysis (Marty et al., 2011). Given the high purity of the SiC fragment, it is ideal for identifying the peaks of interest when measuring nitrogen in the form of CN−or SiN−. However, the peculiar composition of this material rules out its use as a calibrant for nitrogen concentration and isotope ratio analyses of silicates, as standards must be close in com-position to the samples in order to minimize matrix effects.
3. Analytical protocol for nitrogen analyses by SIMS
The CAMECA 1280 HR2 ion microprobe at the CRPG was used for in situ nitrogen abundance and isotope analyses. Polished fragments of the different glasses and the SiC calibrant were mounted in high-purity indium and coated with gold. Prior to each analytical session, the sample mounts were left in the airlock of the instruments for at least 48 h in order to ensure thorough removal of any terrestrial adsorbed water before introduction into the sample chamber. In addition, a liquid nitrogen cold trap allowed maintaining a pressure of≤5 × 10⁻⁹Torr during analyses. This is critical for minimizing hydride species forma-tion.
Spot analyses of negatively charged molecular nitrogen ions at different mass stations were carried out using a 10 keV Cs+primary ion
beam with a current of ~10 nA and a normal-incidence electron gun for charge compensation. Spot sizes were on the order of 20μm in dia-meter. The samples were pre-sputtered for 180 s with a beam rastering of 10 ×10μm prior to signal acquisition in order to minimize surface contamination. For abundance and isotope ratio analyses, the beam was
rastered by 5 × 5μm, and a dynamical transfer operating system was used to compensate the primary rastering by recentering the beam in the secondary optic of the ion probe. Before starting the data acquisi-tion, the secondary ion beam was automatically centered in x and y on thefield aperture and the contrast aperture, followed by a mass cen-tering routine in order to compensate for any magneticfield drift.
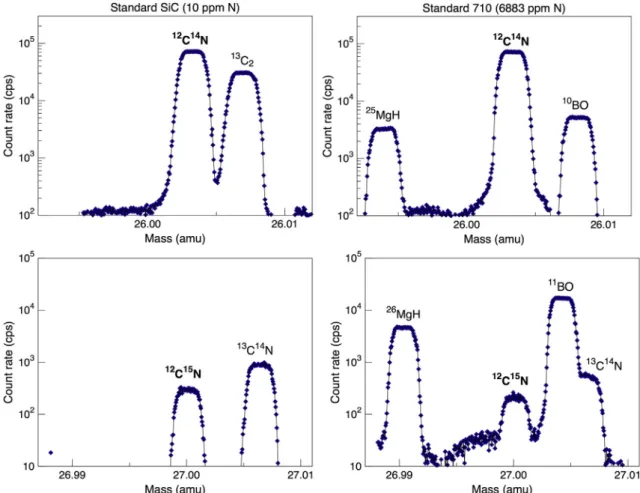
3.1. Nitrogen analysis in the form of CN−at masses 26 and 27
For the C-N-rich glasses and the SiC calibrant, the12C14N− and 12C15N− ion signals were acquired on an electron multiplier with a
mass resolution of 11,000 at 10% of the peak height. High-resolution mass spectra obtained for the SiC calibrant allow clearly identifying the peaks of interest because signals from neighboring masses such as
25,26MgH and10,11BO are absent.Fig. 1shows that 12C14N−is
com-pletely separated from13C2−and10BO−, as is12C15N−from11BO−
and 13C14N−. For nitrogen abundance measurements, the 12C14N−
molecular ion was analyzed with a count time of 6 s for 30 cycles (Supplementary Table S1). The12C−(4 s) and30Si−(4 s) count rates were acquired on a Faraday cup in peak-jumping mono-collection mode during each cycle in order to monitor the carbon distribution in the samples and the stability of secondary ion intensities, respectively. The secondary ion intensity ratio12C14N−/30Si−shows an excellent
corre-lation (R2= 0.99) with the known nitrogen contents, even though the
count rates for12C−in glasses 701, 703, and 711 were found to vary significantly with depth over the course of a 30-cycle analysis (Fig. 2), as well as between different spots. The variation of the12C−signal is
likely due to the presence of nano- or micrometer-sized graphite in-clusions, clustered in some parts of the glasses, as observed by scanning electron microscope imaging. Notably, these inclusions have a limited effect on the intensity of the12C14N−signal, as illustrated, for example,
by measurement cycles #3 to #8 of the N-richest glass 711 (Fig. 2b). This indicates that the graphitic inclusions do not contain a significant amount of nitrogen.
With this instrument configuration, an average12
C14N−ion yield of 1.3 cps/ppmN/nA is obtained for the silicate glasses. This would be sufficient for precise nitrogen abundance analyses of the synthetic glasses that contain hundreds to thousands of ppm nitrogen; however,
Table 1
Nitrogena, water, and carbon contentb, as well as major element compositionc, of the reference materials used for SIMS analyses.
Calibrant ID N (ppm) H2O (wt%) CO2(ppm) SiO2(wt%) Al2O3(wt%) MgO (wt%) CaO (wt%) Na2O (wt%) TiO2(wt%)
Glasses synthesized at atmospheric pressure
CM-1#13 0.022 ± 0.034 b.d. b.d. 56.5(4) 17.0(2) 9.0(2) 12.7(3) 2.7(1) 1.9(1) CM-1#10 1.4 ± 0.5 b.d. b.d. 56.9(4) 17.5(2) 9.4(2) 13.4(2) 1.8(1) 0.9(2) CM-1#3H 1.7 ± 0.3 b.d. b.d. 46.3(3) 22.4(2) 12.7(2) 18.6(3) 0.1(1) b.d. CM-1#9 136 ± 7 b.d. b.d. 57.0(4) 17.7(2) 9.3(1) 13.5(2) 0.3(1) 1.9(1) CB-2#3A 162 ± 8 b.d. b.d. 44.0(2) 18.0(2) 11.0(2) 25.8(3) b.d 1.5(1) CM-1#4A 1334 ± 118 b.d. b.d. 58.3(3) 16.5(2) 8.9(2) 13.8(3) b.d. 1.5(1) CM-1#1H 1511 ± 149 b.d. b.d. 56.7(4) 18.3(2) 9.5(1) 13.9(3) 0.1(1) 1.8(1) CB-2#1 3906 ± 188 b.d. 122 42.9(4) 19.5(2) 10.2(2) 27.7(3) b.d. 0.2(1) Glasses synthesized at high pressure
704 383 ± 33 1.9 241 51.8(3) 17.2(3) 10.8(1) 13.5(2) 2.2(1) 0.9(1) 703 714 ± 64 1.4 ≥105 52.2(3) 17.7(1) 10.8(2) 13.7(1) 2.3(1) 1.0(1) 702 2228 ± 286 0.8 391 54.0(4) 17.3(2) 10.7(2) 13.4(1) 2.3(1) 1.0(1) 701 3284 ± 233 0.8 ≥438 53.7(3) 17.6(2) 10.8(1) 13.5(2) 2.3(1) 1.0(1) 710 6883 ± 419 0.8 565 54.9(4) 16.4(3) 11.1(6) 13.7(4) 2.1(1) 0.9(1) 711 18,443 ± 966 0.9 ≥916 58.2(4) 16.2(3) 10.1(2) 12.6(2) 2.1(1) 0.5(5) Other calibrants SiC ~10 ppm
a The nitrogen content of the glasses was determined by CO
2laser extraction static mass spectrometry at the CRPG noble gas facility (Humbert, 1998;Humbert
et al., 2000;Appendix A).
b The H
2O and CO2content of the glasses was determined using the CAMECA 1280 HR2 ion microprobe at the CRPG (seeAppendix Bfor details). b.d.: below
detection limit.
c
The major element composition of the glasses was determined using the Cameca SX-100 electron microprobe at the Université de Lorraine (Service Commun de Microscopies Electroniques et de Microanalyses X). Uncertainties (1σSD) given in parentheses refer to the last digit.
repeat analyses of each calibrant yield12C14N−/30Si−ratios that are
reproducible only within 4 to 7% (1σSD). This is consistent with the variations observed during the nitrogen concentration measurements by CO2laser extraction static mass spectrometry (Table 1andAppendix
A), and possibly reflects a significant degree of heterogeneity in the
nitrogen content of the experimental run products. Given the important C-N heterogeneities in the glasses, precise isotope ratios could not be obtained. In contrast, repeat12C14N−(6 s) and12C15N−(12 s) analyses (n = 13) of the SiC calibrant yield an average12C15N−/12C14N−ratio
of 3.634 × 10⁻³± 1.13 × 10⁻⁵ (δ15N =−11.3 ± 3.1‰, 2σ),
indicating that the analytical precision of SIMS and static mass spec-trometry analysis is comparable for this sample. The instrumental mass fractionation (Δinst=−23.8 ± 6.6‰) observed here for SiC is
con-sistent with that reported by Marty et al. (2011), i.e., Δinst=−29.7 ± 8.3‰ and − 25.6 ± 11.6‰.
Overall, the results obtained here demonstrate that natural C-N-bearing silicate samples can be targeted for nitrogen analyses in the form of CN−by SIMS.Regier et al. (2016)pointed out that the12C14N− ion yield likely depends on the limiting element, i.e., a low carbon concentration may limit the efficiency of C-N recombination reactions.
Fig. 1. High-resolution mass spectra at mass stations 26 and 27 for the silicon carbide (SiC) calibrant (left) and the 710 glass (right). Data were acquired with a mass resolution (m/Δm) of ~11,000.
Fig. 2. a) Relationship between the secondary ion intensity ratio12C14N−/30Si−and the known nitrogen content of the six C-N-rich glasses (open symbols: individual
analyses;filled symbols: average for each calibrant). The data were regressed using IsoplotR (Vermeesch, 2018). b) Evolution of the secondary ion intensities12C−, 12C14N−, and30Si−during a 30-cycle measurement of the N-richest glass 711.
They therefore emphasized that the carbon content of unknowns should be comparable of that of the standards used for calibration. However, the12C14N−ion yield shows little variation among the glasses analyzed
here, and the12C14N−/30Si−ratio shows a linear relationship with the
known nitrogen abundance, despite the highly variable carbon content. Thus, the carbon heterogeneities do not appear to significantly affect the efficiency of C-N recombination reactions that occur at or near the sample surface during sputtering. Only the SiC calibrant (containing ~10 ppm nitrogen) stands out in that its12C14N−ion yield is > 1000
cps/ppmN/nA (Fig. 1) which can likely be attributed to a significant matrix effect given the peculiar composition of this material. 3.2. Nitrogen analysis in the form of NO−at masses 30 and 31
With the exception of the SiC fragment, all glasses listed inTable 1
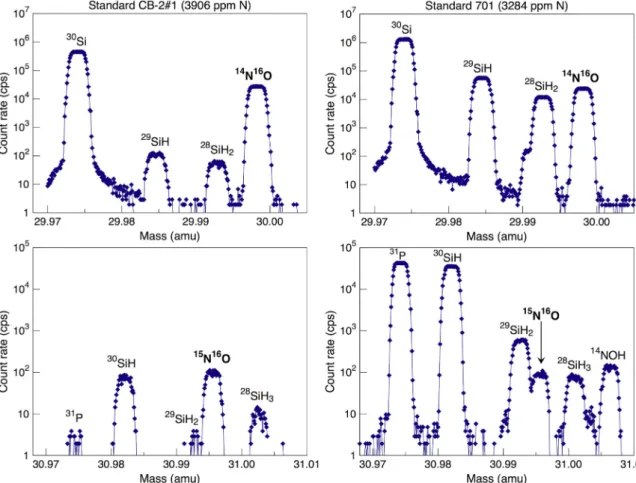
can be used as reference materials for nitrogen analyses in the form of NO−. For this approach, a mass resolution of 5550 would be sufficient to determine nitrogen abundances (i.e., to resolve the14N16O−peak
from the neighboring28SiH
2−peak). However, isotope ratio
measure-ments require a mass resolution of≥10,725 in order to separate the
15N16O−peak from29SiH
2−. This is of particular importance for
water-rich samples, such as the glasses synthesized at high pressure (Table 1); as shown in Fig. 3, the peak intensities of the silicon hydrides are several orders of magnitude higher for glass 701, with a water content of 0.8%, than for glass CB-2#1, with a water content below detection limit.
In order to establish the relationship between the 14N16O− ion count rate and the known nitrogen concentration of the glasses, the
14N16O−ion intensity was measured by ion counting on an electron
multiplier, together with the 30Si−and16O2−signals measured on a
Faraday cup, in peak jumping mode (m/Δm = 11,000 at 10% of the peak height). Twenty-five cycles were collected for each analysis
through the mass sequence 27Al− (4 s), 30Si− (4 s), 14N16O− (6 s),
15
N16O−(20s),16O2−(4 s) (Supplementary Table S2). The30Si−signal
increased significantly, i.e., by a factor of three to four, during all analyses, indicating that the30Si−emissivity is enhanced by Cs+
im-plantation and build-up (Thomen et al., 2014, and references therein). In contrast, the16O
2−count rates remained constant, implying that the
O-O recombination reaction rates are not affected by surface im-plantation of Cs+. It is also noteworthy that the ratio between the secondary molecular ions N-O and O-O is close to the atomic N/O ratio of the glasses analyzed here (Fig. 4a). This implies that their overall yields– after sputtering, extraction, and recombination – are compar-able, yet likely depend on the sample matrix (e.g., degree of poly-merization) and the nitrogen speciation. Therefore, the best correlation with the known nitrogen content is obtained when the14N16O−count rate is normalized by the16O2−signal (Fig. 4b). For these analytical
conditions, the reproducibility of the secondary ion intensity ratio
14N16O−/16O
2− was ≤4% (2σSD) for the glasses containing
≥162 ppm N. This uncertainty is comparable to, yet slightly smaller than, that of nitrogen concentration measurements by CO2laser
ex-traction static mass spectrometry (Appendix A).
The14N16O− signal obtained for the nitrogen-poorest glass CM-1#13 (0.022 ± 0.034 ppm N) was only 2.9 ± 0.9 cps, indicating the nitrogen background– and any tailing from neighboring hydride spe-cies – is negligible for this analytical configuration. The average
14N16O−ion yield, observed for the twelve glasses with nitrogen
con-centrations ≤3906 ppm, is 2.1 cps/ppmN/nA. The two glasses that contain the largest amount of water (i.e., 1.9 wt% H2O in 704 and
1.4 wt% H2O in 703;Table 1) show significantly higher14N16O−ion
yields of 3.0 cps/ppmN/nA, and, as a result, they plot above the cali-bration line shown inFig. 4b.Regier et al. (2016)observed the opposite effect; higher water contents resulted in lower NO−
signals for basaltic glasses. However, the variable ion yields observed here may also be
related to the speciation of nitrogen, i.e., the water-rich glasses syn-thesized at high pressure likely contain a higher proportion of N-H species compared to N2than the “dry” glasses synthesized at
atmo-spheric pressure (Dalou et al., 2017). Although the nitrogen speciation may affect the efficiency of ionization and N-O recombination reac-tions, individual analyses define a linear array with relatively low scatter (R2= 0.99, mean square weighted deviation (MSWD) = 1.7).
For isotope ratio measurements, the 14N16O−and 15N16O−ion
in-tensities were initially measured for 6 and 25 s, respectively, for 60 cycles (Supplementary Table S3).Fig. 5illustrates that for14N16O−count rates of ~4000 cps, the analytical precision of the15N/14N isotope ratio is on the
order of 5.6‰. Thus, the standard error of the mean (1σ) of each mea-surement is comparable to that predicted from Poisson statistics, and is controlled by the total number of counts of the less abundant15N16O−ion.
The external reproducibility is judged from repeat analyses of the glass CB-2#3A (containing 162 ± 8 ppm N), which has aδ15N value of−4 ± 1‰ (Humbert, 1998). For 10 measurements, average15N16O−/14N16O−ratios
of 3.737 ± 0.039 × 10⁻³ (δ15N = 16.7 ± 10.5‰, 2σSD) and
3.749 ± 0.063 × 10⁻³ (δ15N = 20.0 ± 17.1‰, 2σSD) are obtained (Supplementary Table S2) for 60 and 25 measurement cycles, respectively. These observations demonstrate that 15N/14N isotope ratios can be
de-termined in the form of NO−by SIMS with an analytical precision and reproducibility that is sufficient to resolve inter- and intra-sample nitrogen isotope variations in extraterrestrial materials, provided they record a wide range of δ15N values, i.e., between solar-like signatures
(δ15
N =−383 ± 8‰; Marty et al., 2011) and 15N-hotspots (4200 ± 1500‰ to 4900 ± 300‰; Bonal et al., 2010; Briani et al., 2009).
3.3. Nitrogen analysis in the form of AlN−and SiN−at masses 41 to 45
By closing the entrance (18μm) and exit slits (53 μm), the mass resolution was increased to 18,000 while still maintaining good trans-mission andflat-topped peaks. This setting allows the AlN−and SiN−
molecular ions to be targeted for nitrogen measurements through the mass sequence27Al14N−(6 s),28Si14N−(6 s),27Al16O−(3 s),28Si16O− (3 s),30Si14N−(6 s), and30Si15N−(20s) for 20 cycles (Supplementary
Table S4). However, resolving all possible interferences from the peaks of interest is challenging or, in some cases, impossible.
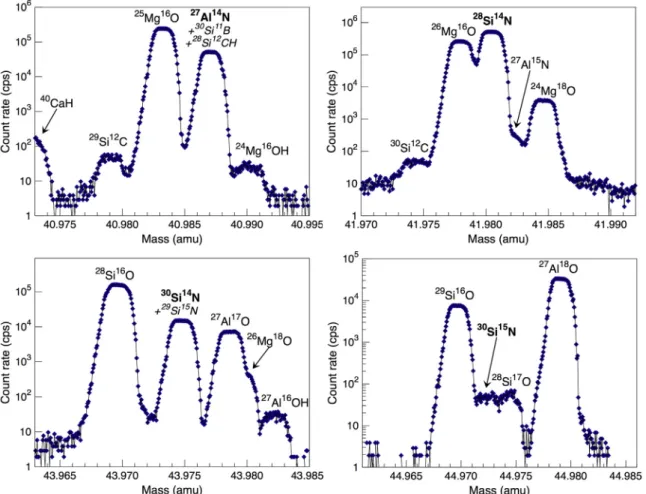
The high-resolution mass spectrum at mass 41 (Fig. 6), obtained with a MRP of 18,000, shows that nitrogen concentrations can be de-termined in the form of27Al14N−, with an ion yield that is comparable to that of 12C14N− or 14N16O− for the glasses analyzed here (i.e.,
~1.5 cps/ppmN/nA). A good second order polynomial correlation (R2= 0.98) is observed between the secondary ion intensity ratio
27Al14N−/27Al16O− and the known nitrogen content of the glasses,
normalized by the Al2O3 content (Fig. 7a). The non-linearity is
con-trolled by the nitrogen-richest glasses 710 and 711, and may possibly be related to the nitrogen speciation. It should be noted that with a MRP of 18,000, interferences from 30Si11B and 28Si12CH with the 27Al14N−
peak cannot be resolved; contributions from these masses are expected to significantly affect the27
Al14N−signal for N-poor glasses. Thus, the nitrogen-poorest calibrant CM-1#13 (0.022 ± 0.034 ppm N) yields an apparent 27Al14N− signal of ~700 cps (Supplementary Table S4). A
mass resolution of 24,400 would be needed to separate30Si11B from
27Al14N−, whereas 28Si12CH cannot be resolved from the 27Al14N−
peak. Furthermore, isotope ratio analyses (27Al15N−/27Al14N−) would
Fig. 4. Relationship between the secondary ion intensity ratio14N16O−/16O
2−and a) the atomic N/O ratio, and b) the known nitrogen content of the glasses. Data
are shown for the twelve glasses with nitrogen concentrations≤3906 ppm (open symbols: individual analyses (n = 80); filled symbols: average for each calibrant). The data were regressed using IsoplotR (Vermeesch, 2018).
Fig. 5. Measured15N16O−/14N16O−ratios for glass
CB-2#3A (containing 162 ± 8 ppm N) determined with a mass resolution of 11,000 (red circles), 12,000 (blue diamonds), and 14,000 (green squares). The true15N/14N ratio is ~0.003661. The variable 14N16O−count rates of 1300 to 4090 cps indicated at
the bottom were obtained by changing the width of the entrance and exit slits, as well as the width of the field aperture, and the primary ion beam current (Supplementary Table S3). Error bars represent the analytical precision (1σ) of individual analyses. (For interpretation of the references to colour in this figure legend, the reader is referred to the web ver-sion of this article.)
require a MRP of 25,440 in order to completely separate the27Al15N−
peak from28Si14N−.
Secondary SiN−ions can be targeted for nitrogen abundance ana-lyses at masses 42 (28Si14N−), 43 (29Si14N−; not shown), and 44
(30Si14N−). Although the27Al15N- peak is not completely separated
from 28Si14N− at the given mass resolution, its contribution to the measured signal is negligible. Importantly, the yield of28Si14N−is on the order of 15 cps/ppmN/nA for all (C-)N-bearing synthetic basaltic glasses analyzed here. This yield is significantly greater than that of all other species targeted in this study, indicating that 28Si14N− is the
secondary molecular ion of choice for determining nitrogen con-centrations in silicate glasses. An excellent correlation (R2= 0.99) is
obtained between the secondary ion intensity ratio28Si14N−/28Si16O− and the known nitrogen concentrations, normalized by the SiO2content
(Fig. 7b). In this case, the non-linearity of the calibration curve is controlled by all samples with nitrogen contents≥3906 ppm. Isotope ratio measurements are not feasible by this approach because the
28Si15N−peak cannot be separated from27Al16O−(not shown; a mass
resolution of > 72,800 would be required), and the 29Si15N− peak
virtually coincides with that of30Si14N−.
Fig. 6. High-resolution mass spectra at mass stations 41, 42, 44, and 45 for glass CB-2#1 (containing 3906 ± 188 ppm N) obtained with a mass resolution (m/Δm) of 18,000.
Fig. 7. Relationship between the secondary ion intensity ratios a)27Al14N−/27Al16O−and b)28Si14N−/28Si16O−and the known nitrogen content of the basaltic
glasses, normalized by the Al2O3and SiO2content, respectively. Calibration curves are shown as solid lines in the form of second order polynomial regressions (open
4. Nitrogen analysis of Semarkona chondrules
Individual bulk chondrules of ordinary chondrites record a wide range of nitrogen concentrations (0.8 to 61 ppm) and isotope
compositions (δ15
N≈ −100 to +170‰), which have been attributed to chondrule precursors with distinct nitrogen signatures (Das and Murty, 2009;Fredriksson et al., 1985;Mahajan and Murty, 2003;Murty and Marti, 1985). In order to investigate, for thefirst time, the intra-chondrule nitrogen distribution using SIMS, we targeted four chon-drules of Semarkona (LL3.0)– the most primitive, least metamorphosed of all known ordinary chondrites (Alexander et al., 2012). The selected chondrules show distinct textures: cryptocrystalline (CC;Fig. 8a), por-phyritic pyroxene (PP;Fig. 8b), and porphyritic olivine (PO;Fig. 8c,d). The analytical approach used for the chondrules was nearly iden-tical to the one described inSection 3.2, i.e., nitrogen was analyzed in the form of NO−, together with 30Si− and 16O
2− in peak-jumping
mono-collection mode. In addition, the27Al-signal was monitored in
order to distinguish the chondrule mesostasis from olivine and pyr-oxene. A mass resolution of 14,000 was chosen to improve the se-paration of the15N16O−peak from29SiH
2−. In this case, the analytical
precision (1σ) of individual 15N16O−/14N16O− ratio analyses of the
glass CB-2#3A (containing 162 ± 8 ppm N) is on the order of 12‰ (Fig. 5). The nitrogen content of the chondrule phases was derived from the relationship between the secondary ion intensity ratio
14
N16O−/16O2−and the known nitrogen content of the reference
ma-terials shown inFig. 4b. This calibration is not really appropriate for determining the nitrogen content of silicate minerals because possible matrix effects are not accounted for; in contrast, it can be used for the mesostasis in Semarkona chondrules which has a major element com-position similar to that of the reference glasses (SiO2= 45.3 to 63.7 wt
% and Al2O3= 14.6 to 26.8 wt%;Grossman et al., 2002).
Nitrogen concentrations and isotopic compositions of the selected Semarkona chondrules are given inTable 2. Theδ15N values are
re-ported for measurement spots with > 30 ppm nitrogen. Measured27Al count rates (normalized to the primary beam intensity of ~10 nA) are also reported inTable 2, together with the average values of the glasses CM-1#4A (16.50 wt% Al2O3) and CM-1#3H (22.38 wt% Al2O3) for
comparison. Based on the calibrant analyses, the PO chondrule
Fig. 8. Backscattered electron images of a cryptocrystalline (a), porphyritic pyroxene (b), and two porphyritic olivine (c, d) chondrules of the ordinary chondrite Semarkona. SIMS spots are labeled with the measured nitrogen concentrations.15N/14N ratios for spot analyses with N > 30 ppm are reported inTable 2.
Table 2
Nitrogen content and isotopic composition, as well as measured27Al count rates
(normalized to the primary beam intensity, Ip), of olivine, pyroxene, and
me-sostasis in four Semarkona chondrules.
Sample ID N (ppm) δ15N (‰) 27Al/I p(cps/nA) CC-1 0 – 10,593 CC-2 0 – 10,334 CC-3 0 – 10,405 CC-4 0 – 10,153 PP-pyroxene 54 ± 11 −36 ± 50 471 PP-pyroxene 2 ± 2 – 364 PP-mesostasis 10 ± 3 – 46,381 PP-mesostasis 60 ± 9 −27 ± 44 26,382 PO-1-olivine 171 ± 26 21 ± 46 4717 PO-1-mesostasis 2 ± 2 – 249,345 PO-1-mesostasis 75 ± 23 −25 ± 98 256,883 PO-1-mesostasis 99 ± 16 −5 ± 46 231,436 PO-1-mesostasis 312 ± 27 0 ± 35 226,164 PO-1-mesostasis 80 ± 18 −12 ± 49 258,516 PO-1-mesostasis 0 – 252,227 1099 ± 168 3 ± 89 247,150 PO-1-mesostasis 1 ± 1 – 225,728 PO-1-mesostasis 35 ± 6 28 ± 63 245,171 PO-2-olivine 0 – 7615 12 ± 3 – 8089 PO-2-olivine 19 ± 5 – 5613 PO-2-mesostasis 36 ± 7 −29 ± 61 258,623 PO-2-mesostasis 37 ± 8 55 ± 72 266,287 PO-2-mesostasis 0 – 251,185 PO-2-mesostasis 22 ± 7 – 230,590 CM-1#4A 184,577 CM-1#3H 323,489
mesostasis is estimated to contain ~18 to 20 wt% Al2O3, consistent
with the range of Al2O3 values (i.e., 14.6 to 26.8 wt%) reported by
Grossman et al. (2002)for mesostasis in Semarkona chondrules. The results reveal that the cryptocrystalline chondrule does not contain any detectable nitrogen, whereas the porphyritic chondrules show a significant range of nitrogen concentrations between ≤10 to 312 ± 27 ppm (Fig. 8,Table 2). The highest abundances are detected in the mesostasis, but even some spot analyses of olivine and pyroxene yield a significant14N16O−signal, corresponding to several 10s of ppm
nitrogen. While Li et al. (2015) showed that terrestrial olivine and pyroxene can contain such amounts of nitrogen at upper mantle con-ditions due to ion substitutions or interstitial impurities, the presence of N-rich mineral or glass inclusions in chondrule silicate phases cannot be ruled out (Varela et al., 2003). Strikingly, during one analysis of the PO-1 chondrule mesostasis, the nitrogen content abruptly increased from 0 ppm near the surface to 1099 ± 168 ppm after 20 measurement cy-cles. Based on the composition of nebular gas, i.e., PH2= 10−3atm and
N2/H2≈ 1 × 10⁻⁴ (Anders and Grevesse, 1989), and the redox
con-ditions during the formation of Semarkona chondrules, i.e., logfO2= IW−4 to +1 (Villeneuve et al., 2015), < 1 ppm nebular
ni-trogen can be physically or chemically dissolved into a basaltic melt (i.e., the only conditions for which the N solubility as a function of fO2
has been determined; Libourel et al., 2003). The nitrogen concentra-tions observed in the Semarkona chondrule mesostasis are significantly higher than that, thus requiring increased nitrogen partial pressures compared to canonical conditions during chondrule formation – a scenario that has been invoked for other volatile elements trapped in chondrules (Marrocchi et al., 2016, and references therein)– or, al-ternatively, incorporation of nitrogen-rich precursors (Das and Murty, 2009). Although the nature of the nitrogen host phase cannot be identified here, the results demonstrate that the nitrogen distribution within olivine, pyroxene, and mesostasis in Semarkona chondrules is highly heterogeneous at the micron scale.
Theδ15N values vary between−36 ± 50 ‰ and + 55 ± 72‰. Although the uncertainties, reported at the 2σ level, are large compared to those obtained by static mass spectrometry analyses, the data fall within the range of values previously obtained for bulk chondrules of ordinary chondrites. It should be noted that all chondritic meteorite samples contain cosmogenic 15N produced in the lattice of silicates
during space exposure (Mathew and Murty, 1993); however, spallation reactions have a negligible effect on the nitrogen isotope signature for the concentrations observed here (see Füri et al., 2015b, for details), provided that the chondrules did not experience any significant pre-exposure to solar cosmic rays prior to accretion (Riebe et al., 2017, and references therein). Thus, the new data reveal that silicates (olivine, pyroxene, and mesostasis) are not the host phases of particularly15
N-poor nitrogen in Semarkona chondrules, and they carry a nitrogen component that is clearly distinct from solar (δ15N
solar=−383 ± 8‰;
Marty et al., 2011). These observations are consistent with the notion,
derived from the nitrogen analysis of a calcium‑aluminum-rich inclu-sion in the CV3 chondrite NWA 8616, that the inner regions of the protoplanetary disk were contaminated with15N-rich material early in
Solar System history (Füri et al., 2015b).
5. Conclusions and outlook
The lack of suitable N-bearing standards, as well as of a high-mass-resolution analytical protocol, has so far prevented the use of SIMS for nitrogen isotope analyses of silicate glasses. For this study, we have developed a suite of twelve (C-)N-rich synthetic basaltic glasses, con-taining between < 1 and 18,443 ± 966 ppm N, that can serve as re-ference materials for nitrogen analyses in the form of the CN−, NO−, AlN−, and SiN−(and MgN−). Given the high mass resolution that can be achieved with the CAMECA IMS 1280 HR2, significant isobaric in-terferences from neighboring masses on these secondary molecular ions can be resolved. The high ion yield of 28Si14N−makes it the ion of
choice for determining nitrogen concentrations; however, isotope ratios can only be determined in the form of 12C15N−/12C14N− and 15N16O−/14N16O−. Hence, the nitrogen signature of natural silicate
samples, which may contain a very low and/or variable amount of carbon, is best investigated by targeting NO−with a MRP of≥10,725. While the N-rich basaltic glass calibrants developed and character-ized in our laboratory allow the intensity of secondary molecular ni-trogen ions to be related to the nini-trogen concentration, possible matrix effects on the ion yields remain to be evaluated by studying silicate glasses of variable chemical compositions (e.g., rhyolitic glasses). In addition, the effect of the nitrogen speciation (N2vs. N-H species) on
the efficiency of ionization and recombination reactions will have to be investigated because, depending on the redox conditions, a range of nitrogen species may be present in natural silicate samples.
The analytical protocol developed here permits, for thefirst time, to study the concentration and isotopic composition of nitrogen trapped within micron-sized silicate phases such as chondrule mesostasis. It can also be applied for the analysis of melt inclusions in both terrestrial and extraterrestrial samples, and, thus, it may be key for improving our understanding of the nitrogen characteristics of the deep Earth and other planetary interiors.
Acknowledgements
We gratefully acknowledge L. Zimmermann, J. Villeneuve, and N. Boudin for assistance and support during the nitrogen analyses by static mass spectrometry and SIMS. We also thank L. Tissandier and L. Piani for fruitful discussions. Two anonymous reviewers are thanked for constructive comments, which helped improve the manuscript, as is Dr. Klaus Mezger for editorial handling. This work was supported by the European Research Council (grant no. 715028). This is CRPG-CNRS contribution 2592.
Appendix A. Nitrogen analysis by CO2laser extraction static mass spectrometry
Nitrogen abundances and isotope ratios of the glasses were determined by CO2laser extraction static mass spectrometry at the CRPG noble gas
analytical facility (seeHashizume and Marty, 2004andHumbert et al., 2000for details). For the N-bearing basaltic glasses synthesized at atmo-spheric pressure, results are reported inHumbert (1998). Data for the C-N-bearing basaltic glasses synthesized at high pressure are given inTable A1. For each experimental run product, 2 to 3 replicate analyses were carried out on fragments between 37 and 436μg in mass. Several samples were re-heated after melting to ensure that the total amount of nitrogen was extracted during thefirst heating step. Isotope ratios of nitrogen (15N/14N) are expressed in the delta (δ) notation, where δ15N = [(15N/14N)
sample/ (15N/14N)std− 1] × 1000, in ‰, and the standard is atmospheric nitrogen with 15N/14N = 0.003676. Given the high nitrogen content of the glasses, blank contributions (9.58 × 10⁻¹³mol N) were negligible (< 0.1%). The
Table A1
Nitrogen abundance and isotopic composition of the six C-N-bearing basaltic glasses synthesized at high pressure.
Sample Heating step Mass (μg) N (ppm)
704 1 176 407 ± 4 −3.1 ± 2.5 2 2 −0.3 ± 22.0 704 1 212 360 ± 4 −0.7 ± 2.5 703 1 95 776 ± 8 −5.4 ± 3.2 703 1 182 648 ± 7 −3.0 ± 2.5 2 3 23.2 ± 10.1 703 1 51 720 ± 8 −9.9 ± 2.5 702 1 98 2025 ± 22 −7.7 ± 2.6 702 1 436 2430 ± 26 −9.5 ± 2.5 701 1 256 3449 ± 37 −8.9 ± 2.5 701 1 37 3120 ± 33 −7.3 ± 3.0 710 1 158 6505 ± 69 −9.0 ± 2.5 2 32 −17.2 ± 7.8 710 1 145 7334 ± 78 −9.7 ± 2.5 710 1 292 6812 ± 73 −3.9 ± 3.0 2 40 −8.6 ± 2.6 711 1 65 18,782 ± 200 −6.3 ± 2.5 711 1 225 19,193 ± 205 −6.6 ± 2.5 711 1 245 17,353 ± 185 −8.6 ± 2.6 2 39 −10.0 ± 6.1
Appendix B. Water and carbon analysis by SIMS
The water and carbon content of the glasses was determined using the CAMECA 1280 HR2 ion microprobe at the CRPG. A ~6 nA primary ion beam of Cs+was focused on a ~20μm diameter area, and a normal-incidence electron gun was used for charge compensation. Negative secondary
ions12C,16O,17O,16O1H,27Al, and28Si were measured in peak jumping mode with a mass resolution of 8000. The12C signal was determined by ion counting on an EM, whereas all other ions were measured on a Faraday cup. A 20μm × 20 μm raster was used for 120 s prior to analysis to remove any surface contamination. Each analysis consisted of 10 cycles, with a counting time of 3 s on each peak.
A suite of seven in-house (basaltic) SIMS standards with known H2O and CO2concentrations was used for calibration, and concentrations of H2O
and CO2in the N-bearing basaltic glasses were calculated using best-fit regressions for16O1H/16O versus H2O and12C/16O versus CO2, respectively.
The water content of all basaltic glasses synthesized at atmospheric pressure is below the detection limit, and only sample CB-2#1 contains a detectable amount of carbon (122 ± 21 ppm CO2) (Table 1). In contrast, the water concentrations of the glasses synthesized at high pressure vary
between 0.8 and 2.4 wt% (Table 1). Samples 702 (391 ± 26 ppm CO2), 704 (241 ± 21 ppm CO2), and 710 (565 ± 45 ppm CO2) appear to contain
a relatively homogeneous concentration of carbon, although only three spots were analyzed on each grain. The other three samples (701, 703, 711) yielded extremely variable12C−signals at different spots on the same grain. For example, the CO2-equivalent carbon content varies between 916 and
15,400 ppm in sample 711, and between 105 and 31,500 ppm in sample 703. This heterogeneity is inferred to be due to the presence of small (≤3 μm) graphite inclusions, clustered in some parts of the glasses, as observed by scanning electron microscope imaging.
‘Water’ concentrations are reported as total H2O (Table 1). However, depending on the experimental conditions, the glasses likely contain various
hydrous species, including OH, H2, as well as N-H or C-H compounds (Armstrong et al., 2015;Dalou et al., 2016, 2017). Therefore, the reported
‘water’ abundances may represent contributions from all of these species as a result of dissociation of molecular ions and recombination reactions that occur at or near the sample surface during sputtering. Similarly,‘carbon’ abundances are reported as total CO2but may, in fact, represent a
range of C-H and/or C-O species (Armstrong et al., 2015).
Appendix C. Supplementary data
Supplementary data to this article can be found online athttps://doi.org/10.1016/j.chemgeo.2018.06.008.
References
Aléon, J., Robert, F., Chaussidon, M., Marty, B., 2003. Nitrogen isotopic composition of macromolecular organic matter in interplanetary dust particles. Geochim. Cosmochim. Acta 67, 3773–3783.http://dx.doi.org/10.1016/S0016-7037(00) 00170-4.
Alexander, C.M.O., Bowden, R., Fogel, M.L., Howard, K.T., Herd, C.D.K., Nittler, L.R., 2012. The provenances of asteroids, and their contributions to the volatile in-ventories of the terrestrial planets. Science 337, 721–723.http://dx.doi.org/10. 1126/science.1223474.
Anders, E., Grevesse, N., 1989. Abundances of the elements: meteoritic and solar. Geochim. Cosmochim. Acta 53, 197–214.
Armstrong, L.S., Hirschmann, M.M., Stanley, B.D., Falksen, E.G., Jacobsen, S.D., 2015. Speciation and solubility of reduced C-O-H-N volatiles in mafic melt: implications for
volcanism, atmospheric evolution, and deep volatile cycles in the terrestrial planets. Geochim. Cosmochim. Acta 171, 283–302.http://dx.doi.org/10.1016/j.gca.2015.07. 007.
Bonal, L., Huss, G.R., Krot, A.N., Nagashima, K., Ishii, H.A., Bradley, J.P., 2010. Highly
15N-enriched chondritic clasts in the CB/CH-like meteorite Isheyevo. Geochim.
Cosmochim. Acta 74, 6590–6609.http://dx.doi.org/10.1016/j.gca.2010.08.017. Briani, G., Gounelle, M., Marrocchi, Y., Mostefaoui, S., Leroux, H., Quirico, E., Meibom,
A., 2009. Pristine extraterrestrial material with unprecedented nitrogen isotopic variation. Proc. Natl. Acad. Sci. U. S. A. 106, 10522–10527.http://dx.doi.org/10. 1073/pnas.0901546106.
Busemann, H., Young, A.F., Alexander, C.M.O.'.D., Hoppe, P., Mukhopadhyay, S., Nittler, L.R., 2006. Interstellar chemistry recorded in organic matter from primitive me-teorites. Science 312, 727–730.http://dx.doi.org/10.1126/science.1123878. Dalou, C., Hirschmann, M.M., von der Handt, A., Mosenfelder, J., Armstrong, L.S., 2016.
depth. Earth Planet. Sci. Lett. 458, 141–151.http://dx.doi.org/10.1016/j.epsl.2016. 10.026.
Dalou, C., Le Losq, C., Hirschmann, M.M., Jacobsen, S., Füri, E., 2017. Evolution of C-O-H-N volatile species in the magma ocean during core formation. Eos. Trans. AGU Fall Meet. Abstr. V31E–01.
Das, J.P., Murty, S.V.S., 2009. Trapped nitrogen in individual chondrules: nature of chondrule precursors and clues to formation mechanisms. J. Geophys. Res. 114, 1–16.http://dx.doi.org/10.1029/2008JE003232.
Deloule, E., Robert, F., 1995. Interstellar water in meteorites? Geochim. Cosmochim. Acta 59, 4695–4706.http://dx.doi.org/10.1016/0016-7037(95)00313-4.
Fredriksson, K., Murty, S.V.S., Marti, K., 1985. Some chemical and isotopic observations in chondrules. Meteoritics 20, 347–357.
Frick, U., Pepin, R.O., 1981. Microanalysis of nitrogen isotope abundances: association of nitrogen with noble gas carriers in Allende. Earth Planet. Sci. Lett. 56, 64–81. Füri, E., Marty, B., 2015. Nitrogen isotope variations in the Solar System. Nat. Geosci. 8,
515–522.http://dx.doi.org/10.1038/ngeo2451.
Füri, E., Barry, P.H., Taylor, L.A., Marty, B., 2015a. Indigenous nitrogen in the Moon: constraints from coupled nitrogen–noble gas analyses of mare basalts. Earth Planet. Sci. Lett. 431, 195–205.http://dx.doi.org/10.1016/j.epsl.2015.09.022.
Füri, E., Chaussidon, M., Marty, B., 2015b. Evidence for an early nitrogen isotopic evo-lution in the solar nebula from volatile analyses of a CAI from the CV3 chondrite NWA 8616. Geochim. Cosmochim. Acta 153, 183–201.http://dx.doi.org/10.1016/j. gca.2015.01.004.
Grossman, J.N., Alexander, C.M.O., Wang, J., Brearley, A.J., 2002. Zoned chondrules in Semarkona: evidence for high- and low-temperature processing. Meteorit. Planet. Sci. 37, 49–73.
Hashizume, K., Marty, B., 2004. Nitrogen isotopic analyses at the sub-picomole level using an ultra-low blank laser extraction technique. In: de Groot, P.A. (Ed.), Handbook of Stable Isotope Analytical Techniques. Elsevier Science, pp. 361–375. Hauri, E.H., Wang, J., Pearson, D.G., Bulanova, G.P., 2002. Microanalysis ofδ13C,δ15N,
and N abundances in diamonds by secondary ion mass spectrometry. Chem. Geol. 185, 149–163.
Humbert, F., 1998. Solubilité de l'azote dans les silicates liquides. Université Henri Poincaré, Nancy.
Humbert, F., Libourel, G., France-Lanord, C., Zimmermann, L., Marty, B., 2000. CO2-laser
extraction-static mass spectrometry analysis of ultra-low concentrations of nitrogen in silicates. Geostand. Newslett. 24, 255–260.
Javoy, M., Pineau, F., 1991. The volatiles record of a“popping” rock from the Mid-Atlantic Ridge at 14°N: chemical and isotopic composition of gas trapped in the ve-sicles. Earth Planet. Sci. Lett. 107, 598–611.http://dx.doi.org/10.1016/0012-821X (91)90104-P.
Kadik, A.A., Kurovskaya, N.A., Ignat, Y.A., Kononkova, N.N., 2011. Influence of oxygen fugacity on the solubility of nitrogen, carbon, and hydrogen in FeO-Na2O-SiO2-Al2O3
melts in equilibrium with metallic iron at 1.5 GPa and 1400 °C. Geochem. Int. 49, 429–438.http://dx.doi.org/10.1134/S001670291105003X.
Kadik, A.A., Koltashev, V.V., Kryukova, E.B., VG, P., Tsekhonya, T.I., Kononkova, N.N., 2015. Solubility of nitrogen, carbon, and hydrogen in FeO-Na2O-Al2O3-SiO2melt and
liquid iron alloy: influence of oxygen fugacity. Geochem. Int. 53, 849–868.http://dx. doi.org/10.1134/S001670291510002X.
Kerridge, J.F., 1985. Carbon, hydrogen and nitrogen in carbonaceous chondrites: abun-dances and isotopic compositions in bulk samples. Geochim. Cosmochim. Acta 49, 1707–1714.
Kung, C.C., Clayton, R.N., 1978. Nitrogen abundances and isotopic compositions in stony meteorites. Earth Planet. Sci. Lett. 38, 421–435.
Lhuissier, F., Lefebvre, F., Gibouin, D., Demarty, M., Thellier, M., Ripoll, C., 2000. Secondary ion mass spectrometry imaging of thefixation of15N-labelled NO in pollen
grains. J. Microsc. 198, 108–115.
Li, Y., Wiedenbeck, M., Shcheka, S., Keppler, H., 2013. Nitrogen solubility in upper mantle minerals. Earth Planet. Sci. Lett. 377–378, 311–323.http://dx.doi.org/10. 1016/j.epsl.2013.07.013.
Li, Y., Huang, R., Wiedenbeck, M., Keppler, H., 2015. Nitrogen distribution between aqueousfluids and silicate melts. Earth Planet. Sci. Lett. 411, 218–228.http://dx.doi. org/10.1016/j.epsl.2014.11.050.
Libourel, G., Marty, B., Humbert, F., 2003. Nitrogen solubility in basaltic melt. Part I. Effect of oxygen fugacity. Geochim. Cosmochim. Acta 67, 4123–4135.http://dx.doi. org/10.1016/S0016-7037(03)00259-X.
Mahajan, R.R., Murty, S.V.S., 2003. Laser microprobe for the study of noble gases and nitrogen in single grains: a case study of individual chondrules from the Dhajala meteorite. Proc. Indian Natl. Sci. Acad. 112, 113–127.http://dx.doi.org/10.1007/ BF02710047.
Marrocchi, Y., Chaussidon, M., Piani, L., Libourel, G., 2016. Early scattering of the pro-toplanetary disk recorded in meteoritic chondrules. Sci. Adv. 2, e1601001.http://dx. doi.org/10.1126/sciadv.1601001.
Marrocchi, Y., Villeneuve, J., Batanova, V., Piani, L., Jacquet, E., 2018. Oxygen isotopic diversity of chondrule precursors and the nebular origin of chondrules. Earth Planet. Sci. Lett. 496, 132–141.http://dx.doi.org/10.1016/j/epsl.2018.05.042.
Marty, B., Chaussidon, M., Wiens, R.C., Jurewicz, A.J.G., Burnett, D.S., 2011. A15N-poor
isotopic composition for the solar system as shown by Genesis solar wind samples. Science 332, 1533–1536.http://dx.doi.org/10.1126/science.1204656.
Mathew, K.J., Marti, K., 2001. Early evolution of Martian volatiles: nitrogen and noble gas components in ALH84001 and Chassigny. J. Geophys. Res. 106, 1401–1422. Mathew, K.J., Murty, S.V.S., 1993. Cosmic ray produced nitrogen in extra terrestrial
matter. Proc. Indiana Acad. Sci. 102, 415–437.
Meibom, A., Krot, A.N., Robert, F., Mostefaoui, S., Russell, S.S., Petaev, M.I., Gounelle, M., 2007. Nitrogen and carbon isotopic composition of the Sun inferred from a high-temperature solar nebular condensate. Astrophys. J. 656, L33–L36.http://dx.doi. org/10.1086/512052.
Mosbah, M., Bastoul, A., Cuney, M., Pironon, J., 1993. Nuclear microprobe analysis of14N
and its application to the study of ammonium-bearing minerals. Nucl. Instrum. Methods Phys. Res., Sect. A B77, 450–456.
Mostefaoui, S., Zinner, E., Hoppe, P., Stadermann, F.J., El Goresy, A., 2005. In situ survey of graphite in unequilibrated chondrites: morphologies, C, N, O, and H isotopic ratios. Meteorit. Planet. Sci. 743, 721–743.
Murty, S.V.S., Marti, K., 1985. Nitrogen isotopic abundance of individual chondrules. Lunar Planet. Sci. XVI, 605–606.
Pearson, V.K., Sephton, M.A., Franchi, I.A., Gibson, J.M., Gilmour, I., 2006. Carbon and nitrogen in carbonaceous chondrites: elemental abundances and stable isotopic compositions. Meteorit. Planet. Sci. 41, 1899–1918.
Presnall, D.C., Hoover, J.D., 1984. Composition and depth of origin of primary mid-ocean ridge basalts. Contrib. Mineral. Petrol. 87, 170–178.
Regier, M.E., Hervig, R.L., Myers, M.L., Roggensack, K., Wilson, C.J.N., 2016. Analyzing nitrogen in natural and synthetic silicate glasses by secondary ion mass spectrometry. Chem. Aust. 447, 27–39.http://dx.doi.org/10.1016/j.chemgeo.2016.10.019. Riebe, M.E.I., Huber, L., Metzler, K., Busemann, H., Luginbuehl, S.M., Meier, M.M.M.,
Maden, C., Wieler, R., 2017. Geochim. Cosmochim. Acta 213, 618–634 doi:10/1016/ j/gca/2017.06.035.
Roskosz, M., Bouhifd, M.A., Jephcoat, A.P., Marty, B., Mysen, B.O., 2013. Nitrogen so-lubility in molten metal and silicate at high pressure and temperature. Geochim. Cosmochim. Acta 121, 15–28.http://dx.doi.org/10.1016/j.gca.2013.07.007. Sugiura, N., 1998. Ion probe measurements of carbon and nitrogen in iron meteorites.
Meteorit. Planet. Sci. 33, 393–409.
Thiemens, M.H., Clayton, R.N., 1983. Nitrogen contents and isotopic ratios of clasts from enstatite chondrite Abee. Earth Planet. Sci. Lett. 62, 165–168.
Thomen, A., Robert, F., Remusat, L., 2014. Determination of the nitrogen abundance in organic materials by NanoSIMS quantitative imaging. J. Anal. At. Spectrom. 29, 512–519.http://dx.doi.org/10.1039/c3ja50313e.
Varela, M.E., Bonnin-Mosbah, M., Kurat, G., Gallien, J.-P., 2003. Nitrogen microanalysis of glass inclusions in chondritic olivines by nuclear reaction. Geochim. Cosmochim. Acta 67, 1247–1257.http://dx.doi.org/10.1016/S0016-7037(00)01204-8. Vermeesch, P., 2018. IsoplotR: a free and open toolbox for geochronology. Geosci. Front.
http://dx.doi.org/10.1016/j.gsf.2018.04.001.(in press).
Villeneuve, J., Libourel, G., Soulié, C., 2015. Relationship between type I and type II chondrules: implications on chondrule formation processes. Geochim. Cosmochim. Acta 160, 277–305 doi:10/1016/j.gca.2015.03.033.
von der Handt, A., Dalou, C., 2016. Quantitative EPMA of nitrogen in silicate glasses. Microsc. Microanal. 22, 1810–1811.
Zhang, Z., Hirschmann, M.M., 2016. Experimental constraints on mantle sulfide melting up to 8 GPa. Am. Mineral. 101, 181–192.
Zinner, E., Ming, T., Anders, E., 1989. Interstellar SiC in the Murchison and Murray meteorites: isotopic composition of Ne, Xe, Si, C, and N. Geochim. Cosmochim. Acta 53, 3273–3290.