Alleviating Carmageddon with a research-driven Rapid Transit approach
By Ian Michael Ollis
MA
University of Witwatersrand Johannesburg 2001
Submitted to the Department of Urban Studies and Planning in partial fulfillment of the requirements for the degree of
Master in City Planning at the
MASSACHUSETTS INSTITUTE OF TECHNOLOGY May 2020
© 2020 Ian Ollis. All Rights Reserved
The author hereby grants to MIT the permission to reproduce and to distribute publicly paper and electronic copies of the thesis document in whole or in part in any medium now known or hereafter
created.
Author. ________________________________________________________________________ Department of Urban Studies and Planning
May 18 2020
Certified by ____________________________________________________________________ Lecturer James Aloisi. Department of Urban Studies and Planning Thesis Supervisor Accepted by. ___________________________________________________________________
Ceasar McDowell Professor of the Practice
Chair, MCP Committee
Alleviating Carmageddon with a research-driven Rapid Transit approach
By Ian Michael Ollis
Submitted to the Department of Urban Studies and Planning on 18 May, 2020, in partial fulfillment of the requirements for the degree of
Master in City Planning Abstract
A growing number of cities and metropolitan areas in the United States are experiencing historically high rates of congestion on roads and highways. Many of the same places have extensive, although not always well maintained or efficiently operated, transit and Commuter Rail systems. Ridership has plateaued or declined on many of these systems, highlighting their currently limited attractiveness as a modal choice.
Metropolitan Boston serves as a case study into what measures would be effective in inducing a meaningful level of mode shift from automobiles to rapid transit (rail) options. In 2019 four new reports identified Metro Boston as having some of the most congested roads in the nation. Motorists nevertheless continue to drive on these highly congested roads while a developed Commuter Rail, subway and bus transit system exist across the region.
This thesis uses a standardized online questionnaire distributed to motorists across Massachusetts and Rhode Island to understand individual attitudes toward mode shift, and specifically using Rapid Transit instead of driving for their regular daily commute. It targets motorists on the 10 most congested corridors in Massachusetts.
402 completed questionnaires were received from ZIP Codes across Massachusetts and Rhode Island revealing individuals’ attitudes and feelings towards shifting to transit for their commute. Specific demographic considerations, other than geographical spread and origin and destination data, were not considered in this study. The findings indicate that the high level of free or subsidized parking
provided across the study area draws Metro Boston commuters away from transit and that 63.7% of respondents would consider shifting to Rapid Transit if the cost of driving went up substantially (50% higher cost). Respondents further indicated that access & network limitations of the MBTA rail transit system, travel time by transit combination (including all legs of the trip), the transit system reliability, frequency of trains on a number of Commuter Rail routes and relatively high fare prices are considered factors preventing significant mode shift to transit.
Thesis Supervisor: James Aloisi
Acknowledgments
I wish to thank my thesis advisor, former Massachusetts Transportation Secretary, Jim Aloisi, for countless hours assisting me with clarifying my thoughts, keeping the survey on track and delivering a contribution to the realm of transportation research.
I wish too to thank Dr. Anson Stewart, the senior reader of this thesis for making countless useful comments, suggestions and improvements to the research and writing, particularly with software choice and usage.
I also wish to thank readers Professor Jinhua Zhao and the indomitable Fred Salvucci, former Massachusetts Transportation Secretary for giving input on readings, on the results and further areas for research.
My thanks to the Jen Greenleaf, Kai Smith and the Rotch and MIT Interlibrary Loan staff for their assistance in finding texts and journals.
Outside of the MIT family I wish to also acknowledge the help and assistance of the Central Transportation Planning Staff of the Boston Region Metropolitan Planning Organization for their assistance with data, advice and access to their reports.
Finally I wish to thank the friends, family and classmates who have supported me in this endeavor.
Contents
List of Figures ... 5
List of Tables ... 6
Terms and Definitions ... 7
1. Background ... 9
1.1 The Congestion Phenomenon and current state of play ... 9
1.2 Transit Ridership trends – National and Local ...10
1.3 Study Motivation and Research Questions ... 12
2. Literature Review ... 15
2.1 Accessibility & Network Convenience………... 17
2.2 Service level, Comfort & Safety………... 27
2.3 Pricing & Taxes... 29
2.4 Multifactoral Research……….………….……...….36
2.5 Literature Review Discussion and Conclusions... 39
3. Data and Survey Methodology ...41
3.1 Metro Boston Survey ...41
3.2 The Survey Instrument ...44
4. Survey Findings and Analysis ... 45
4.1 Survey Statistics ………... 45
4.2 Analysis ...46
5. GIS Mapping of Measures in the Study Area ...64
5.1 Mapping Methodology…….………...64
5.2 Mapping outcomes ...65
5.3 Final GIS Analysis ...81
6. Discussion ... 84
6.1 Key Findings ... 84
6.2 Discussion of Research Question ... 85
6.3 Policy Recommendations... 87
6.4 Areas for Further Research ... 89
References ... 91
Appendix 1: Survey questionnaire instrument...97
Appendix 2:Home ZIP Codes of Respondents (HomeZip)…... 100
Appendix 3: Work ZIP Codes of Respondents (WorkZip)…... 105
Appendix 4: Coding of long form responses………... 109
List of Figures
Figure 1. Map of Study area and Chosen Congested Roads...8
Figure 2. Ridership of the nine largest U.S. rail transit systems, minus New York...10
Figure 3. Boston MBTA Heavy Rail ridership versus Boston population... 11
Figure 4: Comparison of Average Typical Weekday MBTA Ridership, 2003 vs 2018 ... 11
Figure 5. Trimet Portland Oregon ridership numbers……….…...….…..31
Figure 6. Distribution of Road Uses Indicated by Respondents……….…..46
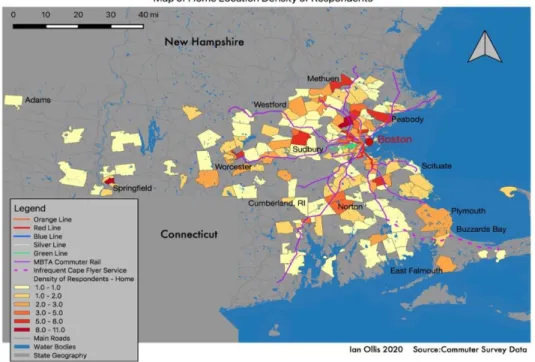
Figure 7. GIS Map of Home ZIP Codes by Density of Respondents……….………….…….47
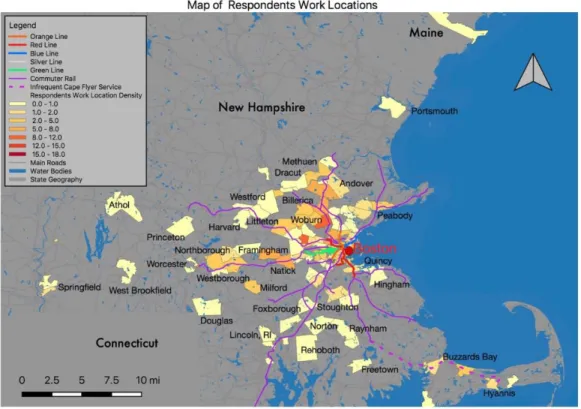
Figure 8. Geographical Spread of Work Locations……….….48
Figure 9. Spread of Times Respondents Left For Work……….………...…...48
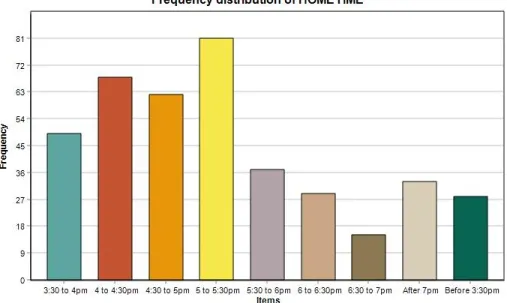
Figure 10. Spread of Times Respondents Left For Home ……….….….49
Figure 11. Incidence of Free or Subsidized Parking………...……….….49
Figure 12. Frequency of Taking The Train……….………...………….…..50
Figure 13. Frequency of Taking The Bus ……….……….…..50
Figure 14. Frequency of having more than one car per Household……….….51
Figure 15. Number of People in the Car During the Daily Commute………..52
Figure 16. Bar Chart of Responses to Question 12……….……..55
Figure 17. Pie Chart of Responses to Question 12………...56
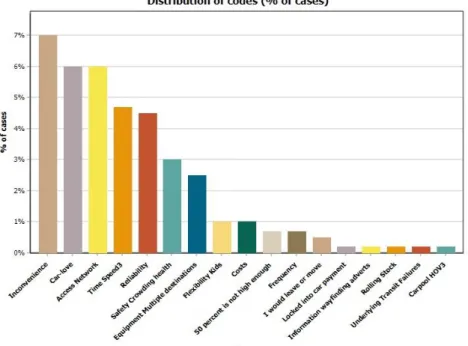
Figure 18. Bar Chart of Reasons Not to Shift to Rapid Transit……….…...59
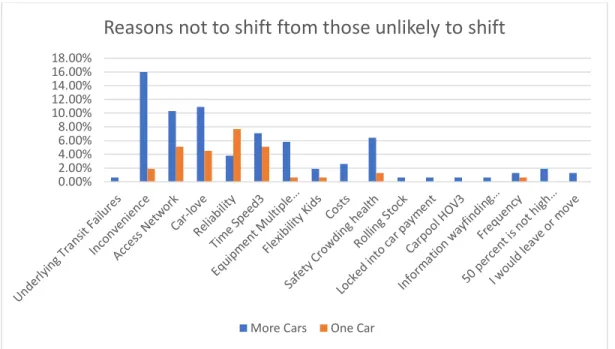
Figure 19. Bar Chart of Reasons Not to Shift to Rapid Transit versus Car Ownership...60
Figure 20. Health, Safety, Crowding, Cleanliness Mentions………...60
Figure 21. Density of Respondents Home ZIP Code Locations..……….…...66
Figure 22. Work Locations of Respondents……….66
Figure 23. Map of Free & Subsidized Parking……….……….…….…...67
Figure 24. Access and Network Concerns by Home ZIP Code………...…68
Figure 25. Map of Origin Access & Network Insufficiency Concerns………....69
Figure 26. Average Parking Concern Intensity Across the Network………...….…...70
Figure 27. Average Parking Concerns Among respondents………...…….71
Figure 28. Average Network Concerns by ZIP Code………..72
Figure 29. Accessibility Concerns by Work ZIP Code………....73
Figure 30. Work Location Density by ZIP Code……….73
Figure 31. Average Mentions of Fare Prices being too high Regionally.………...….74
Figure 32. Average Mentions of Fare Prices being too high………...….75
Figure 33. Density of Average Travel Time Concerns by ZIP Code……….….…….76
Figure 34. Metro Area Map of Travel Time Concerns by ZIP Code………...…...…77
Figure 35. Map of Reliability Concerns Across the MBTA Service Area & Beyond…...78
Figure 36. Map of Metro Area Neighborhoods Reliability Concerns……….…....79
Figure 37. Map of Frequency Concerns Across Both States………...…...80
List of Tables
Table 1. Summary of mode shift of riders on new transit routes.……….…..20
Table 2. Jones & Sloman table of cumulative advertising and informational impacts……...26
Table 3. Mode shift overview ……….…..40
Table 4. Traffic Counts on Congested highways sizes……….….…..42
Table 5. Bus and Train Ridership Habits……….……….….…..51
Table 6. Collated and Coded Responses to Question 10………....….53
Table 7. Heatmap of Ranked Choices of Question11.………....….…...54
Table 8. Heatmap of Ranked Choices of Question13………...…….….…56
Table 9. Household Car Availability……….………....……..57
Table 10. Likelihood of Mode Shift with Increased Driving Costs……….…………...……58
Table 11. Reasons for no Mode Shift with Increased Driving Costs………….……....…….58
Table 12. Reasons for no Mode shift with Increased Driving Costs vs Car Ownership....….59
Table 13. ZIP Codes of Respondents Noting Access and Network Insufficiencies…...…..61
Table 14. Summary of Prominent Factors in Questions 10, 11, 12, & 13……..………...63
Terms and Definitions Rapid Transit
Rapid Transit as used in this thesis means those transit and rail modes that do not travel in mixed traffic with cars and trucks. Thus, the term encompasses Commuter Rail, subway (heavy) rail, Light Rail and buses or trolleys in dedicated lanes. The term Rapid Transit, for our purposes, does not include conventional buses that travel in regular traffic lanes. As such the MBTA’s Silver Line has not been considered a Rapid Transit mode. Buses in regular traffic are used by vast numbers of people, but in the Metro Boston area, at an average bus speed of nine of ten miles per hour, according to Transportation Secretary Stephanie Pollack (Pollack 2019), this is not an improvement for most people over travelling in automobiles. A full set of dedicated lanes on major corridors would be needed to meaningfully reduce congestion over time. In simple terms Rapid Transit in Metropolitan Boston means rail.
SOV – Single Occupancy Vehicle BRT – Bus Rapid Transit
LRT – Light Rail Transit or Light Rail
Heavy Rail – High capacity metro lines including subways and commuter rail but excluding the Green
Line.
Commuter Rail – Also Heavy Rail, specifically regional rail linking suburbs to the city PT – Public Transportation
TOD – Transit Oriented Development
MBTA – Massachusetts Bay Transportation Authority MassDOT - Massachusetts Department of Transportation MAPC – Metropolitan Area Planning Council
BPDA – Boston Planning and Development Agency CTPS – Central Transportation Planning Staff
Ride Hailing – Procuring of vehicle trips via cell phone applications such as Uber or Lyft
Inner Core - The Inner Core Committee (ICC), consisting of 21 cities and towns within the Metropolitan
Boston area.
Road Pricing – The practice of instituting direct charges or levies for the use of the road such as tolls,
distance or time-based fees, congestion charges.
Personal Mobility Device (PMD)– typically are two-wheeler scooters either motorized or non-motorized
used for localized transportation.
MARC - Maryland Area Regional Commuter train service WMATA – Washington Metropolitan Area Transit Authority BART – Bay Area Rapid Transit
ROW – Right Of Way
The Study Area
The study area includes areas in Massachusetts and Rhode Island served by the MBTA. The MBTA service area is essentially the same as the MAPC definition of Metro Boston.
Chosen Congested Roads • I-93 North of central Boston • I-93 South of central Boston • Route 2 (Between I-95 and Alewife) • Route 28
• I-95 between Peabody and Route 2 (Lexington) • Route 9 (Between Boston and Worcester) • US Route 3 (Between Burlington & Chelmsford) • I-90 between Worcester and Boston
• Route 1A between Revere/Lynne and Boston (Including the Ted Williams Tunnel) • Route 1 between Revere and Boston
1. Background
1.1 The congestion phenomenon and current state of play
In 2019, three reports identified the most congested cities and the most congested highways in the United States. These reports demonstrated that congestion in many cities and regions is on the rise, and the Metropolitan Boston region is experiencing congestion conditions more severe than most. (TomTom Traffic Index, 2019) (Inrix, 2019) (Texas A&M, 2019). Further to these reports, the Massachusetts Department of Transportation (MassDOT) published its “Congestion in the Commonwealth – report to the Governor 2019” (MassDOT, 2019) in August 2019 acknowledging massive congestion problems in the Metro Boston area.
(MassDOT, 2019). In 2020 Inrix again released its report ranking Boston as having the worst congestion in the nation (Reed, T., 2020). Ride Hailing appears to have made this situation worse, especially closer to the Inner Core, by adding to vehicle miles travelled or numbers of vehicles on the road (Henao, 2017)(Tirachini & Gomez-Lobo, 2020)(Gehrke, 2018). These emerging trends make congestion a matter of much frustration, ripe for intervention.
Metro Boston’s traffic congestion imposes significant direct costs on drivers and both direct and indirect costs on all residents of the region as demonstrated recently in the
Transportation Dividend Report presented by A Better City (A Better City/ AECOM, 2018).
It acts as a constraint on access, with real impacts on private sector investment (Weisbrod, G., 2009), social equity and quality of life, e.g. hours lost in congestion (Reed, T., 2020). These costs are often hidden, but cannot be ignored.
Road pricing requires the provision of viable alternatives to be most effective in the long term. Without viable transit alternatives, road pricing may lead to a shift of the traffic to other roads, or be viewed by the public as simply a tax. A shift to other modes is required for long term sustainable congestion reduction, and for longer distances this means mode shift from automobiles to Rapid Transit.
Focusing primarily on the Metro Boston area, this thesis explores the ways Rapid Transit infrastructure, equipment and service delivery models can be used as a critical component of an overall strategy to alleviate congestion in the US context. The aim is to identify reasons why Rapid Transit is not used to a greater extent by commuters who opt currently to sit in traffic in highly congested corridors. Factors such as insufficient station parking, unreliable or slow rail service, inaccessible stations and fare policies are examined, together with pricing policies and the impact of free destination parking. The thesis develops a set of concrete proposals to encourage Rapid Transit use on significantly congested corridors in Metro Boston and aim to establish more generalized policy alternatives for use elsewhere.
1.2 Transit Ridership trends – National and Local
As traffic congestion grows, in many urban areas transit ridership, and in some cases quality of transit service, is static or declining. Cities and surrounding metropolitan areas are
growing in population. Metro Boston has seen both population and the built form of Boston and its metro municipalities grow steadily in recent decades as the growing local economy brings people in from other regions. Yet public transportation struggles to maintain modal share.
The Figures below show ridership trends for the nation’s largest systems and more specifically for the MBTA.
Graph: Ian Ollis, June 2019. Data from the Federal Transit Authority, 2019.
Figure 2. Ridership of the nine largest U.S. rail transit systems, minus New York 0 50,000,000 100,000,000 150,000,000 200,000,000 250,000,000 300,000,000 350,000,000
8 of the 9 Biggest US Rail Transit Systems
Boston HR Washington DC Chicago
LA San Fran Bart Philadelphia Septa
Population data: American Community Survey; Ridership from the National Transportation Database
Figure 3. Metropolitan Boston MBTA Heavy Rail ridership versus City of Boston population
Graph: (Ollis, I & Sullivan, G., 2019) Data Source: MBTA Blue Books/MBTA Tracker
Figure 4. Comparison of average typical weekday MBTA ridership, FY2003 vs FY2018 0 20,000 40,000 60,000 80,000 100,000 120,000 140,000 160,000 180,000 200,000 0 100,000 200,000 300,000 400,000 500,000 600,000 700,000 800,000 Total 2006 Total 2007 Total 2008 Total 2009 Total 2010 Total 2011 Total 2012 Total 2013 Total 2014 Total 2015 Total 2016 Total 2017 Total 2018 R id e rs h ip P o p u la ti o n
MBTA Heavy Rail Ridership versus Population
Growth
Total Population Annual Ridership in 1000's
31417
49148
16620
-54275
-21041 -15247
MBTA Ridership Changes 2003 to 2018
Red Line Orange Line Blue Line Green Line Commuter Rail Bus
1.3 Study Motivation and Research Questions The Research question:
What combination of interventions will most effectively induce mode shift away from single occupancy automobile travel to Rapid Transit at a scale that would meaningfully reduce congestion on major routes in Metropolitan Boston?
Objectives:
The motivation for this study comes primarily from the need to understand and respond to three phenomena in modern commuting:
• The current and prevailing attitude on the part of many drivers to continue to drive on increasingly congested highways and arterial roads
• The paradox that increasing lanes on existing highways does not solve the long-term congestion problem due to pull factors associated with the extra capacity
• The negative externalities that occur from increased auto driven commuting. These include poor or inefficient land use choices, rising vehicular emissions, and a variety of costs to the commuter arising from the ownership and operation of an automobile.
Mode shift is seen as one alternative solution to these ongoing concerns and indeed the alternative with which this study is primarily concerned.
What is meant by “combination of measures?
The goal of the study is to identify a basket of interventions that will cause meaningful modal shift from car-centric commuting on congested highways to Rapid Transit modes. This will be undertaken in the context of research and analysis that considers current extant research and an examination of the stated preferences of people who experience traffic congestion on a daily commuting basis.
This study does not attempt to isolate numeric comparisons between alternative baskets of mode shift tools in an attempt to find the largest additional premium obtained from the “sum of the parts”. That would be an interesting area for further study. This study specifically aims to establish the combination of measures that research and analysis show are a) individually effective at shifting people from regularly taking a car to regularly taking Rapid Transit, and b) have been demonstrated to produce mode shift in larger numbers. Cumulatively this resultant combination of measures will be a group of the most effective tools at achieving mode shift at a meaningful scale.
What scale would be meaningful?
The aim is to find a combination of measures that together could produce a degree of mode shift that would be large enough to alleviate some of the congestion on the most congested corridors in Metropolitan Boston. A meaningful or “significant” level of mode shift for the purposes of this study means a 10 to 15 % shift of drivers on the top congested corridors in the “rush hour”
from cars to Rapid Transit, a metric that follows from prior research studying congestion reduction measures that have proved efficacious. The study by Winnick et al. indicates that to significantly reduce congestion, and allow free flow traffic or maximum throughput of traffic in cities like the Washington DC Metro area would be in this range: “We established that in general a 10 to 14 percent decrease in traffic on congested freeways will reduce delay by approximately 75 to 80 percent” (Winick et al., 2008). The TCRP report “Cost Effectiveness of Travel Demand
Management Programs”, also found that “The average reduction in vehicle trips among ‘successful’ programs was 15.3%.” Quoted in (Luten, K. et al., 2004).
The question of the shifting nature of congestion itself will be addressed as necessary. It is perhaps important to note that we are measuring the cumulative mode shift effect and not the congestion reduction itself. Measuring changes in congestion itself is a separate exercise entirely. Methodology
The analysis contained in this thesis is informed by:
• A literature review that identifies which interventions work and to what extent they have been shown to work, and which do not
o What interventions have been shown to shift commuters to Rapid Transit o How these interventions were successfully implemented
o What data have been produced thus far to support such analysis.
• A survey of commuters who travel regularly on the corridors that are being studied. The survey will aim to solicit reasons current commuters do not take Commuter Rail, subway, Light Rail or dedicated bus lane offerings currently in the area (stated preference methods will be used)
• Statistical Analysis of survey responses • GIS mapping of survey responses
• Propose interventions: Applications in Metropolitan Boston
o The analysis and survey work must lead to proposed interventions in metropolitan Boston in the US which is experiencing highly congested road corridors.
The highly congested corridors:
The chosen roads in the study area (listed above) are considered the most congested corridors in Metro Boston for purposes of this study (chosen based on existing studies such as the TomTom 2019 Traffic Index, the Inrix 2018 Global Traffic Scorecard, the 2019 Texas A&M
Transportation Institute’s 2019 Urban Mobility Report and the 2019 MassDOT’s “Congestion in the Commonwealth – report to the Governor 2019”).
Data sourcing and evaluation:
Data for this study was sourced in three ways: 1. Data available through the literature review
2. Data sets from current authorities such as the MAPC and CTPS
The primary purpose of the literature review is to identify which factors have been associated with increased Rapid Transit ridership (as defined above) or mode shift away from automobiles and which factors have not had the desired impact.
The primary purpose of the survey will be to identify what factors motorists themselves identify as preventing them from making a mode shift to Rapid Transit and comparing these in the analysis with the factors identified in the literature review.
Coupled with this will be an analysis of the current and latent Rapid Transit infrastructure such as Commuter Rail lines, BRT bus systems, subway train systems, Light Rail lines and rail lines not currently utilized for passenger transportation.
Recommendations will be proposed based on the literature review, analysis of existing data, and survey of commuters to synthesize a combination of measures that is likely to most effectively induce a mode shift away from automobile travel at a scale that would meaningfully reduce congestion on the congested corridors identified.
Contribution and limitations of the study:
The study contributes to the field in a number of ways:
• The study links global research on the topic of mode shift with research designed to explore attitudes regarding congestion and transit conditions in Metro Boston.
• The stated preference survey data collected enriches the extant data specific to Metro Boston with qualitative questions around the “why” of taking a particular mode of transport and not another mode, rather than demographic and other characteristics of the traveler. The Central Transportation Planning Staff (CTPS) has gathered quantitative and demographic survey and operation data relating to Transit in Metropolitan Boston. • The survey covers a very specific cohort of motorists who travel on a specifically chosen
set of roads indicated in a number of recent studies as the most congested in
Massachusetts. The specific cohort was chosen as these are motorists driving in the most congested conditions and inevitably contributing to it.
• The study uses statistical analysis and GIS mapping of the results of a stated preference survey to identify localized variation in the data that contributes to our understanding of what interventions would be efficacious in specific geographical locations
Limitations of this study include:
• Unforeseen constraints and closures of computational facilities impeded planned
ridership and mode share modeling. In future research, this study’s initial efforts toward such modeling (e.g. the Use of TBEST software) could be brought to completion, creating an additional point of comparison with the survey results.”.
• By definition, the global nature of the Literature review (e.g. very different demographics such as density variations, and cultural differences such as dealing with crowding) makes comparisons less directly applicable to some degree. Nonetheless, lessons and patterns can be gleaned that are useful to the present study area.
2. Literature review
This chapter examines the relationship between mode shift from auto to Rapid Transit and the range of possible causal factors. Many researchers focus on ridership increases or decreases and not specifically on mode shift. However, ridership is no direct proxy for mode shift, unless an identifiable relationship between the two is established with an indicator of magnitude and direction.
Research into identifying and measuring mode shift follows three broad methodologies. The first uses econometric modelling to predict mode shift and transit ridership, based on an equation of variables, and tests theoretical assumptions about factors associated with mode shift.
The second method is the use of surveys, either stated preference or revealed preference surveys or both. This method typically asks transit riders, motorists, or census takers, what their travel preferences or attitudes are. Shifts in travel patterns are then inferred from the results of such surveys.
The third method estimates mode shift based on statistical data before and after the
implementation of new infrastructure or technology, such as a new transit line, or a new smart parking system. This method is based on traffic counts, ridership counts, parking use and so on. Occasionally surveys are combined with either or both of the other two methods to obtain additional data. This chapter considers literature demonstrating each of these methods to understand factors that induce mode shift.
General principles
Congestion is a dynamic phenomenon with constantly shifting parameters. It is usually represented by the significant reduction of throughput of vehicles on a road as the demand (vehicles) exceeds the capacity of the roadway.
People need to travel for a whole range of activities, and also want to travel. Travelling to work and school is major contributor to congestion (along with freight deliveries) as these activities usually begin and end each day in a given region around the same time, leading to the rapid increase in vehicles on roads and freeways during what we commonly refer to as “rush hour”. Across countries in different regions of the world, people travel roughly the same amount of time each week (Schafer, A., 2000) although distance and cost will vary, which may indicate that travel demand per capita will remain in place, no matter what measures are implemented to contain it. This phenomenon needs further study, but if this pattern holds, this means that we can only redistribute human travel but not meaningfully reduce it. This has significant implications for how we deal with congestion from a policy perspective. It may mean that policy makers and transportation planners can shift the time of travel, the mode of travel, the destinations of travel or the speed of travel, but may not be able to reduce the overall quantity of travel. It may put a
cap on how much congestion reduction we can achieve by encouraging telecommuting, for example, although telecommuting may shift the quantity of travel demand outside of peak hours or to later in the week, as Shafer(2000) Marchetti(1994) and Zahavi’s(1974) research implies: people will travel roughly the same amount, even if the travel is not to the office or at peak times.
Continuously expanding highway capacity to accommodate increasing automobile traffic during peak hours is neither effective nor sustainable in the long term. It is not effective because it doesn’t actually solve the congestion problem. The Downs-Thomson paradox shows how adding extra highway capacity can leave motorists and transit users worse off after new highway lanes open, although Zang et. al. show that there are exceptions where this may not be the case, particularly if the two modes of transportation are not near perfect substitutes (Zhang et al., 2016)
Duranton & Turner have investigated the effects of increasing highway and other road capacity on travel demand and found “suggestive evidence that road congestion increases with expansion on both interstate highways and major urban roads. These results suggest that increased
provision of interstate highways and major urban roads is unlikely to relieve congestion of these roads.” (Duranton & Turner, 2011).
While total travel demand across all modes is likely to remain the same on an average per person basis (Shafer 2000), essentially evidence suggests that automobile traffic on highways and roads will grow to fill the additional capacity that is provided (Duranton & Turner 2011), as there is almost always pent up demand, and will again cause congestion after a period of adjustment, albeit at a greater quantity of vehicles or VMT. This raises the question: Can effective transit alone meaningfully reduce that pent up demand?
Continually expanding highway capacity to solve congestion is also not sustainable. This thesis will assume that alternatives to highway building or expansion must be found to ease congestion and provide for future growth as this method (adding road lanes) will inevitably face severe restrictions as a result of limited land available for road building, and environmental regulations. These restrictions will likely make adding significantly more lanes politically challenging and economically unaffordable in dense metropolitan regions and cities.
Density and land use
This study does not investigate land use and densification measures specifically to deal with congestion or mode shift, as others have thoroughly investigated that connection. This study considers measures connected to transportation modes that may produce some level of mode shift. However, it is perhaps important to note briefly that land use densification geographically close to transit should not be forgotten in the discussion of policy measures. There is an
established link between land use, density and transit ridership, albeit that it may be the effect of self-selection, as people who prefer transit use choose to live close to transit stops in greater numbers or may represent mode shift of people giving up or reducing their auto use. Gutiérrez et
al.(2011) and Seskin & Cervero(1996), point out that density is an important driver of transit
account when dealing with congestion, transit and mode choice: “However, increasing densities must be in conjunction with improved transit service levels, parking, and feeder bus services to take full advantage of rail transit.” (Liu C. et al., 2016).
Transit agencies by and large can do much more with their land assets to promote mixed uses and densification around station precincts and work with local authorities to achieve denser nodes around transit stops; the MBTA in Massachusetts is no exception.
2.1 Accessibility & network convenience
A transit trip is made feasible when specific conditions converge: an access point near a point of origin, an egress point near a destination, and limited transfers during the trip. The transit mode transfers required to complete the trip between origin and destination may influence the real or perceived feasibility of the trip. Changing between modes has a different impact than a transfer between vehicles of the same mode at a particular station or stop.
Many factors, including distance to the station, “first mile, last mile” options, and number and difficulty of transfers involved, all contribute collectively to the inertia that mounts up against using transit or mode shift for commuters. Many questions arise: How close to my point of origin must the station or stop be to be an incentive for me to leave the car at home? How close to my destination point must there be another stop for me to choose to use the train or bus? Planners and transit operators typically consider a half mile walkshed to be the area that will draw
additional walking riders to a system (Metropolitan Washington Council of Governments, 2019). However, with rail, the presence of parking, bicycle infrastructure or feeder bus connectivity increases the footprint of accessibility substantially.
First-mile and last-mile accessibility
Distance to transit origins and destinations as a factor in determining accessibility has been studied by researchers over many years and using a variety of tools (T. A. Litman, 2020). From this work comes measurable metrics dealing with accessibility: the distance to the closest station or stop and the means and ease of getting there. Typically reducing the time taken for the “first mile” and “last mile”, and making the transfer at the station between modes less time consuming, easily traversed, safe and comfortable increases accessibility and encourages mode shift towards Rapid Transit (Wardman, 2006)(Brons et al., 2009).
Estimating these effects requires detailed analysis and modeling. Typically, researchers create a half mile (or 800m) walkshed using GIS and other technology, with a population count to estimate accessibility metrics for transit ridership and indicate the possible population that has access to a particular station.
Transit service to both the origin station and the “last mile” are critical elements of access leading to higher transit use. Brons et al. (2009) point to ease of access being an even higher priority for infrequent rail passengers, offering promising results for mode shift if station access
is improved. Notably “improving the journey to the station is more important than facilitating the transfer between the access mode and the rail through better parking facilities”(Brons et al., 2009). Frequency of service at the “first mile” level is key. “The higher importance passengers have assigned to this dimension in surveys over time means continuous improvements are required and at a higher rate (Brons et al., 2009).
Huanmei Qin et al. have completed an analysis of park-and-ride decision behavior designed to understand accessibility. Their research showed the growing significance of intermediate stops and “trip chaining”. Most stops were to “pick up or drop off children (27% of trip chains), followed by shopping (21%), personal business (21%), eating (13%), and social-recreation (8%)”(Qin et al., 2013). They identify the need to place multiple uses, such as child-care centers and retail shops, in and around transit stations to enable workers to consolidate trip ends(Qin et
al., 2013).
Transfer penalties
The transfer penalty is a measure that represents the perceived impact on a commuter of changing between vehicles or modes of transportation when a one-seat ride to the final
destination is not possible due to network limitations. The literature on the subject demonstrates that transfer penalties do have an impact on mode shift and that downtown Boston stations have very moderate transfer penalties. Greater frequency of service reduces transfer penalties greatly. Algers, Hansen & Tegnér explain the impacts waiting time and the number of transfers have on riders’ mode choice. They use survey data for commuter trips in Stockholm, to show significant variation of the transfer penalty among different transfer types. Bus to bus transfer had the highest transfer penalty. “The value of transfer penalty between rail modes is less than a third of that between buses” (Algers et al., 1975). They do not examine the magnitude of mode shift that results from changes in transfer penalties.
Guo puts the transfer penalties for downtown Boston in context: “In most transit systems in North America, 10% to 30% of riders make at least one transfer to reach their final destination, and in some systems, this percentage exceeds 50% (APTA, 2000). In Boston, 24% of subway trips involve at least one transfer, while in Chicago, more than 50% of CTA passengers transfer during their typical trip” (Guo, 2003).
His study shows that the transfer penalty among MBTA subway riders is less impactful than other systems elsewhere. This is partly good news for the MBTA. He finds that “three quarters of the transfer penalty can be explained in terms of the physical characteristics of the stations”(Guo, 2003). The layout of stations, stairs, elevators etc. will affect this metric. Guo further believes that familiarity with the station, and the transit system generally reduces the transfer penalty. (Guo, 2003). The compactness of downtown Boston also has an impact: “MBTA subway riders are “generally willing to transfer if one transfer saves more than 9.52 minutes of walking time”(Guo, 2003).
Guo does not examine transfer penalties at stations outside of the downtown Boston area or those that involve different modes, such as Central Square (subway to bus) or Porter Square
(Commuter Rail to subway). Outside of Boston’s downtown core, there are no
subway-to-subway transfer opportunities. This means that the transfers usually involve mode changes, either Commuter Rail to subway, bus to subway, Commuter Rail to bus and so on. These transfer penalties will be higher than in the downtown core system. Guo’s work does not imply that new connections such as the Red-Blue connector should not be built, but rather that existing,
individual core transfer penalties in Boston are generally not as high as a number of other transit systems. In fact building new connections such as the Red-Blue connector would reduce the number of transfers for many and thus reduce the total disutility of the trip.
Penalties vary per type of transfer, and that the car-to-rail transfer penalty is three times as impactful as a rail-to-rail transfer penalty (Liu 1997). Wardman et al., estimate that one transfer is valued at 4.5 vehicle minutes for bus users, 8.5 vehicle minutes for car users, and 8 in-vehicle minutes for train (rail) commuters (Wardman, M. et al., 2001). This study suggests that where the transfer in the study area involves different modes, particularly outside of Boston’s downtown, the impact may be greater.
Algers et al. refer to a study by Gustafson, Curd, and Golob, which found that a “no transfer” trip, and less waiting time, were more important than lower fares (Algers et al., 1975).
Iseki and Taylor have looked at transfer penalties more generally from an economic theory perspective. They consider metrics of waiting time, number of transfers, walking distance between transfers and reduce the impact of these factors to a mathematical equation which can evaluate connectivity. In econometric fashion, they convert “all time, fare and qualities of travel into comparable costs” and then isolate transfer penalties, giving each delay a monetary value related to time (Iseki & Taylor, 2009). Station attributes such as the quality of lighting, signage, presence or absence of escalators, ease of access and transfer between modes, benches,
restrooms, shade, and security, which might contribute to the “burden” of travel are weighted in an index to determine the total transfer cost to a commuter (Iseki & Taylor, 2009).
They conclude that transfers can be made less impactful for riders and therefore “influence transit use” and point to on-time performance as one method of reducing the transfer penalty (Iseki & Taylor, 2009). Their work provides a good theoretical analysis of the problems faced by transit agencies attempting to quantify what turns potential transit riders away and provides a monetized way to attempt to calibrate the degree of impact of each factor. They indicate a methodology for connecting transfer penalties to ridership numbers, however they do not make the connection to mode shift.
Legibility (information and wayfinding services) may contribute to the transfer penalty. However, regret-based models and simulations have suggested that the effect of transit information alone on modal shift is not high (Chorus et al., 2006).
Mode shift induced by opening new transit lines
New transit lines, particularly Heavy Rail are demonstrated over time in the literature to be one of the most significant ways of inducing mode shift. New Light Rail and Bus Rapid Transit
(BRT) lines do induce mode shift, but the impact on congestion is lower than Heavy Rail due to the lower capacity of such systems, all else being equal.
When examining the mode shift induced by the opening of a new BRT system, Light Rail system (LRT) or Metro System, Ingvardson and Neilson have collated a number of studies that
summarize mode shift magnitudes for some transit systems. This shows a mode shift magnitude of 0% to 50% from car to Light Rail or a Mode shift of 8% to 35% for Metro rail/Commuter Rail (Ingvardson & Nielsen, 2018). These findings relate to new lines or new routes, not individual new stations. Capacity matters, as the research shows that, with some exceptions, “metro systems can have larger impacts on road congestion than BRT systems. (Yazici et al., 2013)”
(Ingvardson & Nielsen, 2018). The wide range of impact can be understood in terms of the differences in local conditions and capacitity of the different systems.
Cities in Norway, Germany, France, and Switzerland had lower mode shifts in the meta-analysis of Ingvardson and Neilson (2018) This may be explained by research suggesting that congestion reduction for dense, established cities with already well-developed transit will be low when new lines are opened unless additional car restrictions are instituted. Olesen (2014)
In the US and UK studies have shown a degree of mode shift for Light Rail (Hass-Klau, C., Crampton, G., Biereth, C., & Deutsch, V., 2003), (Giuliano et al., 2016),(Chakrabarti, 2017), but the construction of the metric used is problematic. If riders are counted on new transit lines that have switched from their automobiles, often the shift is easily quantifiable and is often a healthy percentage of new transit riders. However due to the dynamic nature of traffic, congestion on the roads nearby offering a comparable alternative to transit, may remain as motorists from other routes may shift to the now less congested transit alternative routes from which transit riders have shifted. A multi-pronged approach to mode shift will be required to reduce the impact of this effect.
Below is a table constructed from many of the studies reported of the various Light Rail and Heavy Rail or metro services indication ridership that has shifted. Note that the figures in the table indicate percentage of current ridership that has shifted from automobiles, not the percentage of automobiles that have been removed from local roads.
Light Rail
Angers Tramway (LRT, Angers) 0.0% Olesen (2014) Midland Metro (LRT, Birminigham) 13.0% Harper and Bird (2000)
Croydon (LRT, Croydon) 19.0% Copley, Thomas, Maunsell, and Georgeson (2002) Metrolink (LRT, Manchester) 27.0% Knowles (1996)
Blue Line (LRT, Los Angeles) 21.0% Lee and Senior (2013) Sheffield Supertram (LRT, Sheffield) 22.0% Lee and Senior (2013) Blue Line (LRT, San Diego) 30.0% Lee and Senior (2013) Orange Line (LRT, San Diego) 50.0% Lee and Senior (2013)
Nantes LRT (LRT, Nantes) 17.0% Lee and Senior (2013); PTEG; Hue, R. Paris Light rail Sait Denis 4.0% RATP
Paris Issey Light Rail 7.0% RATP
Nantes Line 1 LRT 37.0% UITP 1998 page 138
Mean 20.6%
Avg. 14 European systems (LRT) 11.0% Hass-Klau, Crampton, Biereth, and Deutsch (2003) quoting UITP (Hue, R) Metro/Heavy Rail
Copenhagen Metro (Metro, Copenhagen) 9.8% Vuk (2005) BART (Metro, San Francisco) 35.0% Richmond (1991) Madrid Metro 26.0% Monzon (2000) Xi'an Metro, China 7.8% Wang (2013) Delhi Metro 28.8% Chauhan (2016) Athens 16.0% Golias (2002)
Mean 30.9%
Table 1. Summary of ridership shift on new transit routes.
Note that a given percentage of riders who formerly drove will be a higher absolute number of former drivers for a higher capacity mode (e.g. Metro). If Heavy Rail moves more people faster than Light Rail or buses, it stands to reason that it should have a higher impact on mode shift, all else being equal.
The growth of traffic generally may reduce the apparent mode shift effect even of a new transit line, unless a multipronged intervention is implemented to prevent this from happening. In the case of the Madrid Metro extension project, Monzon (2005) points out: “the new metro line, together with bus services, has reduced car patronage by 6 per cent since its implementation.” However the car traffic was actually still increasing overall (8601 daily trips in 1996 to 8912 daily trips in 2001) while mode shift was happening towards the newly opened metro line (Monzón, A., 2005). So while mode shift was significant at 6% of total trips, congestion may
have actually gotten worse at the same time, although the rate of increase may have been slowed
by the new Metro Lines.
The weight of available research indicates that opening a new Heavy Rail or subway line will cause mode shift, although by itself traffic reduction may be lower than expected. In Manchester, England, Richard Knowles indicates that while rail use after the introduction of the new
Metrolink line “had doubled to 8% in 1993”, car use had dropped by 3% (Knowles, 1996). In Athens, Greece, J.C. Golias noted that the Metro system has attracted 24% of riders from car use (Golias, 2002). This new Metro line, “helped alleviate traffic, on the corridors it serves”(Golias, 2002).
The quantum varies, and often traffic will divert from other routes and areas to fill up the some of the space on routes where the shift has occurred. This can give the appearance in some instances of little improvement in traffic flow. In the case of Light Rail, it is more difficult to identify the traffic improvement than a new Metro line which has much greater capacity.
This is not to say that Light Rail cannot impact congestion. Giuliano et al. point to the work of Bhattacharjee and Goetz (2012) who examined the Denver LRT system on highway traffic over a 16-year period and found “evidence that average VMT in the control zone of the fully built system increased by about 41 percent between 1992 and 2008, compared to a relatively smaller increase of about 31 percent in the corresponding influence zone.”(Giuliano et al., 2016). If we summarize the effects of a new line on mode shift, and remove the extreme outliers, we would find a shift magnitude of 4% to 37% of Light Rail ridership or a shift of 8% to 35% of metro rail/Commuter Rail ridership. However this may only translate to 1% to 5 % mode shift of
drivers on the substitute highways or roads due to pent up demand in the area and drivers shifting
from other routes as the congestion eases up. Effect of new stations:
Opening a new station will not have the same effect as opening an entire new rail line and the literature indicates that new stations that are successful in promoting mode shift in larger numbers are connected to new Transit Oriented Development (TOD) projects.
Mode shift from the introduction of a new station is a function of the land use and development around that station (Zhu et al., 2018), and a study focused on Austin (Texas) shows that “TOD helps reduce traffic congestion by around 4% and reduce VMT by 22%” (Zhu et al., 2018). It may be instructive to consider a case study of two Metro Boston Commuter Rail expansions: the Greenbush Line and the Boston Landing Station on the Worcester Commuter Rail line. Ridership attracted to Boston Landing Station exceeded expectations, while ridership along the Greenbush Line failed to meet reasonable expectations (Moskowitz, E., 2010). Further study needs to be done to establish whether land use patterns and densities were different to those used in the modelling by the Massachusetts Department of Transportation and whether the actual transit service availability was the same as that used in the modelling.
Arentze et al. have studied the introduction of a new Dutch railway station in Voorhout, Netherlands. They examined household transportation behavior before and after the station opening and found that commuter behavior changed, not just in terms of mode choice. (Arentze
et al., 2001).By examining the average behavior for participants in the study they found that
“The share of car in the total distance traveled has decreased approximately 9 percent”(Ibid). Parking availability
Parking impact on mode shift depends largely on two factors: its cost and availability. The cost of parking at transit stops or at commute destinations influences ridership on transit and mode shift but in the inverse direction. Increasing parking pricing at the destination pushes mode shift towards transit, while increases in parking pricing at transit stops drives traffic away from transit. Availability of parking has a similar inverse impact. More parking at transit stops (origin stops) increases ridership demand and more parking near commute destinations reduces transit
al., 2011), and a more recent examination of the Washington D.C. Metro where stations with
higher available parking attracted higher ridership numbers (Iseki et al., 2018).
Qin et al. have done an analysis of park-and-ride decision behavior based on decision field theory on data in China. They find that measures such as information providing park-and-ride facility locations, parking fee, available parking spots might improve the decision process for commuters and increase the utility of park-and-ride facilities. They find providing free parking for the park-and-ride facility would push travelers to choose Park and Ride (Qin et al., 2013). Parking at outlying MBTA stations
Parking availability contributes in a measurable way to increased ridership. The MBTA has at least 100 parking garages covering over 44,000 spaces (Parking | MBTA, n.d.). Parking is also provided “at another 175 locations near Commuter Rail and subway stations” by other
landowners (Vaccaro, A., 2019).
Kuby, Barranda and Upchurch have examined Light Rail boardings in the US at 9 cities and find “All else being equal… each 100 park-and-ride space (leads) to 77 boardings; each bus to 123 boardings; and an airport to 913 boardings.”(Kuby et al., 2004).
The Central Transportation Planning Staff (CTPS) of the Boston region Metropolitan Planning Organization have been modelling the future parking needs of the Commuter Rail and Rapid Transit systems of the MBTA in a future no-build scenario. With their model, “stations such as Alewife and Malden were filled to capacity,… and in the South, Braintree and Forest Hills stations had medium demand for additional parking,” (CTPS, 2019).
Further study of governance issues (who owns the land, who sets the rates) affecting the control of supply and demand of parking as it affects mode shift and transit ridership needs to be done, and specific roles delineated for private and public real estate owners including the MBTA. Destination parking
The availability of parking at one’s destination plays a large role in the use of a personal vehicle for daily commuting (Bianco et al., 1997). Taylor & Fink point to the earlier work of Morrall and Bolger (1996) on the question of parking supply: “They found that the number of downtown parking stalls per CBD employee explained 92 percent of the variation in percent transit modal split for Canadian cities and 59 percent for …U.S. cities” (Taylor & Fink, 2003).
Smart parking & transit
Smart parking is a relatively new phenomenon for transit authorities. Smart parking consists of using technology to help motorists locate, reserve, and pay for parking from their phone or computer with parking availability displayed on electronic message signage. Rodier et al. examine a new transit-based smart parking product launched in the San Francisco Bay area. (Rodier & Shaheen, 2010).
Results were significant. In the San Francisco area, “It is estimated that an average participant reduced their monthly VMT by 9.7 miles.” With the introduction of smart parking, “55.9% of users, shifted their long-haul commute mode from drive alone, to BART for off-site work
commutes. Smart parking also encouraged 30.8% of respondents to use BART instead of driving alone to their on-site work location”(Rodier & Shaheen, 2010).
The idea is to improve accessibility to station parking and convenience for commuters. This allows for more efficient parking use. The net effect indicated in a survey of commuters is that of increased transit use and some degree of mode shift as indicated.
Rodier, Shaheen and Blake followed this study up subsequently with a further study in San Diego. A website has subsequently developed to facilitate smart parking in California and can be found at www.parkingcarma.com
Parking for bikes & PMD’s & bike access
The literature indicates that parking and lock up for bikes and personal mobility devices (PMD’s) such as scooters and the availability of bike lanes does increase mode shift, but of a small
quantity. There are indications that bike facilities including both parking and cycle lanes can change mode of access to a train station, but the shift from car to bike plus train takes some change in the culture and behavior of a community.
The OLS regression estimates in Zhao et al. (2013) suggest “an increase of six [metro] riders for each bicycle P&R space”(Zhao et al., 2013).
Cervero et al. (2013) analyze several Bay Area Rapid Transit (BART) stations, confirming the positive effect of the quality of bicycle parking facilities but suggesting that this effect concerns primarily residents living near the station. In the Netherlands, Williams (2017) notes that
bicycling accounts for 47% and 12% of first-mile and last-mile modes for train trips respectively but makes no finding with regard to the bike-train mode and mode shift from automobiles. Semler, and Hale point out that “most agencies achieve bicycle access mode shares around 2-5%” and that “international research shows that bicycle access mode shares up to 40 percent are attainable (Parsons Brinkerhoff 2009; Martens 2004; Herman et al. 1993). Indeed, 47% of respondents in a survey of New Jersey rail commuters stated they would consider cycling from home to the train station, if facilities were improved (Herman et al. 1993).” (Semler & Hale, 2010).
Overall, the literature on the mode shift potential of bike and PMD access and parking at stations describes only limited impact on mode shift from auto to bike plus transit while recognizing the “leverage effect of bike parking availability, in quantity and quality, on the practice of bicycle-train integration” (Martens, 2007; Givoni and Rietveld, 2007, 2008; Krizek and Stonebaker, 2011; Arbis et al., 2016; Sherwin and Parkhurst, 2008)” (Midenet et al., 2018). The MBTA may
be able to find ways to accommodate bikes for hire and bike lock up spaces closer to train platforms to encourage commuters to leave the car at home.
Pedestrian access.
The relationship between pedestrian access to train stations and mode shift implies that better pedestrian access might persuade commuters to use transit instead of taking the car all the way to the office. The concept could be understood in a similar fashion to transfer penalties. Increasing the difficulty of access adds one more hidden “cost” to taking transit.
Akbari et al. have studied access to transit stations Greater Toronto and Hamilton Area. They find that demand is significantly associated with population density and walkability in the surrounding vicinity of the station, among other factors.“We draw a conclusion that the urban form attributes surrounding TOD stations and the station level attributes have statistically significant relationship with transit ridership by walk access/egress.” (Akbari, S. et al., 2016). Semler & Hale (2010) explain that traditionally it was accepted that “people are willing to walk an average of 800 metres, and many will walk considerably farther to high quality rail transport (Martens 2007; Dantas 2005)” Many factors are considered by pedestrians walking to transit stations such as sidewalk conditions, crime and safety and many others. Rail agencies should “support or encourage development in the vicinity of the station”(Semler & Hale, 2010). Bus connections
Research supports the conventional wisdom that good bus connections to train stations are associated with mode shift to transit. For example Akbari et al., have found that “station-level passenger trip production is significantly associated with… the number of bus feeder lines ...” (Akbari, S. et al., 2016). Gutiérrez et al. find a similar association (Gutiérrez et al., 2011). Lownes makes an interesting observation of the history of Commuter Rail in the US:“Existing rail ROW does not often coincide with current commercial and residential demand centers and necessitates the use of a circulator system (bus) to expand the service... Because Commuter Rail eventually seeks to reduce congestion.” (Lownes, N., 2007).
It seems that frequency of feeder buses is the most significant factor in increasing ridership via feeder buses and so promoting a high degree of mode shift (Cervero, 2006). Brons et al. find that in an average Dutch neighborhood if the frequency of public transport services to the station would increase from two to three services per hour “an additional 6357 trips per year can be expected, which constitutes an increase of 5.18%; not a minor increase in rail use” (Brons et al., 2009).
Interviews conducted by Hale & Scott showed the need to reduce the time taken in transfers and providing real time information to riders at transfer stations being crucial to improving feeder bus mode share (Hine & Scott, 2000).
It is difficult to find hard numbers on the relationship between adding feeder buses to rail and mode shift. Two studies give some indication.
In Maryland, Liu et al. experiment with direct ridership models and find that“for Light Rail stations, employment… service level, feeder bus connectivity, station location in the Central Business District (CBD), … are significant factors influencing ridership. However for Commuter Rail stations, (MARC) only feeder bus connections are found to be significant.”(Liu C. et al., 2016) Among all the independent variables, only feeder bus connections are statistically
significant. “The effect of feeder bus services is dominant and the elasticity is 96.32%” (Liu C. et
al., 2016). Presumably this will induce an amount of mode shift as a result.
Zhao et al. have investigated Metro ridership in NanJing, China and Seoul, Korea and point to the need for free transfers to increase the transfer rate from buses to trains. “For each feeder bus line, an increase of 503 passengers would be expected inNanjing. However, the bus–Metro transfer riders were much fewer than that (+1,382) of Seoul” (Zhao et al., 2013). Seoul had offered bus riders free transfers to Metro, but this was not done in Nanjing. (Zhao et al., 2013). Again multiple factors influencing the change were operating simultaneously to achieve a greater shift.
Advertising and marketing
Advertising promotes knowledge of the transit service and encourages mode shift, particularly when new services or facilities are opened. The advertising impacts on mode shift seem to have received a disproportionately low level of attention verses other factors. Carol Lewis has
examined the question of marketing to boost transit ridership. The report suggests that marketing techniques that are both low-cost and cost-effective are needed by transit agencies and may be “crucial to their viability”(Lewis, C., 2012).
Sharp’s research is discussed below but he has highlighted positive results of Metrolink’s efforts at marketing their service. Officials were quoted as saying that the key to ridership growth was their marketing efforts. (Sharp, S., 2019). However as pointed out below, other factors were at play and it is uncertain that the marketing efforts on their own can be separated out from the service improvements as the primary cause of ridership growth.
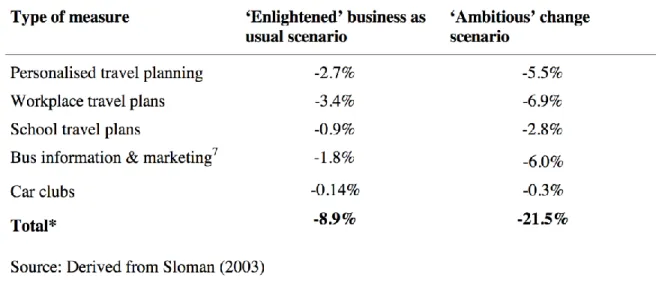
Jones & Sloman in their 2003 study point to substantial reductions in car use in favor of
alternative modes including walking, taking a bus, and the use of car clubs. However their study points out that a combination of methods were jointly employed including advertising,
informational services and assistance with travel planning. It is the combination which produces the larger than usual mode shift from advertising and informational services(Jones & Sloman, 2003) The table below is illustrative of their results:
Table 2: Jones & Sloman table of cumulative advertising and informational impacts
Currie and Wallace have completed a study in Australia and find advertising, marketing and informational services to be the most cost effective method of inducing ridership on buses and trains. They find an overall public transportation mode share increase of between 6 and 7.1% for very successful bus marketing and passenger information service campaigns in South Perth, Victoria and the Melbourne Tram marketing campaign (Currie & Wallis, 2008). This is for time bound specific campaign interventions.
Sorrel finds more muted effects for social media marketing campaigns (Sorell, 2005). Cairns et
al. reviewing a study by the British government conclude that public transport information
and marketing can produce between 0.1% and 1.1% percentage reduction in car kilometers, and travel awareness campaigns between 0.1% and 1% (Cairns et al., 2008).
The six studies taken together indicate that marketing on its own has a small positive effect on mode shift, but produces larger effects when coupled with other measures such as transit service improvements.
2.2 Service level, comfort & safety
The level of service of a transit system affects commuters and will have an effect on mode shift including hard metrics like frequency, travel time, reliability and less tangible qualities such as comfort and safety. A number of researchers discuss “quality of service” which can be a very nebulous concept, as its definition is somewhat subjective. This makes it difficult to decide what “quality” of service is acceptable and what minima apply. We shall first examine the “hard” metrics of transit service levels.
Speed and travel time
Travel time repeatedly appears in studies of mode shift and transit use. Researchers have
attempted to understand how both motorists and transit users perceive time and how this affects their mode choice decisions. How travel time is valued will impact mode choice depending on congestion on the roadways on individual commutes and the travel time on the realistic
alternatives.
Van de Walle and Steenberghen find a link between travel time and mode choice. “On the trip chain level, travel time variables for the whole trip chain such as the maximum and the range in the travel time ratio provide a significant improvement to the explanatory power of the
regression model.” (Van de Walle & Steenberghen, 2006). Frank et al. similarly find travel time and cost were associated with mode choice in their study of transportation in the Puget Sound area. “Travel time was the strongest predictor of mode choice”. (Frank et al., 2008).
While travel time has been shown to be a predictor of mode share, it is important to remember that travel time is a relative concept. Mode choice is decided on the relative travel time and the impact on some modes has a higher predictive value than others.
Chakrabarti, for example finds travel time to be a primary factor in predicting mode share. His study in California finds that “reduction in transit-to-auto travel time ratio can increase the odds (likelihood) of choosing transit by 25%; reduction in headway by 10 minutes can increase odds by about 30%.” He finds similarly that reducing schedule unreliability from over to under three minutes deviation can result in 2.6 times increase in the likelihood of choosing transit
(Chakrabarti, 2017). Reliability of service
Transit reliability and auto time travel reliability are both factors that affect mode shift. Often it is the magnitude of the difference between these factors that spurs the mode shift where
commuters are able to make a choice between modes.
The Washington DC Metro, according to ridership data from the Federal Transit Agency, has had the largest ridership drop of any transit system in the past 10 or 15 years. The WMATA Board reported: “ research has found that at least 30% of our ridership losses in 2013-2016 were due to decreasing customer on time performance”(WMATA Board, 2017).
Service reliability does not always impact mode shift to a large degree. Perk et al., (2008) discuss travel time reliability and rider retention in their study for the Florida Department of Transportation. They record that in Chicago, “PACE responded to complaints of irregular bus service on Route 350, in June 2006.” They adjusted headways and improved reliability.
“Between June 2006 and June 2007, ridership on Route 350 increased by 21.9 percent, compared to a system-wide increase in ridership of 5.2 percent.” (Perk, V. et al., 2008).
Southern California Regional Rail Authority (SCRRA) showed that in the case of Metrolink (the provider of Commuter Rail service in the Los Angeles area) “on-time performance was the
second most important determinant of customer satisfaction”(Perk, V. et al., 2008). In
Sacramento a different picture emerged. The Sacramento Regional Transit found that on route 30, “ridership … decreased over time in spite of the substantial improvement in schedule reliability.” (Perk, V. et al., 2008).
Sweet and Chen’s study creates a regional measure of travel time unreliability and explores mode choice responses in Chicago. Their results indicate that unpredictable road travel conditions induce mode shift towards transit and this effect is larger when service by train is faster (Sweet & Chen, 2011). Their study shows that “one standard deviation drop in travel time reliability… is associated with approximately a 23% reduction in the odds of using the car” (Sweet & Chen, 2011). Bhat & Sardesai also find that travel time reliability is key in commute mode choice (Bhat & Sardesai, 2006) and Imaz et al. in Toronto, Canada, find that “service quality and reliability attributes are the main drivers of public transportation customer loyalty”(Imaz et al., 2015).
Ironically, Brons et al. find that although the perceived reliability of the rail service is important “the actual reliability of rail service has no significant effect on the level of rail (and car)
use”(Brons et al., 2009).
Frequency of service
Service frequency is a crucial metric of the level of service of a transit system but may stand as a proxy for travel time or reliability in the minds of the public. Increased frequency may be able to mask shortcomings in speed and reliability of the train service to some degree.
Noland uses a model of schedule disutility to show that transit service reductions result in reduced ridership and highway capacity increases “result in both an immediate reduction in transit use and potentially a long-run reduction along the lines of the Downs-Thomson paradox” (Noland, 2000), but similarly to Mohring (1972) increasing frequency of transit or reducing fares could, reduce automobile travel (Noland, 2000).
Crowding and comfort
Crowding relates to comfort and public perceptions. However public perceptions cause mode shift as Gao et al. detail in their study of mode shift in China, which is discussed under the heading “Multi-factoral research” below. Their research does however find that in-vehicle
crowding of public transit is a much more crucial factor for mode shift to public transit compared to cost and travel time.
Cox et al. examine rail passenger crowding, stress, health and safety in Britain. They point to the success of the Japanese rail network, which can cope with enormous demand. “Part of its