LCA Methodology
Applying Cumulative Exergy Demand (CExD) Indicators to the
ecoinvent Database*
Michael E. Bösch1**, Stefanie Hellweg1, Mark A.J. Huijbregts2 and Rolf Frischknecht3
1Institute of Environmental Engineering, ETH Zürich, 8093 Zürich, Switzerland
2Department of Environmental Science, Institute for Wetland and Water Research, Faculty of Science, Radboud University Nijmegen, P.O. Box 9010, NL-6500 GL Nijmegen, The Netherlands
3ecoinvent Centre, Empa, Ueberlandstrasse 129, 8600 Duebendorf, Switzerland
** Corresponding author ([email protected])
respectively. Looking at individual processes, the contribution of the resource categories varies substantially from these average product group values. In comparison to Cumulative Energy Demand (CED) and the abiotic-resource-depletion category of CML 2001 (CML'01), non-energetic resources tend to be weighted more strongly by the CExD method.
Discussion. Energy and matter used in a society are not destroyed but only transformed. What is consumed and eventually depleted is usable energy and usable matter. Exergy is a measure of such useful energy. Therefore, CExD is a suitable energy based indicator for the quality of resources that are removed from nature. Similar to CED, CExD assesses energy use, but regards the quality of the energy and incorporates non-energetic materials like minerals and metals. How-ever, it can be observed for non-renewable energy-intensive prod-ucts that CExD is very similar to CED. Since CExD considers ener-getic and non-enerener-getic resources on the basis of exhaustible exergy, the measure is comparable to resource indicators like the resource use category of Eco-indicator 99 and the resource depletion category of CML 2001. An advantage of CExD in comparison to these meth-ods is that exergy is an inherent property of the resource. Therefore less assumptions and subjective choices need to be made in setting up characterization factors. However, CExD does not cover societal demand (distinguishing between basic demand and luxury), avail-ability or scarcity of the resource. As a consequence of the different weighting approach, CExD may differ considerably from the resource category indicators in Eco-indicator 99 and CML 2001.
Conclusions. The current work shows that the exergy concept can be operationalised in product life cycle assessments. CExD is a suit-able indicator to assess energy and resource demand. Due to the consideration of the quality of energy and the integration of non-energetic resources, CExD is a more comprehensive indicator than the widely used CED. All of the eight CExD categories proposed are significant contributors to Cumulative Exergy Demand in at least one of the product groups analysed. In product or service assess-ments and comparative assertions, a careful and concious selection of the appropriate CExD-categories is required based on the energy and resource quality demand concept to be expressed by CExD. Recommendations and Perspectives. A differentiation between the exergy of fossil, nuclear, hydro-potential, biomass, other renewables, water and mineral/metal resources is recommended in order to obtain a more detailed picture of resource quality demand and to recognise trade-offs between resource use, for instance energetic and non-ener-getic raw materials, or nonrenewable and renewable energies. Keywords:Cumulative energy demand (CED); cumulative exergy demand (CExD); ecoinvent database; energy efficiency, exergy; life cycle assessment (LCA); resource efficiency, resource quality demand DOI: http://dx.doi.org/10.1065/lca2006.11.282
Please cite this paper as: Bösch ME, Hellweg S, Huijbregts MAJ, Frischknecht R (2007): Applying Cumulative Energy De-mand (CExD) Indicators to the ecoinvent Database. Int J LCA 12 (3) 181–190
Abstract
Goal, Scope and Background. Exergy has been put forward as an indicator for the energetic quality of resources. The exergy of a re-source accounts for the minimal work necessary to form the rere-source or for the maximally obtainable amount of work when bringing the resource's components to their most common state in the natural environment. Exergy measures are traditionally applied to assess energy efficiency, regarding the exergy losses in a process system. However, the measure can be utilised as an indicator of resource quality demand when considering the specific resources that contain the exergy. Such an exergy measure indicates the required resources and assesses the total exergy removal from nature in order to pro-vide a product, process or service.
In the current work, the exergy concept is combined with a large number of life cycle inventory datasets available with ecoinvent data v1.2. The goal was, first, to provide an additional impact category indicator to Life-Cycle Assessment practitioners. Second, this work aims at making a large source of exergy scores available to scientific communities that apply exergy as a primary indicator for energy efficiency and resource quality demand.
Methods. The indicator Cumulative Exergy Demand (CExD) is in-troduced to depict total exergy removal from nature to provide a product, summing up the exergy of all resources required. CExD assesses the quality of energy demand and includes the exergy of energy carriers as well as of non-energetic materials. In the current paper, the exergy concept was applied to the resources contained in the ecoinvent database, considering chemical, kinetic, hydro-poten-tial, nuclear, solar-radiative and thermal exergies. The impact cat-egory indicator is grouped into the eight resource categories fossil, nuclear, hydropower, biomass, other renewables, water, minerals, and metals. Exergy characterization factors for 112 different re-sources were included in the calculations.
Results. CExD was calculated for 2630 ecoinvent product and pro-cess systems. The results are presented as average values and for 26 specific groups containing 1197 products, processes and infrastruc-ture units. Depending on the process/product group considered, en-ergetic resources make up between 9% and 100% of the total CExD, with an average contribution of 88%. The exergy of water contrib-utes on the average to 8% the total exergy demand, but to more than 90% in specific process groups. The average contribution of minerals and metal ores is 4%, but shows an average value as high
as 38% and 13%, in metallic products and in building materials, * ESS-Submission Editor: Dr. Gerald Rebitzer (Gerald.Rebitzer@
Introduction
Exergy can be regarded as a measure of useful energy. While energy is motion or ability to produce motion, exergy is work (=ordered motion) or ability to produce work (Wall 1993). Hence exergy designates the quality or availability of en-ergy. Energy can be transformed but is always conserved as states the first law of thermodynamics. Exergy in contrast, is consumed in all real world processes as entropy is pro-duced, according to the second law of thermodynamics (Szargut 2005) (Eq. 1):
δEx = T0∑∆S (1)
Ex = Exergy (MJ)
T0 = Temperature of the surroundings (K)
S = Entropy (MJ/K)
Since exergy is a property of both the system and the envi-ronment, a reference environment is required. While the ra-tio between exergy and energy of an energy source can be directly calculated within such a reference environment, fur-ther reference states need to be defined to calculate the exergy content of matter. Since the natural environment is not in thermodynamic equilibrium, reference species are required for all elements, representing the most stable compounds that are commonly occurring in the environment. The chemi-cal exergy of a substance can be chemi-calculated by means of the formation reaction that contains only reference species and the substance itself. The exergy value characterizes the mini-mal amount of work that is required to form the substance, or reversely, the maximal amount of work that can be ex-tracted from the substance in a specific environment. Hence exergy refers to the physical value of a substance (Wall 1993). All production and consumption processes require energetic and material resources from the environment that feature exergy. The exergy requirement of technical processes can thus be seen as an indicator of resource quality demand that weights each resource by its theoretical energetic usefulness. Szargut et al. (1988) presented a comprehensive methodol-ogy to calculate the exergy of energetic and non-energetic raw materials and provides an extensive list of exergy val-ues for elements and various industrially used resources. This list of exergy values was updated in Szargut (2005). The present work refers to the reference species and resource exergies of Szargut (2005). However, some missing resources were adapted from Szargut et al. (1988). Data consistency is assured since only resources that contain elements with unaltered exergy values were adopted.
Other authors have applied and further developed exergy demand as an indicator for energetic efficiency and resource quality demand. For instance, Finnveden et al. (1997) de-veloped exergy-based characterization factors based on Swed-ish mineral resources to be used in the impact assessment of Life-Cycle Assessment (LCA). Exergy balances have also been developed for entire countries (Frank 1956) and for whole industries in order to estimate the exergetic efficiencies of raw-material conversion into products of economic value (Wall 1990, Wall et al. 1994, Schaeffer et al. 1992, Ozdogan et al. 1995). More recent studies focus on waste treatment (Dewulf et al. 2000a, 2002a) and extend exergy analyses over the
whole life cycle of products (Dewulf et al. 2000b, 2002b, 2004). In many of these studies it is stated that a database of exergy values for basic processes would be useful to fill data gaps and maintain data consistency. This emphasises the potential usefulness of coupling the extensive inventory work done in LCA with exergy indicators.
The goals of the current paper are (i) to provide exergy scores for a large number of materials and processes and (ii) to compare the exergy scores with resource use and resource depletion scores from conventional LCIA methods.
1 Methods
1.1 Cumulative exergy demand
In order to quantify the life cycle exergy demand of a prod-uct, the indicator Cumulative Exery Demand (CExD) is de-fined as the sum of exergy of all resources required to pro-vide a process or product (Eq. 2). The notation CExD was chosen in this paper to stress the similarities to CED. CExD is equivalent to the definition of cumulative exergy consump-tion (CExC) of Szargut (2005), both quantifying the total exergy requirement of a product. Szargut et al. (1988) cal-culated CExC by adding up the total exergy requirement of a process over a time period (e.g. one year). The exergy re-quirement of one unit of process output was then obtained by dividing the total exergy requirement by the number of unit outputs during this time period. The emergence of large life cycle databases such as ecoinvent enables and facilitates a product-specific approach, since such databases provide the resource demand for each unit process. Hence, improved CExD scores can be calculated that indicate the exergy de-mand of a single product directly. CExD is specified in MJ-equivalents to highlight that it is an impact assessment indi-cator and not an inventory elementary flow.
(2)
CExD = cumulative exergy demand per unit of
prod-uct or process (MJ-eq)
mi = mass of material resource i (kg)
Ex(ch),i = exergy per kg of substance i (MJ-eq/kg)
nj = amount of energy from energy carrier j (MJ)
rex – e(k,p,n,r,t),i = exergy to energy ratio of energy carrier j (MJ-eq/MJ) ch = chemical k = kinetic p = potential n = nuclear r = radiative t = thermal exergy
Exergy is stored in resources in the form of chemical, ther-mal, kinetic, potential, nuclear and radiative energy. The assignment of the adequate type of exergy depends on re-source use (Szargut 2005):
• Chemical exergy is applied on all material resources, for biomass, water and fossil fuels (i.e. all materials that are not reference species in the reference state)
• Thermal exergy is applied for geothermy, where heat is withdrawn without matter extraction
• Kinetic exergy is applied on the kinetic energy in wind used to drive a wind generator
• Potential exergy is applied on potential energy in water used to run a hydroelectric plant
• Nuclear exergy is applied on nuclear fuel consumed in fission reactions
• Radiative exergy is applied on solar radiation impinging on solar panels
The above list refers only to resources that are included in the ecoinvent database. For instance, noise could also in-clude kinetic energy, but it is not considered as a useful re-source here.
1.2 Chemical exergy
The chemical exergy of a compound depends on its compo-sition. If the composition is known, the chemical exergy can be calculated on the basis of the chemical formation reac-tion, utilising the Gibb's free energy of formation and the exergy of the chemical elements in the substance (Eq. 3). The exergy of chemical elements is provided by Szargut
(2005) and data on ∆fGi° is available in handbooks (e.g.
Atkins 2001). A solid material consisting of several chemi-cal compounds is regarded as a mixture of separate grains (Finnveden et al. 1997). The chemical exergy is calculated by adding up the exergy of the mole fractions (Eq. 3). The standard chemical exergies for most of the ecoinvent re-sources have already been calculated in previous studies and are taken from Szargut et al. (1988, 2005). Molar chemical
exergies exch can be approximated by the standard molar
exergies ex°chfrom the reference environment (Szargut 2005).
(3)
Exch : molar chemical exergy of material (kJ/mol)
nj : mole fraction of substance j in material (–)
ex°ch,j : standard molar chemical exergy of substance (kJ/mol)
∆fGi° : standard Gibb's free energy of formation of
sub-stance (kJ/mol)
ex°ch, el : standard partial molar chemical exergy of elements in substance (kJ/mol)
nel : number of elements in compound (–)
The chemical composition of some resources, such as min-eral substances (denoted as Minmin-erals in this paper) is pro-vided in ecoinvent data v1.2 (ecoinvent Centre 2005). Szargut (2005) provides exergy values for the majority of the miner-als captured in the ecoinvent database.
By contrast, other resources do not have a well-defined com-position. For instance, rocks and ores are composed of vari-ous minerals. The composition may vary considerably in different locations even on a small geographical scale. In the case of rocks, exergy calculations were carried out for aver-age rock compositions, assumed on the basis of information from external sources (see Table S1 for references: Support-ing Information, online only). Ores are rocks that are mined for commercial metal extraction. Although the ecoinvent data
v1.2 includes metallic resources per kilogramme of pure metal only, the whole ore should be considered in order to account for the overall material extraction from nature (Finnveden et al. 1997). The ecoinvent elementary flow names provide the weight fraction of the specific metals for most of the ores. If the weight fraction was not specified, assumptions were made based on other information (see Table S1: Supporting Information, online only). The min-eral composition of the ore is not provided by the ecoinvent names, because specific data is very scarce. Finnveden et al. (1997) performed exergy calculations of ores with data from mines that are mainly located in Scandinavia. Since the ecoinvent data v1.2 does not refer to the same mines, we did not directly use the data of Finnveden et al. (1997) for specific ores. There is no direct connection between the metal species and the composition of the ore (Lichtensteiger 2006). Hence, an average ore composition was assumed for all ores, represented by the median exergy value of the ores in Finnveden et al. (1997), which accounts for 0.63 MJ of exergy per kilogramme of ore. Differences in exergy values between the metals from ores are due to the metal concen-tration encountered in the ores. The higher the concentra-tion of a metal in an ore, the smaller is the amount of ore to be mined in order to gain 1 kg of the metal. Therefore, met-als that occur at high concentrations in ores require the ex-traction of less exergy than metals occurring at low concen-trations. Hence, the decreasing concentration of metals in ores as a consequence of human extraction is reflected in the CExD factor for a resource.
Several ores in ecoinvent data v1.2 contain two or more extractable metals. An allocation factor was applied to allo-cate the total exergy of an ore to the distinct metals. Alloca-tion is necessary to avoid double counting. For instance, cadmium and zinc are retrieved from the same ore. There-fore, the exergy of the ore needs to be allocated to these two metals (Eq. 4). Allocation was performed by revenue when-ever ecoinvent data v1.2 provides the revenue factors; oth-erwise, allocation by mass was applied (Althaus et al 2004, Althaus & Classen 2005) (see Table S1, Elements in ores: Supporting Information, online only).
(4)
Ex°ch,j = exergy per kg elementary metal j (MJ/kg)
Ex°ch,o = exergy per kg ore (MJ/kg)
cj = mass fraction of metal j in ore (–)
a(r,m),j = allocation factor for metal j (–)
r = revenue allocation
m = mass allocation
The chemical exergy value for water from Szargut (2005) was attributed to freshwater. Seawater is a reference species and does not feature exergy. Further reference species are
the resources CO2, krypton, xenon in air, 'magnesium in
water' (Szargut, 2005). 'Lithium in brine' is considered as Lithium in seawater and therefore as a reference species (see Table S1: Supporting Information, online only). For the five minerals borax, colemanite, stibnite, ulexite, and zirconia, no accurate data was found. No exergy scores were calcu-lated for these minerals.
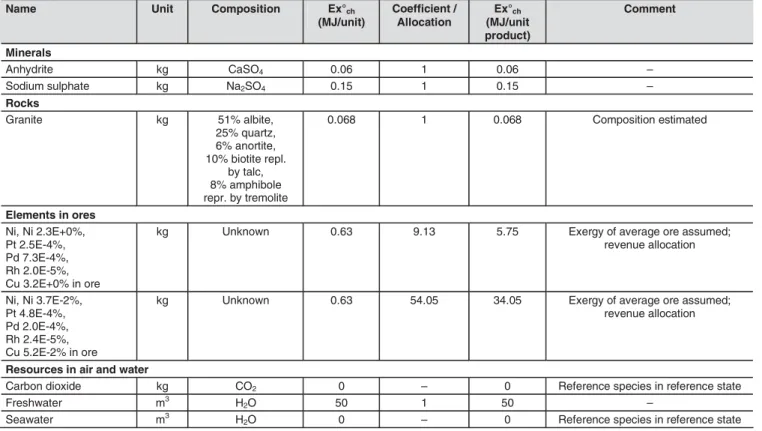
Table 1 presents key examples of the exergy scores for the resource types of minerals, rocks, ores and resources in air and water. The complete resource list and the references are provided in Table S1 (Supporting Information, online only).
1.3 Exergy of energy carriers
Energetic resources in ecoinvent database v1.2 are either ventoried by mass, volume or energy content. For those in-ventoried by mass or volume, the energetic content per mass or volume is additionally provided. The exergy content is cal-culated through applying an exergy to gross calorific value ra-tio as provided by Szargut (2005). Assumpra-tions are made for energy carriers where no ratio is provided (Table 2). The exergy to gross calorific value ratio for crude oil is estimated by the mean of the ratios for gasoline and lignite. The ratio for peat is estimated by the mean of the ratios for wood and lignite. Thermal exergy is represented by a carnot cycle to specify the obtainable work from a heat source (Szargut 2005) (Eq. 5):
Exth = Qh * (Th – Tc) / Th (5)
Exth: Thermal exergy (MJ)
Qh : Energy from heat source (MJ)
Th : Temperature of the heat source (K)
Tc : Temperature of the environment (K)
Extraction of thermal energy by air-water and brine-water heat pumps is considered in the corresponding datasets of ecoinvent data v1.2. In heat pumps, the temperature of the
heat source is in general rather low, well below the tempera-ture of the reference environment. Therefore no exergy is attributed to geothermal energy used in heat pumps. Kinetic exergy is equal to the kinetic energy, when the veloc-ity is considered relative to the surface of the earth (Szargut 2005). Similarly, potential exergy is equal to the potential en-ergy when it is evaluated with respect to the average level of the surface of the earth in the locality of the process under consideration (Szargut 2005). The energy of nuclear fuels is of very high quality because it intrinsically corresponds to a very high temperature. Hence, it can be assumed that the exergy of nuclear raw materials is equal to the energy that becomes available by nuclear fission (Szargut. 2005). Concerning ra-diative exergy, the ratio of the exergy flux to the total en-ergy flux is 0.9336 at the Earth's surface (Szargut 2005).
2 Results
2.1 Comparison of exergy factors to characterization factors from other methods
CExD is compared to CED (VDI 1997, Frischknecht et al. 2004), to the resource subcategories of EI'99 (Goedkoop et al.1999) and the CML'01 Method (Guinèe et al. 2001). The comparison is performed to identify differences in the rela-tive weighting of resources. The number of assessed resources varies considerably between CExD, CED, EI'99 and CML'01. CExD provides exergy factors for 112 resources, while CED, EI'99 and CML'01 assess 12, 34 and 81
re-Name Unit Composition Ex°ch
(MJ/unit) Coefficient / Allocation Ex°ch (MJ/unit product) Comment Minerals Anhydrite kg CaSO4 0.06 1 0.06 – Sodium sulphate kg Na2SO4 0.15 1 0.15 – Rocks Granite kg 51% albite, 25% quartz, 6% anortite, 10% biotite repl. by talc, 8% amphibole repr. by tremolite 0.068 1 0.068 Composition estimated Elements in ores Ni, Ni 2.3E+0%, Pt 2.5E-4%, Pd 7.3E-4%, Rh 2.0E-5%, Cu 3.2E+0% in ore
kg Unknown 0.63 9.13 5.75 Exergy of average ore assumed;
revenue allocation Ni, Ni 3.7E-2%, Pt 4.8E-4%, Pd 2.0E-4%, Rh 2.4E-5%, Cu 5.2E-2% in ore
kg Unknown 0.63 54.05 34.05 Exergy of average ore assumed;
revenue allocation
Resources in air and water
Carbon dioxide kg CO2 0 – 0 Reference species in reference state
Freshwater m3 H
2O 50 1 50 –
Seawater m3 H
2O 0 – 0 Reference species in reference state
Table 1: Assignation of exergy to the resource types of minerals, rocks, ores, and resources in air and water in the ecoinvent database v1.2 (key
examples). The complete resource list and the corresponding references for resource composition are provided in Table S1 (Supporting Information, online only)
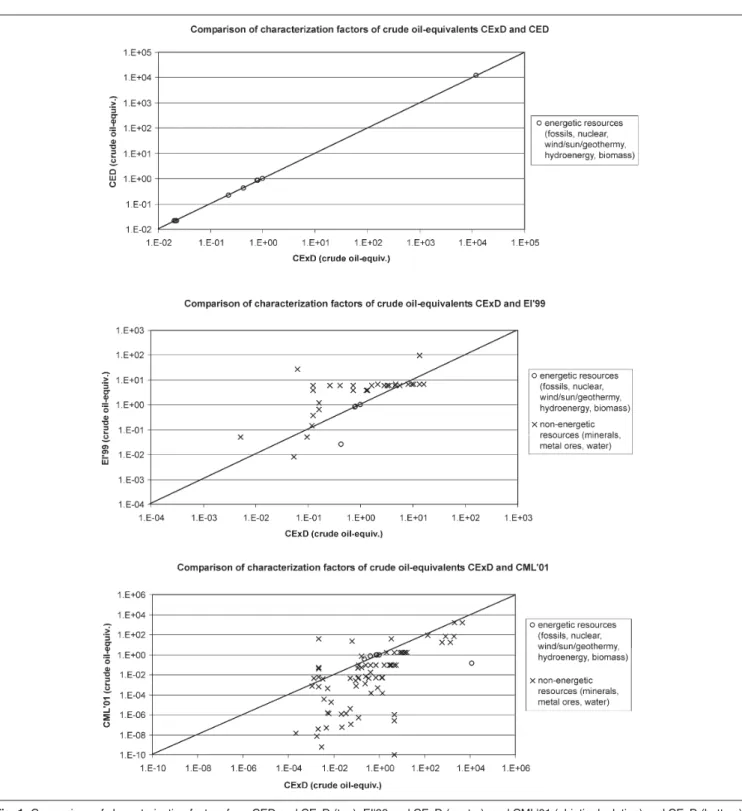
sources, respectively. CED is an energy demand indicator and therefore considers only energetic resources. EI'99 and CML'01 exclude water consumption and all renewable re-sources, since they do not consider them to be exhaustible. The characterization factors of each resource in CExD, CED, EI'99 (H,A) and CML'01 are presented in Fig. 1. All factors were transformed into the unit crude oil-equivalents, to en-able comparisons between the methods. The comparison between CExD and CED shows that the exergy and the en-ergy content are very similar in energetic resources (R2>0.99 if only energetic resources are considered). This is due to the fact that most energetic resources in the ecoinvent database v1.2 feature a high quality and thus an exergy to energy ratio close to one. However, CED differs from CExD in that it does not consider non-energetic resources. The compari-sons of CExD and EI'99 as well as between CExD and
CML'01 yield weak or no correlations (R2=0.2 and R2<0.1,
respectively). This may be explained by the fact that EI'99 and CML'01 do not base the characterization factors on energetic properties, but rather on the scarcity and dimin-ishing quality of global deposits. In Fig. 1 it can be observed that CML'01 tends to assign less weight to non-energetic resources than CExD. The EI'99 method does not show this bias. Some non-energetic resources are weighted stronger while others are weighted weaker than energetic resources in comparison to CExD. It can also be seen that the resources with the highest factors in CExD are not considered by the EI'99 methods. These factors refer to resources such as ura-nium, rhodium, platinum, and palladium.
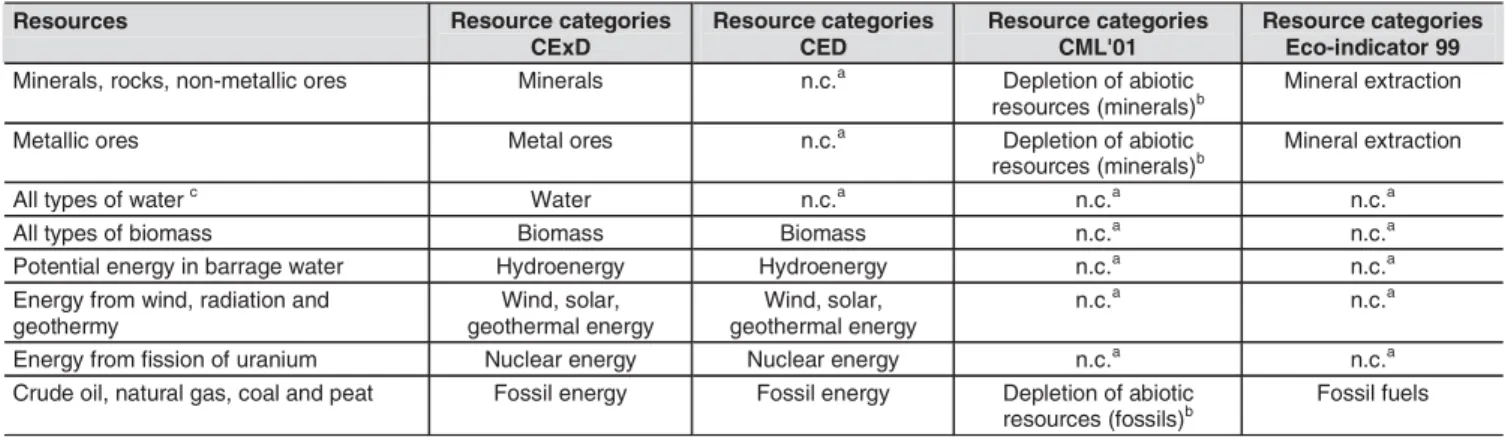
Table 3 gives a guideline, which of the resource categories are comparable in the four methods considered. CExD dif-ferentiates between exergy from minerals, metal ores,
wa-Table 2: Exergy of energy carriers in the ecoinvent database v1.2 Name ecoinvent Name datasource
exergy
Specification Unit Gross calorific value (MJ/unit) a rex-e (Ratio) b Ex° (MJ/unit)
Coal, brown, in ground lignite average fuel kg 9.9 1.04 10.3
Coal, hard, unspecified, in ground bitominous coal average fuel kg 19.1 1.03 19.7 Gas, mine, off-gas, process,
coal mining
natural gas average fuel kg 39.8 0.94 37.4
Gas, natural, in ground natural gas average fuel m3 38.3 0.94 36.0
Oil, crude, in ground – avg. of gasoline and lignite kg 45.8 1.02 46.5
Peat, in ground – avg. of wood and lignite kg 9.9 1.05 10.3
Uranium nuclear – kg 560,000 1.00 560,000
Wood, hard, standing wood – m3 12,740 1.05 13,364
Wood, soft, standing wood – m3 9,180 1.05 9,629
Wood, unspecified, standing wood – m3 10,960 1.05 11,497
Energy, geothermal carnot cycle – MJ 1 – 0
Energy, gross calorific value, in biomass
wood average fuel MJ 1 1.05 1.05
Energy, kinetic, flow, in wind kinetic exergy velocity relative to surface MJ 1 1.00 1.00 Energy, potential, stock,
in barrage water
potential exergy height relative to surface MJ 1 1.00 1.00
Energy, solar radiative exergy – MJ 1 0.93 0.93
a Gross calorific values from Frischknecht et al. 2004;bExergy to energy from Szargut (2005)
Resources Resource categories CExD Resource categories CED Resource categories CML'01 Resource categories Eco-indicator 99
Minerals, rocks, non-metallic ores Minerals n.c.a Depletion of abiotic resources (minerals)b
Mineral extraction
Metallic ores Metal ores n.c.a Depletion of abiotic
resources (minerals)b
Mineral extraction
All types of water c Water n.c.a n.c.a n.c.a
All types of biomass Biomass Biomass n.c.a n.c.a
Potential energy in barrage water Hydroenergy Hydroenergy n.c.a n.c.a
Energy from wind, radiation and geothermy Wind, solar, geothermal energy Wind, solar, geothermal energy n.c.a n.c.a
Energy from fission of uranium Nuclear energy Nuclear energy n.c.a n.c.a
Crude oil, natural gas, coal and peat Fossil energy Fossil energy Depletion of abiotic resources (fossils)b
Fossil fuels
a Not considered b
In the original literature (Guinèe et al. 2001) there is one category for abiotic resources. Here a further subdivision was made into minerals and fossils, in order to compare the contribution of different types of resources of the various methods in Fig. 2 to 5
c Excluding water turbined in hydroelectric power plants
Table 3: Resource categories in CExD, corresponding categories of CED, and resource depletion categories in CML'01 Guinée & Heijungs 1995) and
Fig. 1: Comparison of characterization factors from CED and CExD (top), EI'99 and CExD (center), and CML'01 (abiotic depletion) and CExD (bottom).
All values were transformed to crude oil-equivalents to assure the comparability of data. Logarithmic scales. The line indicates equality of raw oil equiva-lents for both methods
ter, biomass, hydroenergy, wind/solar/geothermal energy, nuclear energy and fossil energy. Although metal ores are composed of minerals, a separation between exergy from minerals and from metal ores is made in CExD. This differ-entiation allows identifying the exergy demand due to metal extraction. CED considers the energy demand from renew-able and nonrenewrenew-able energy carriers. Eco-indicator 99 includes the resource categories 'extraction of minerals' and
the category 'extraction of fossil fuels'. CML'01 only fea-tures one resource category for abiotic depletion compris-ing minerals and mineral aggregates, fossil fuels and resources in air and water. In this study, we differentiate between the CML'01 resources of fossil fuels and non-energetic resources to facilitate a more detailed comparison of resource valua-tion between CExD and CML'01.
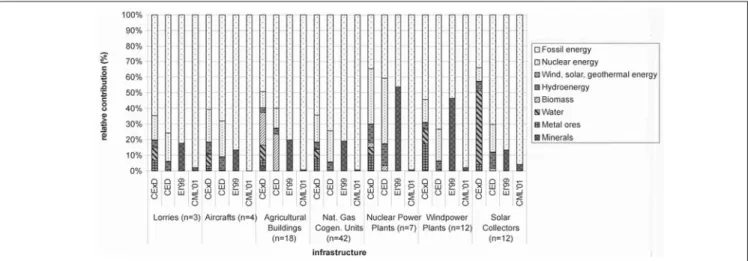
The contribution of each resource category to the total indicator score of 2630 products, processes, and infra-structure units from the ecoinvent database (ecoinvent Centre 2005, Frischknecht et al. 2005) is compared be-tween the four indicators. From this sample, we formed 26 rather homogeneous product/process groups,
contain-ing in total 1197 processes, which represent energy pro-duction, material propro-duction, transport, waste treatment and infrastructures (an overview of the groups is presented in Table S2: Supporting Information, online only). For the sake of clarity in presentation, all scores are normalised to 100% (Figs. 2–5).
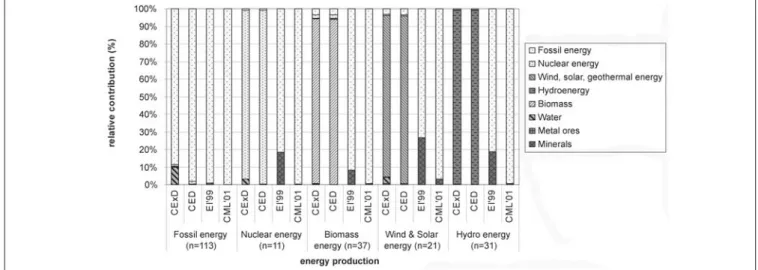
Fig. 2: Relative contribution of resource categories to CExD, CED, Eco-indicator 99 and CML'01 in energy production; n=number of processes
Fig. 3: Relative contribution of resource categories to CExD, CED, Eco-indicator 99 and CML'01 in material production; n=number of products
2.2 CExD applied to ecoinvent data and compared to other methods
The results of Figs. 2–5 show that CExD is similar to CED in processes that are dominated by energy consumption. Prominent differences though are observable in processes and products in which minerals, metals and water consump-tion are significant. With respect to CML'01, it can be seen that non-fossil resources are consistently of more importance when CExD is applied. With regard to EI'99 the picture is somewhat different. For some product groups, e.g. most materials except for the metals, CExD assigns more relative weight to the mineral and water resources than EI'99. How-ever, the opposite can be observed for other product groups, e.g. for non-fossil energy generation.
The comparison to CED, EI'99 and CML'01 shows that CExD provides a more differentiated picture of resource use due to a higher resolution of subcategories (see Table 3) and the integration of 112 resources in the indicator. CED only regards energy demand and thus neglects all non-energetic resources. EI'99 and CML'01 do not regard renewable en-ergies and water consumption. In CML'01, the depletion of fossil energies is dominant over minerals in most processes. The CExD results show in energy generation processes as well as in service processes like transport, that cumulative exergy demand is dominated by the consumption of ener-getic resources. In material production this is not always the case since the raw materials themselves and water use may contain a significant portion of exergy. This is especially true for metals, where the exergy from metal ores makes up a significant share of almost 40%. For waste-treatment pro-cesses, energetic resources account for 79% to 92% of total exergy demand, while exergy from water use and mineral resources make up for the rest. CExD in infrastructure is dominated by energetic resources, but also metals (between 3 and 17%) and water consumption (between 5 and 47%) show significant contributions.
The standard deviation of resource category contribution to total CExD was calculated within specific product and pro-cess groups (see Table S2: Supporting Information, online only). The values are expressed in percentages to illustrate the deviation from the relative average contributions.
For some product groups, the dominance of energetic re-sources is uniform throughout the product group (e.g. nuclear energy and hydro energy production). For others though, such as metal products, chemicals and building materials, non-energetic resources may be significantly more impor-tant for single products than shown in Fig. 3.
3 Discussion
According to the second law of thermodynamics, the use of energetic and non-energetic resources in closed systems in-trinsically causes the destruction of exergy. The used re-sources are only transformed but not destroyed and may be recovered by the consumption of exergy from other resources (within the present technical range of possibilities) (Finnveden et al. 1997). Thus, one may consider exergy destruction to be one of the major problems related to resource demand. The indicator Cumulative Exergy Demand accounts for the exergy of resources that are removed from nature and thus are not accessible anymore for future exploitation.
While exergy demand acts as a valuable indicator for the destruction of energy quality, the restriction to the energetic quality of resources has limitations towards a holistic valu-ation of resource quality. Further aspects of resource quality like societal demand (1 litre of clean, potable water resources, and thus its protection, might be of higher concern in arid regions as compared to 1kg of platinum in an ore) or techni-cal availability and scarcity (low exergy but scarce resources might be of higher concern as compared to high exergy but abundant resources when neither a resource substitute nor a conversion technology is at hand) are not considered. Nev-ertheless, just like CED, CExD addresses the use of a scarce resource, useful energy, and is therefore believed to be a good indicator for resource quality demand.
CExD may be compared to CED, both being indicators of life-cycle energy demand. CED is used to assess the energy demand of primary energy sources. The quality of energy is not taken into account. Heat from the ground as extracted by heat pumps features a low energetic quality, since the temperature difference between the heat source and the en-vironment is small. Fission reactions at the other extreme take place at very high temperatures and therefore feature a
Fig. 5: Relative contribution of resource categories to CExD, CED, Eco-indicator 99 and CML'01 in infrastructure units. Infrastructure units comprise
high energetic quality. CExD takes this discrepancy in the quality of energy into account. Furthermore, CExD accounts for the exergy captured in non-energetically used materials. Therefore, CExD can be regarded as a more comprehensive energy-based resource demand indicator than CED. Further resource depletion indicators used in LCA aim at as-sessing resource scarcity. The number of considered resources is limited in these indicators. Firstly, not all resources are con-sidered exhaustible or scarce by the indicators, and secondly, information on global resource scarcity of specific resources is difficult to obtain. The CML'01 method (Guinèe et al. 2001) focuses on the global scarcity of the resources, while EI'99 as-sesses the surplus energy to recover the resource in the future. An advantage of CExD in contrast to Eco-indicator 99 and CML'01 is that fewer assumptions are needed. In CML'01 and EI'99, many assumptions were made in the modeling of global scarcity and surplus energy demand. In EI'99, for instance, in the concentrations of metal resources were estimated using uncertain geostatic models and a subjective choice was made on the reference point of time in the future, to which current concentrations are compared. CExD does not need such as-sumptions, as exergy is an inherent property of the resource. The main source of uncertainty is the (sometimes unknown) composition of mineral resources, such as rocks and ores. The technical uncertainty varies between different resources such as minerals, rocks and ores. This is due to the fact that the composition of various resources may vary considerably even on small geographical scales and cannot therefore be defined precisely. The uncertainty is largest for rocks and ores, as they do not feature an exactly specified mineral composi-tion. Different classifications exist for rocks, and the denomi-nation only refers to the formation process and the predomi-nant compounds. Discrepancy in the exergy values may be considerable when the rock contains an unspecified amount of sulphurous minerals or of pure graphite, since these com-pounds feature high exergy values. The same concern applies for ores, where information on the composition is even scarcer, since the ores cannot be specified with the available data. For minerals, the elemental composition is defined and exergy cal-culations can be performed exactly, provided the standard Gibbs free energy of formation and the according reference species are available. The main source of uncertainty for min-erals stems from the background geochemical and thermo-chemical data used. Just before the submission of the revised version of this paper, De Meester et al. (2006) published up-dated exergy values of minerals using the most recent geochemi-cal and thermochemial databases. This update improves the method, and should therefore be considered in future work. We refrained from taking the exergy values from Finnveden et al. (1997) for specific ores in order not to arbitrarily bias the valuation of the ores recorded in the ecoinvent database. As mentioned above, although the exergy values of Finnveden et al. (1997) apply for the ores in the particular study, the results are not directly transferable to ores from other locations with-out specific petrologic analyses. The mineral composition of an ore cannot be determined solely on the basis of the con-taining metals. The energetic values of the energy carriers are provided in ecoinvent report No. 3 (Frischknecht et al. 2004). These values should be considered average values. The exergy to gross calorific value ratios base on average fuels as defined
by Szargut (2005). Both the energetic value and the exergy to energy ratio may vary in resources due to variations in the chemical composition. For instance, the calorific value of raw carbon varies from less than 16 to more than 20 MJ/kg de-pending on the geographical location of the mine (Röder et al. 2004)). An estimation of the extent of variation in the exergetic content of resources is provided in Table S3 (Supporting In-formation, online only). The minimum and maximum values in Table S3 may be used for sensitivity analysis.
In comparison to the other methods considered here, CExD provides a more differentiated and complete picture of the removal of resources from nature, due to the higher resolu-tion of resource categories (see Table 3) and the larger num-ber of resources considered. CExD covers more resources than the other methods, because exergy values can easily be calculated for all resources with known composition. There-fore and in contrast to the other methods, no resources had to be neglected in the assessment. For some energy-inten-sive processes, for example transport processes, the result of CExD is very similar to CED. In these cases, CExD does not provide additional information and it may be sufficient to apply the (less comprehensive) CED. However, for other products this is not the case, as some of the additionally considered resources, such as water and minerals, may be relevant from a resource quality perspective.
It is debatable whether or not to aggregate the exergy of all resource types into a single score. In the current work we chose to define several categories, as there are differences among the various types of resources. First, exergy in en-ergy carriers is destroyed while exen-ergy in material is, in many cases, only removed from nature. It might be recovered at the end of the product life-cycle given appropriate waste-treatment technologies. Other arguments against a full ag-gregation are similar to the arguments whether or not to aggregate CED to a single score. For instance, the exergy in renewable energy sources is an input from outside the earth system (provided by the solar irradiation) and thus of com-pletely different quality as compared to exergy extracted from the ground, i.e. within the earth system. While the former allows for an increase in exergy on earth, the latter must lead to a decrease in exergy. Furthermore, the consumption of solar energy is differently accounted for in technical sys-tems like solar panels, hydroelectric power plants, wind power plants and in biomass, which may create a bias in the valuation of these resources (Frischknecht et al. 2004). Al-though we looked at the aggregated results (see Figs. 2 to 5) in this paper to identify the relative differences among the methods, it is highly recommended to refrain from aggre-gating renewable and non renewable exergy use, because of the different nature of the resources (see Frischknecht et al. (1998) and Frischknecht et al (2004) for a detailed discus-sion in the context of CED). In product life cycle assess-ments and comparative assertions, the selection and (even-tual) aggregation of particular resource type CExD values should be done consciously and with great care.
The results of the aggregated ecoinvent processes (see Figs. 2 to 5) illustrate that in energy generation, transport and waste treatment, exergy from energetic resources is dominating. However, with regard to various material production processes and infrastructure, the materials feature a substantial amount
of exergy. In particular in comparison to the CML'01 results, the use of non-energetic resources is more strongly weighted by CExD. Moreover, water use is considered and is, in some cases, relevant. We consider this to be an advantage of the CExD cept, as the consumption and scarcity of water is a major con-cern in some countries and particularly in arid regions, which is so far not reflected by the conventional methods. It should be noted, however, that in the future there may be other methods that will assess water use more appropriately in the future, e.g. taking into consideration the local availability of clean water.
4 Conclusions and Recommendations
We conclude that CExD is a valuable indicator to assess energy and resource demand from the perspective of ener-getic quality. It is a more comprehensive indicator than CED due to the assessment of the quality of energy and the inte-gration of non-energetic resources, but is simpler in the set-ting up as compared to the resource category of EI'99. There-fore, we think it is useful for the LCA community to enable the use of CExD indicators by integrating the exergy char-acterization factors in inventory databases such as the ecoinvent database. In addition, making the large body of inventory data from LCA available to communities outside the LCA framework may be of great usefulness, as exergy data is currently not nearly as readily available as LCI data.
References
Akiyama T, Sato H, Muramatsu A (1993): Feasibility study on blast furnace ironmaking system integrated with methanol synthesis for reduction of carbon dioxide emission and effective use of energy. Iron and Steel Insti-tute Journal 33 (11) 1136–1143
Althaus HJ, Classen M, Blaser S, Jungbluth N (2004): Metals. Final report ecoinvent 2000 No. 10, Swiss centre for Life Cycle Inventories, Dübendorf, Switzerland
Althaus HJ, Classen M (2005): Life Cycle Inventories of Metals and Meth-odological Aspects of Inventorying Material Resources in ecoinvent. Int J Life Cycle Ass 10 (1) 43–49
Atkins PW (2001): Physical Chemistry, 7th edition. Oxford University Press, Oxford
Classen M, EMPA Dübendorf: Personal communication via email, 21–23 March 2006
De Meester B, DeWulf J, Janssens A, Van Langenhove H (2006): An Im-proved Calculation of the Exergy of Natural Resources for Exergetic Life Cycle Assessment. Environ Sci & Technol (in press)
Dewulf J, Van Langenhove H (2000a): Exergy analysis in the assessment of the sustainability of waste gas treatment systems. The Science of the To-tal Environment 273, 41–52
Dewulf J, Van Langenhove H, Mulder J, van den Berg MMD, van der Kooi HJ, de Swaan Arons J (2000b): Illustrations towards quantifying the sustainability of technology. Green Chemistry 2, 108–114
Dewulf, J, Van Langenhove H (2002a): Quantitative Assessment of solid waste treatment systems in the industrial ecology perspective by exergy analysis. Environ Sci Technology 36, 1130–1135
Dewulf J, Van Langenhove H (2002b): Assessment of the sustainability of technology by means of a thermodynamically based life cycle analysis. Environ Sci Pollut Res 9 (4) 267–273
Dewulf J, Van Langenhove H (2004): Thermodynamic optimization of the life cycle of plastics by exergy analysis. Int J Energy Res 28, 969–976 Dicalite (2005): <http://www.dicalite-europe.com/chemrock-perlite.htm>
accessed on 3 April 2006
ecoinvent Centre (2005): ecoinvent data v1.2. Final reports ecoinvent 2000, No. 1–15. Swiss centre for Life Cycle Inventories, Dübendorf, 2004, CD-ROM Faist Emmenegger M, Heck T, Jungbluth N (2003): Erdgas. In: Dones R et
al. (eds), Sachbilanzen von Energiesystemen: Grundlagen für den ökolo-gischen Vergleich von Energiesystemen und den Einbezug von Ener-giesystemen in Ökobilanzen für die Schweiz. Final report ecoinvent 2000 No. 6-V, Paul Scherrer Institut Villigen, Swiss Centre for Life Cycle In-ventories, Dübendorf, Switzerland
Fentaw HM, Mohammed S, Sebhat N, Gauntneb H (2000): The moyale graphite deposit, southern Ethiopia. NGU-Bull 436, 169–173
Ferrel R (2005): Luisianna State University, <http://www.geol.lsu.edu/Fac-ulty/Ferrell/HomePage/Liesl/sld020.htm>, accessed on 3 April 2006 Finnveden G, Östlund P (1997): Exergies of natural resources in life-cycle
assessment and other applications. Energy 22 (9) 923–931
Frank W (1956): Österreichische Energiebilanz für das Jahr 1956. Kom-misionsverlag der Österreichischen Staatsdruckerei, Vienna, Austria Frischknecht R, Heijungs R, Hofstetter P (1998): Einstein's lesson on energy
accounting in LCA. Int J Life Cycle Ass 3 (5) 266–272
Frischknecht R, Jungbluth N, Althaus HJ, Doka G, Dones R, Hischier R, Hellweg S, Humbert S, Margni M, Nemecek T, Spielmann M (2004): Implementa-tion of Life Cycle Impact Assessment Methods. Final report ecoinvent 2000 No. 3, Swiss centre for Life Cycle Inventories, Dübendorf, Switzerland Frischknecht R, Jungbluth N, Althaus HJ, Doka G, Dones R, Heck T, Hellweg
S, Hischier R, Nemecek T, Rebitzer G, Spielmann M (2005): The ecoinvent Database: Overview and Methodological. Int J Life Cycle Ass 10 (1) 3–9 Geskin ES (1988): In Metallurgical processes for the year 2000 and beyond. Proceedings of the international symposium on metallurgical processes for the year 2000. Sohn HY, Geskin ES (eds), The Minerals, Metals and Materials Society (TMS), Warrendale, PA, USA
Goedkoop M, Spriensma R (1999): The Eco-indicator 99: A damage ori-ented method for life-cycle impact assessment. Pré Consultants, Amers-foort, The Netherlands
Guinée JB, Heijungs R (1995): A proposal for the definition of resource equivalency factors for the use in product Life-Cycle Assessment. Environ Toxicol Chem 14 (5) 917–925
Guinèe JB, Gorée M, Heijungs R, Huppes G, Kleijn R, de Koning A, van Oers L, Wegener Sleeswijk A, Suh S, Udo de Haes HA, de Bruin H, van Duin R, Huijbregts MAJ, Lindeijer E, Roorda AAH, Weidma BP (2001): Life cycle assessment: An operational guide to the ISO standards: Char-acterization and normalization factors. Final report
Jungbluth N (2004): Erdöl. In: Dones R (ed), Sachbilanzen von Energie-systemen: Grundlagen für den ökologischen Vergleich von Energiesystemen und den Einbezug von Energiesystemen in Ökobilanzen für die Schweiz. Final report ecoinvent 2000 Nr. 6-IV, Paul Scherrer Institut Villigen, Swiss Centre for Life Cycle Inventories, Dübendorf, Switzerland
Kellenberger D, Althaus HJ, Künniger T, Jungbluth N (2004): Building Prod-ucts. Final report ecoinvent 2000 No. 7, Swiss centre for Life Cycle In-ventories, Dübendorf, Switzerland
Kennedy BA (ed) (1990): Surface Mining, 2nd Edition. Society for Mining, Metallurgy, and Exploration, Inc. Littleton, Colorado, USA
Lichtensteiger T, EAWAG Dübendorf: Personal communication and email, 24.3.2006
NRCAN (2005): Cobalt, <http://www.nrcan.gc.ca/mms/canmet-mtb/mmsl-lmsm/ccrmp/certificates/su-1a.htm>, accessed on 5 April 2006 Ozdogan S, Arikol M (1995): Energy and exergy analysis of selected Turkish
industries. Energy 20 (1) 73–80
Rhenium Alloys Inc. (2006): <http://www.rhenium.com/what.asp?menu_ id=4&pic_id=1>, accessed on 5 April 2006
Ritthoff M, Rohn H, Liedtke C (2002): MIPS berechnen. Wuppertal Institut für Klima, Umwelt, Energie GmbH im Wissenschaftszentrum NRW, Germany Röder A, Bauer C, Dones R (2004): Kohle. In: Dones R et al. (ed),
Sachbilanzen von Energiesystemen: Grundlagen für den ökologischen Vergleich von Energiesystemen und den Einbezug von Energiesystemen in Ökobilanzen für die Schweiz. Final report ecoinvent 2000 No. 6-VI, Paul Scherrer Institut Villigen, Swiss centre for Life Cycle Inventories, Dübendorf, Switzerland
Schaeffer R, Wirtshafter RM (1992): An exergy analysis of the Brasilian economy – From energy production to final energy use. Energy 17 (9) 841–855 Shigaki N, Akiyama T, Tsukihashi F (2002): Exergy analysis of steel
produc-tion processes. Materials Transacproduc-tions 43 (3) 379–384
Szargut J (2005): Exergy method: Technical and ecological applications. WIT Press, Southampton
Szargut J, Morris DR, Steward FR (1988): Exergy analysis of thermal, chemical, and metallurgical processes. Hemisphere Publishing Corporation, New York USGS (2002): US Geological Survey, REE Ce, La, Nd: <http://pubs.usgs.gov/
fs/2002/fs087-02/>, accessed on 5 April 2006
VDI (1997): Cumulative Energy Demand – Terms, Definitions, Methods of Calculation. In: VDI-Richtlinien 4600, Verein Deutscher Ingenieure, Düsseldorf, Germany
Wall G (1990): Exergy conversion in the Japanese society. Energy 15 (5) 435–444
Wall G (1993): Exergy, Ecology and Democracy – Concepts of a Vital Soci-ety or A Proposal for an Exergy Tax. Presented at ENSEC'93, Interna-tional Conference on Energy Systems and Ecology, July 5–9, Krakow, Poland. Publ. Proc., Szargut et al. (eds), pp 111–121, <http://exergy.se/ goran/eed/index.html>
Wall G, Sciubba E, Naso V (1994): Energy use in the Italian society. Energy 19 (12) 1267–1274
Received: July 5th, 2006 Accepted: November 14th, 2006