Paying smallholders not to cut down the Amazon forest:
Impact evaluation of a REDD+ pilot project
*
Gabriela Simonet
†Julie Subervie
‡Driss Ezzine-de-Blas
§Marina Cromberg
¶Amy Duchelle
||*The data used in this article were collected by the Center for International Forestry Research (CIFOR). This
re-search is part of CIFOR’s Global Comparative Study on REDD+ (www.cifor.org/gcs). The funding partners that have supported this research include the Norwegian Agency for Development Cooperation (NORAD), the International Climate Initiative (IKI) of the German Federal Ministry for the Environment, Nature Conservation, Building and Nuclear Safety (BMUB), and the CGIAR Research Program on Forests, Trees and Agroforestry (CRP-FTA) which is financially supported by the donors to the CGIAR Fund. We thank the men and women of the Transamazon for their hospitality and for sharing their time and perceptions, and IPAM’s team for sharing their REDD+ project in-formation with us. We are also grateful to the members of our field team for their outstanding collaboration. We thank Astrid Bos (Wageningen University), Sylvain Chabé-Ferret (INRA-TSE), Nicolas Fauvet (CIRAD), Valéry Gond (CIRAD), Gwenolé Le Velly (SupAgro-LAMETA), Eduardo Marinho (CIFOR), Alexandre Sauquet (INRA-LAMETA), Raphael Soubeyran (INRA-LAMETA), Isabelle Tritsch (IRD), and audiences at a number of seminars for useful com-ments. We especially thank the editor, Kelsey Jack, and two anonymous referees for their outstanding comments and suggestions. All remaining errors are obviously our own.
†Chaire Economie du Climat (Paris-Dauphine) and Centre international de cooperation en recherche
agronomique pour le developpement (CIRAD) UR Biens et Services des Ecosystemes Forestiers tropicaux (B&SEF), Campus International de Baillarguet, TA C-105/D, Montpellier 34398, Cedex 5 France; corresponding author: e-mail: [email protected], phone: 0033467593778.
‡INRA, the French Institute for Research in Agriculture, UMR 1135 LAMETA, Montpellier, France.
§Centre international de cooperation en recherche agronomique pour le developpement (CIRAD) UR Biens et
Services des Ecosystemes Forestiers tropicaux (B&SEF) Campus International de Baillarguet, TA C-105/D, Montpel-lier 34398, Cedex 5 France.
¶Center for International Forestry Research (CIFOR),Jalan CIFOR, Situ Gede, Sindang Barang Bogor (Barat) 16115
Indonesia.
||Center for International Forestry Research (CIFOR),Jalan CIFOR, Situ Gede, Sindang Barang Bogor (Barat) 16115
Indonesia.
1. Introduction
Tropical deforestation and degradation play an important role in anthropic emissions of carbon dioxide (CO2), with an annual emission rate estimated at 7-14 percent of global CO2 emissions [19, 17]. Among forested countries worldwide, Brazil has been one of the main sources of global tree cover loss [18]. For many years now, programs and policies designed to reduce tropical deforestation have featured highly on the political agenda. Afforestation and reforestation projects were included in the Clean Development Mechanism of the Kyoto Protocol signed in 1997 and a mechanism aimed at Reducing Emissions from Deforestation, known as RED, was established during the 11th Conference of the Parties of Montreal in 2005.1In Brazil, the implementation of command-and-control measures, the expansion of protected areas, and interventions in the soy and beef supply chains, such as the Soy Moratorium established in 2006, have significantly curbed deforestation in the Amazon in recent years. Between 2005 and 2013, the annual deforestation rate in Brazil fell by 70 percent [28]. Early access to satellite imagery, made possible by the Brazilian government’s historical interest in space technologies, has been key to this success by improving the government’s capacity to monitor forest cover.2
Despite this overall improvement, however, deforestation rates have continued at 5,000-7,000 km2year−1since 2009 [16] and increased in 2015-2016.3 Furthermore, the reduction in deforestation achieved prior to 2009 can mainly be attributed to large farms, as evidence shows that small farms had a limited role in the improvements recorded during this period [16]. After a decade of command-and-control regulation, it is often argued in the literature that new mechanisms targeting small landowners are required in order to achieve further reductions in deforestation in the Amazon (see Borner et al. [8], Godar et al. [16], Gebara and Thault [15], Ezzine-de-Blas et al. [13], Chhatre and Agrawal [10] among others). In this context, offering Payments for Environmental Services (PES) has emerged as a potential strategy to achieve both equity and conservation goals.
A question of primary importance is therefore: to what extent can a PES program contribute to avoided defor-estation? There are a variety of reasons why voluntary programs like PES may not be effective in curbing deforesta-tion rates. Firstly, farmers who face the lowest costs for decreasing deforestadeforesta-tion are the most likely to enter such a program. As a result, the program may end up paying some farmers for doing nothing differently from what they would have done in the absence of any payment. In this case, the impact of the program may be quite small. Sec-ondly, the impact of the program, if there is any, may be entirely offset by negative within-community spillovers
1The core idea of the RED mechanism was to offer financial rewards to developing countries in exchange for emissions reductions achieved
through decreased deforestation. This mechanism was later expanded to include provisions addressing forest degradation, along with conser-vation, the sustainable management of forests, and the enhancement of forest carbon stocks. This expanded strategy was renamed REDD+. As of 2014, there were more than 300 REDD+ subnational projects around the world [40].
2In 2004, Brazil began implementing a federal Plan for the Protection and Control of Deforestation in the Amazon based on three pillars: (i)
Tenure regularization; (ii) Environmental monitoring, control, and enforcement; and (iii) Incentives for sustainable production. The second pillar, enforced via a satellite-based monitoring system that enables the identification of deforestation hot spots, was the first to be imple-mented.
(or leakage). Negative within-community spillovers occur when the program happens to increase deforestation among non-participants through market equilibrium effects such as a change in the demand for cattle products, or when a forest-owner shifts all planned deforestation activities from a PES-enrolled plot to a non PES-enrolled plot. In the most extreme cases, for example if some landowners use all PES payments to buy chainsaws to clear more forest for cattle pasture, negative spillovers may well exceed the positive impacts of the program [49].
In this article, we evaluate the effectiveness of an early PES-based REDD+ project launched, in an area that has come to be considered the quintessential example of deforestation - the Brazilian Amazon.4. Since 2012, this REDD+ project, called Projeto Assentamentos Sustentáveis na Amazônia (PAS), has offered a PES scheme combined with free administrative and technical support to 350 smallholders to reduce deforestation rates in several communities in the state of Pará. We estimate the impact on participants, along with within-community spillovers, and use these estimates to perform a cost-benefit analysis of the project.
We collected data from a representative sample of 181 small landowners in four intervention communities and four comparison communities (where the project was not offered) in 2010 and 2014. The main concern when eval-uating the impact of this project arises from the fact that intervention communities were not randomly selected, and that the participants in intervention communities self-selected into the project given its voluntary nature. To deal with this issue, we use the difference-in-difference (DID) and DID-matching approaches, as defined in Heck-man et al. [21] and HeckHeck-man et al. [20], and find evidence supporting the parallel trend assumption. Looking at all eligible forest owners who were invited to participate in the project, we first show that the impact is significant at the community-level. Thereafter, we estimate the impact of the project on participants and show that they de-voted an average of 66 percent of their land to forest in 2014, while they would have dede-voted 61 percent without the project. Given that average land area is 79 hectares, this means that an average of approximately 4 hectares of forest were conserved by each participating farm compared to the counterfactual scenario with no PAS project.
Although the respondents’ statements about land use indicate that the forest cover continues to decline in both participant and control groups after 2010, we highlight a clear break in the trend of deforestation rates among participants, which we attribute to the project. After 2010, the deforestation rate5among participants decreases to 1.8 percent per year, which means that the project, which includes PES as well as free administrative and technical support, led to an approximate decrease of 50 percent in the average deforestation rate. We moreover show that this decrease in deforestation occurs at the expense of pastures versus croplands. We find no evidence of
within-4Like many field experiments and empirical case studies, the generalizability of our results may be limited, notably because we focus on
a project that offers PES in a context of command-and-control regulations. This makes it different from most of the PES programs that were implemented in other developing countries, albeit we focus on an area where the law was weakly enforced, as we show in what follows.
5In this article, the annual deforestation rate is calculated using the definition employed by the Food and Agriculture Organization of the
United Nations and identified by Puyravaud [31] as the most commonly used definition in the literature : q = − ·³ A1 A2 ´ 1 t1−t2−1¸, where A 1and
community spillovers.
Finally, we use our estimate of the impact on participants, the “Social Cost of Carbon” and an estimation of the total costs of the project to perform a cost-benefit analysis of the project. We develop four case scenarios and show that, even in the more pessimistic one, which assumes that the participants will catch up on all their delayed deforestation immediately after the project ends, the cost-benefit ratio remains lower than one.
The use of PES to prevent the deforestation and degradation of forest lands is not new,6but there have been few rigorous evaluations of such PES programs so far (see Pattanayak et al. [29] and Alix-Garcia and Wolff [3] for a review of the literature). Most of these works are quasi-experimental analyses that have been conducted in Costa Rica [32, 6] and Mexico [4, 5, 11, 41]. Overall, their results suggest that the positive environmental impact of PES is significant but modest.7Recently, Jayachandran et al. [25] performed a randomised-controlled trial to assess the impact of a PES program in western Uganda that offers forest-owning households cash payments in exchange for forest conservation. This study provides an assessment of the cost-effectiveness of the program in terms of averted carbon dioxide emissions. Examining the worst-case scenario, which assumes that program effects are undone immediately after the program ends, the authors estimate a cost-benefit ratio of 1.5 (while this ratio remains lower than one in our study).
Our contribution is fourfold. First, we focus on a PES scheme implemented in a country characterized by the highest annual loss of forest in the world, amounting to 984,000 hectares of forest per year over the 2010-2015 period according to FAO (2015). This represents a unique contribution given that other PES-based programs eval-uated to date have been implemented in areas characterized by lower annual losses of forest, such as Uganda (where 135,200 hectares of forest were lost per year over the same period) or Mexico (91,600 hectares per year).8 This PES scheme is, moreover, part of a REDD+ pilot project. Although REDD+ has been recognized in the Paris Agreement as a key component of a concerted international strategy to mitigate climate change, robust quantita-tive impact evaluations of REDD+ projects are still missing. This paper aims to fill this gap. Second, we estimate not only the additionality and leakage effects of the program, but also the mechanisms through which program participants have been able to reduce their deforestation activity. Third, we provide a comprehensive cost-benefit analysis based on our estimation of the additional effects resulting from the program, the costs of the program, as well as hypothetical scenarios regarding the projected evolution of deforestation rates after the program ends. Fourth, we use the best identification strategy possible (DID-matching) given the sampling constraints we faced, as the proponent of the project sought to maximize program participation by targeting communities with whom
6Mexico, Costa Rica, and Ecuador have already established systems in which payments are made in exchange for avoiding deforestation. 7Results from these studies are not readily comparable because initial deforestation levels vary across countries and the environmental
outcomes are expressed in different units.
8In Costa Rica, where the first ever PES for forest conservation was implemented, the area of forestland actually increased over the 2010-2015
it had already established a trustworthy relationship through past work. We moreover provide supplementary analyses (parallel trends, a placebo test, and a sensibility test) that support our choice of identification strategy [? ].
The remainder of the article is structured as follows. Section 2 presents the context and the project under study, Section 3 our data collection process, and Section 4 our estimation methodology. The main results are presented in Section 5. Section 6 compares the costs and benefits of the project under various scenarios and Section 7 presents concluding remarks.
2. Context and PAS project
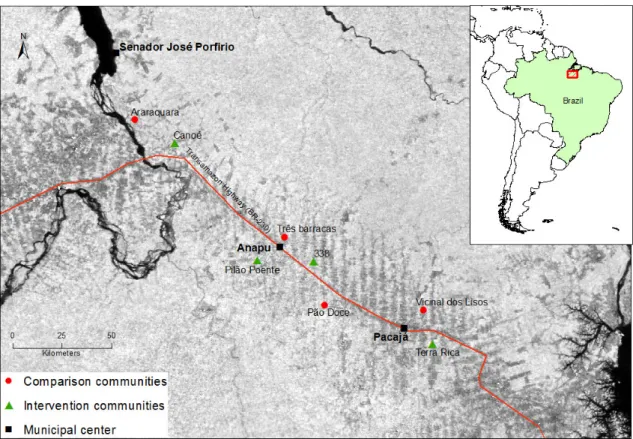
The PAS project is implemented by a Brazilian Non-Governmental Organization (NGO), the Amazon Environ-mental Research Institute (IPAM), which is a recognized national actor in the implementation of REDD+ projects in the Brazilian Amazon [14].9The PAS project, launched in 2012, is funded by the Amazon Fund until 2017. The participants in the PAS project live in 13 settlements located in the municipalities of Anapu, Pacajá and Senador José Porfírio, near the BR-230 Trans-Amazonian Highway, an area that has historically suffered from pronounced levels of deforestation and continues to do so today (Figure 1). Agricultural settlers arrived in the area in the 1970s during the early stages of the National Integration Plan for the colonization of the Brazilian Amazon. Today, the livelihoods of small landowners in this area still depend on swidden agriculture and extensive cattle ranching, which constitute two primary drivers of deforestation[42, 43].10
Until recently, the Brazilian Institute for the Environment and Renewable Natural Resources (IBAMA), which operates as the national environmental and legal enforcement authority, has primarily targeted areas dominated by larger properties.11 However, the Brazilian government has recently sought to strengthen command-and-control regulation in the municipalities where the deforestation has been particularly prevalent. In 2008, several municipalities in the Amazon were blacklisted in an attempt to better target their efforts to reduce deforestation.12 The three municipalities we study were added to the blacklist in 2009 and 2012, and monitoring of small landhold-ers in the region intensified as of 2012.
Although small landowners are aware that IBAMA monitors blacklisted municipalities more closely than
non-9Although IPAM is responsible for the implementation of the PAS project, two other Brazilian partners are also involved: the National
Institute of Colonization and Agrarian Reform (INCRA) and the Brazilian Foundation Live, Produce and Preserve (FVPP). See the PAS website: http://assentamentosustentavel.org.br/.
10Nonetheless, the cultivation of cocoa in agroforestry systems is expanding in the area due to guaranteed markets and higher prices, as well
as the interventions of several NGOs and private firms that offer technical assistance to farmers.
11The reason for this is threefold. Firstly, large tracts of forest are easier to detect in satellite images than small ones. Secondly, it is less
expensive to regulate several large landowners than many small landowners who may be scattered over a vast territory. Thirdly, targeting forests in areas dominated by small landowners living in poverty was less politically acceptable than targeting larger, wealthier landowners.
12Not only were law enforcement and monitoring activities intensified, but economic sanctions and political pressures were also imposed in
blacklisted municipalities, they often have no other choice than to clear and burn the forest to maintain a subsis-tence living. One objective of the PAS project was to provide transitional assistance to these smallholders to help them comply with the law.13 The NGO IPAM launched the PAS project in the region where they had previously implemented a program called Proambiente to promote the adoption of agro-ecological practices.14Another ob-jective of the PAS project was to build on the experience of Proambiente to facilitate a transition towards more sustainable agricultural practices by helping smallholders to intensify crop production and livestock farming. The project consists of four main components:
1. Awareness meetings to support a better understanding of the Brazilian Forest Code, which requires that farmers maintain at least 50 percent of land as forest15 (referred to as Legal Reserve), and conserve per-manently protected areas (hilltops, mountain slopes, mangroves, and riparian forests) in order to preserve biodiversity, maintain water quality, and stabilize soils.
2. Administrative support for the regularization of land tenure through registration under the Rural Environ-mental Registry;
3. Support for the compliance with the Forest Code through a PES scheme;
4. Support for the adoption of an environmentally sustainable production system (including practices such as agroforestry, intensive cattle ranching, and fish farming) through direct cash payments, free technical assis-tance, access to farm inputs (which include seed, fertilizer and crop protection), machinery and equipment, as well as organization of local markets in city centers to help the families sell their production.
The payments offered to project participants are conditional on both forest conservation and the adoption of an environmentally sustainable production system: 30 percent of the payment is conditional on the conservation of at least 50 percent of land as Legal Reserve, another 30 percent of the payment is conditional on the conser-vation of 15 meter-wide forest riparian zones and the remaining 40 percent is conditional on the adoption of an environmentally sustainable production system. The implementation of the PES scheme involves the creation of individual land use plans that display the spatial distribution of the new productive activities that participants commit to implementing. The annual payment may reach a maximum of USD 62616when all of these the criteria are met, which is determined by the project proponent through annual field visits. In 2014, however, 100 percent of the payment was conditional on forest conservation only, and the switch towards more sustainable agricultural
13The reason why only a fraction of households decided to enter the project is unclear in this context. Perhaps they believed that their
chances of being inspected by IBAMA were very low, or perhaps the PES compensation was an insufficient incentive.
14The Proambiente program was launched in 2003 and constituted the first PES-like federal program. However, it was halted in 2006 due to
funding cuts, after only six months of payments.
15The Brazilian Forest Code actually requires that private properties located in the Amazon maintain at least 80 percent of land as forest,
what is known as the property Legal Reserve. However, the Legal Reserve has been lowered to 50 percent in some so-called Environmental Economic Zoning (ZEE) areas in order to encourage economic development.
161,680 Reais converted to USD by applying a conversion rate of 0.3724 (average conversion rate of Brazilian Real to American dollars in
production systems was not a requirement for receiving payment. The proportionality rule was therefore aban-doned, a decision made by the project proponent given the delay in the implementation of the fourth component of the project. As a result, our analysis focuses on forest conservation only.17
Based on the classification made by Wunder [48], the PES scheme we study can be seen as a combination of “use-restricting” and “asset-building” schemes, because it includes compensation for both forest conservation as well as the adoption of new practices, supplemented by technical assistance. The first two conditions of the PES correspond to two simplified indicators of compliance with the Brazilian Forest Code. Before the project started, only 15 percent of the surveyed households did not meet the 50 percent legal forest reserve requirement, but an-nual deforestation rates were high enough - above 3 percent per year on average - to justify the implementation of a PES project. Given the deforestation rates observed in the area, it was indeed expected that most households would fall below the threshold of 50 percent of land as Legal Reserve in a few years in the absence of any interven-tion.
Each component of the PAS project is likely to have an impact on the deforestation rates among participants before 2014. Organizing informational meetings (first component) could have an impact on land use because, although the landowners are generally aware of the existence of IBAMA, they are not always familiar with the details of the legislation and the possible sanctions. Providing support for the regularization of land tenure by geo-referencing the property (second component) could also have impacts on forest management, since it provides (publicly available) information on property boundaries and the forest cover of each property, helping landowners to comply with the law and enhancing the credibility of the command-and-control system. The third component of the project (PES) is expected to reduce deforestation, because the amount of the payment was established by the project proponent based on the opportunity cost of maintaining forest on plots devoted to cattle ranching and crops,18and because the participants were told that they would be paid after compliance was verified by IPAM through field visits and satellite images. Only the fourth component may not have had an effect in 2014, because it had not yet been implemented at the time of the survey.19
Finally, it is worth mentioning that the first payments were made in 2014, a few weeks after the final survey. Therefore, if there is any impact of the project (which there is, as we shall see), this may be due to the fact that participants reduced deforestation activities in anticipation of the payments. Of course, this does not exclude
17We study forest cover as a whole, which includes the conservation of riparian zones. In practice, the conservation of riparian areas is often
achieved simply by maintaining the existing forest cover along rivers. In some cases, however, it may happen that landowners must restore these riparian zones. In these cases, they are required to build barriers to delineate the protected area in order to collect the PES. In our study, we do not distinguish between maintaining and restoring riparian zones.
18The detailed calculation of the PES is not publicly available. This amount has been discussed by Cromberg [12].
19The fourth component of the project is expected to give landowners the means to shift from swidden agriculture and extensive cattle
ranching methods to more sustainable practices. Such a change requires both technical assistance and farm inputs and it is very unlikely that participants were able to change their production systems without any support from the project proponent.
the possibility that this result arises because the participants had been convinced of the necessity of decreasing deforestation as a result of the awareness meetings they had attended or because of their discussions with IPAM technical assistants. Indeed, we have no way of knowing which component drives the impact we observe, since all components (except one) were carried out between 2010 and 2014.
3. Data
3.1. Surveys
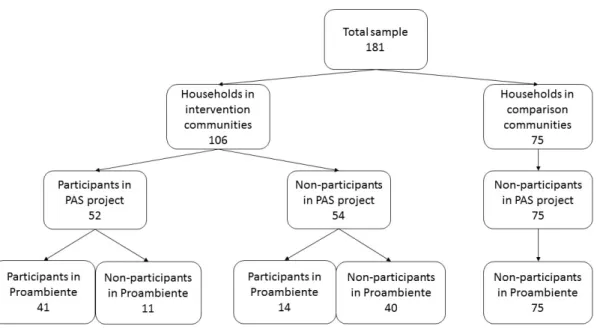
The data used in this article were collected by the Center for International Forestry Research (CIFOR), as part of its Global Comparative Study (GCS) on REDD+ launched in 2009 in 23 subnational REDD+ sites in Brazil, Peru, Indonesia, Vietnam, Cameroon and Tanzania.20 We ran two surveys in eight communities in the Transamazon, four of which were offered the project, and the remaining four were used for comparison (Figure 1). A total of 181 households were interviewed twice. The first survey took place in June-July 2010, before the PAS project be-gan. The second survey took place in February-March 2014, approximately 18 months after the official start of the project. The project proponent selected intervention communities where they had previously implemented the Proambiente program and CIFOR field teams used their knowledge and understanding of site characteristics to identify four comparison villages that were similar in terms of market accessibility, deforestation pressures and socioeconomic factors [45]. In all communities, interviewed households were selected randomly. In the interven-tion communities, a stratified randomizainterven-tion was used to include approximately half of the households that had previously participated in Proambiente. From the 181 households that are included in this study, 106 households were surveyed in the intervention communities and 75 households were surveyed in the comparison communi-ties. Two years after the first survey, half of the 106 households living in the intervention communities became involved in the PAS project. The different sub-samples are described in Figure 2.
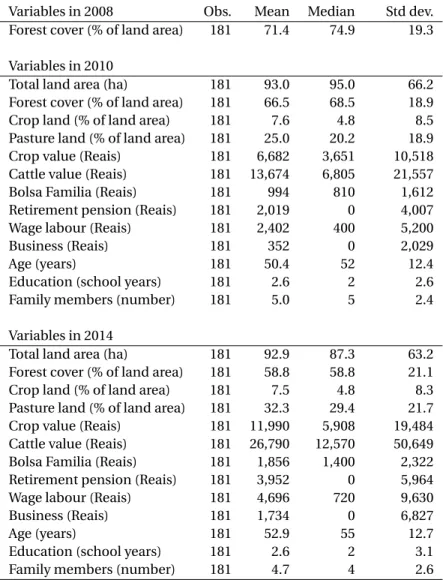
Our database includes variables related to the pre- and post-project periods (Table 1). All data was self-reported by the households during the two surveys conducted in 2010 and 2014. The forestland variable in 2008 was constructed from recall-type questions during the 2010 survey. During both surveys, each respondent was asked to draw a detailed sketch of his or her landholding, and we used these declarative data in our analysis. Un-fortunately, we could not get access to the geolocation of full household plots, which prevented us from using remote sensing data to triangulate survey information.
We are confident about the quality of the declarative data we collected for several reasons. Firstly, respondents are likely to provide accurate answers because they generally cultivate their land themselves, and so tend to be very familiar with the amount of land that they use for agriculture. The area of forest was deduced from the area
of crop and pasture lands reported. Although there is a risk of error when estimating the area of each plot through declarative statements, there is no reason a priori that the participant group would be more mistaken in their estimates than the comparison group, nor for that matter, in a way that would over-estimate the impact of the project.
Secondly, given that they understand that their answers would not influence the payment they received, there is no obvious reason why participants would deliberately provide false information to surveyors. Indeed, the inde-pendence between the research team in the field (CIFOR) and the initiator of the project (IPAM) was clearly stated at the beginning of each meeting or interview. Participants were also informed that their responses would remain anonymous.
Thirdly, we are able to verify the consistency of the information provided in several ways. First, two sections of the questionnaires are dedicated to the calculation of agriculture and forest areas, which allows us to check these values against each other. Moreover, we could check that there is a consistency in the evolution of the different types of land use between 2010 and 2014, as the increase in pasture land is of the same order of magnitude as the decrease in the forestland.
Table 1 reports summary statistics for the entire sample in 2008, 2010 and 2014. The sample includes small rural families that own less than 100 hectares on average21and are representative of the colonist small farmers of the Transamazon highway [27, 30]. In 2010, these landowners devoted about 67 percent of their land to forest and about 25 percent to pasture. Most of the remaining land is dedicated to the cultivation of rice, cassava, or cocoa. While they derive income mainly from crops and livestock, other sources of income such as wage labour from agricultural work on neighboring farms, and government social programs, particularly Bolsa Familia and retirement pensions, are not negligible. In our sample, the 3 percent annual deforestation rate between 2008 and 2010 amounted to about 3 hectares of forest cleared each year. Between 2010 and 2014, the main change relates to a decrease in forest cover, with forests mainly being converted to pasture.
Table 2 displays the summary statistics for several variables corresponding to the pre- and post-project surveys in the intervention and comparison groups. Households in intervention communities (column 1) do not differ much from households in comparison communities (column 2) in terms of mean age (about 50 years), education (about 2.5 years), family size (about 5 members) and total amount of land owned (about 90 ha), as shown in column 4.22However, in both surveys, intervention communities are characterized by owning more land in forest,
21Börner et al. [9] estimate that around 13 percent of the Brazilian Amazon is occupied by formal rural settlements, where people own less
than 100 hectares on average. According to INCRA, 969,640 families lived in these settlements in early 2016, covering a surface area of around 88.3 million hectares. The remaining land includes Indigenous land (22 percent), protected areas (17 percent), private land (24 percent) and unclassified public land (24 percent).
22We calculate the normalized difference between these two groups. The normalized difference is the difference in means between the two
groups divided by the square root of the sum of variances for both groups, and is the most commonly accepted diagnostic used to assess covariate balance [34, 44]. The normalized difference is considered negligible when it is below the suggested rule of thumb of 0.25 standard
less land in pasture, and more revenue from wage labour than comparison communities. The two groups also differ in land use changes over time, with less conversion from forest to pasture in the intervention communities. Our goal is to assess to what extent such changes can be attributed to the PAS project.
3.2. Determinants of participation in the project
To identify the determinants of participation in the PAS project, we compare participating households in the intervention communities to non-participating households in the same communities. Results are displayed in Ta-ble 3. Before the start of the project, participating households (column 1) on average had smaller plots, owned less livestock, and earned more money from wage labour (e.g. agricultural labour) than non-participating households (column 2). However, participants did not differ significantly from non-participants in terms of the proportion of forestland owned (about 70 percent of the land area), deforestation rates (around 3 percent annually), agricultural land (almost 10 percent), or pasture land (around 20 percent), as shown in column 5.
In addition to this analysis, we fit a maximum-likelihood logit regression including all observable factors pre-sented in Table 3. In this model, the dependent variable takes on the value one if the farmer is a participant and takes on the value zero if he/she belongs to the group of non-participants living in intervention communities. Ta-ble 7 in the appendix displays the results expressed in terms of odds ratios. Only the income derived from wage labour appears to play a significant role in determining participation in the project, and its effect remains small in size: holding other variables constant, the odds of being a participant is on average 1 percent greater for farm-ers who earn 500 Reais more from wage labour than for othfarm-ers. No other factors seem to drive participation in a significant way.
4. Estimation Methodology
4.1. Parameters of interest
We seek to capture various impacts of interest. The households from the comparison communities (which we hereafter refer to as the untreated group) are used to construct valid control groups. First, we aim to measure the average intent-to-treat effect, that is to say, the impact of the project on forest conservation among eligible forest owners, namely those living in intervention communities. We then aim to measure the impact of the project on forest conservation among participants. This impact is measured as the average amount of forestland saved by participating farmers as a result of the project. We chose to estimate effects on forest cover as a share of total land area because it relates to the PES requirement that farmers under contract must maintain at least 50 percent of land in forest. Yet, thereafter, we express the results of our impact analysis in hectares and in deforestation rates.
We then study the possible within-community spillover effects of the PAS project, which refers to the changes in the amount of forestland owned by non-participating farmers who reside in intervention communities. We can expect both positive and negative spillover effects of the project on these households. On the one hand, they may be more likely to slow deforestation on their own plots if they had the opportunity to attend awareness meetings and discuss land use issues with participants after the start of the project in 2012. This may have convinced some of the importance of respecting the Forest Code even without the added incentive of PES. If we were able to detect any positive impact among non-participants, this would provide some evidence that the first component of the project (providing support for the understanding of the Forest Code through awareness meetings) was in itself able to change land use. On the other hand, the project may increase deforestation among non-participants if market equilibrium effects occur (such as a change in the demand for cattle products) or if some participants seek to compensate for a possible loss of income by working as a labourer on the plots of non-participant neighbours. To determine the average amount of forestland conserved among participants as a result of the PAS project, we need to calculate the difference between the amount of forestland observed on participating farms in 2014 and the amount of forestland that would have been observed in those farms in 2014, had they not been involved in the project. This is the so-called average treatment effect on the treated (ATT), defined as ATT= E (y1−y0|D = 1),
where y1denotes the amount of a farmer’s forestland in the presence of the project, y0denotes the amount of a farmer’s forestland in the absence of the project, and D is a dummy variable which takes on the value of one when the farmer participated in the project and zero otherwise. We use DID and DID-matching methods to estimate the outcome level in the unobserved state, namely E (y0|D = 1).
4.2. DID-matching approach
In our pre-project data, we find evidence that intervention and comparison communities differed significantly from each other in terms of land use and sources of income (see Section 3.1) and that farmers in intervention com-munities who participated in the project differed from non-participants before the start of the project (Section 3.2). A crucial step is thus to control for observable factors X that are likely to drive both the decision to participate in the PAS project as well as decisions regarding the conservation of forestland in 2014.
It is important that the observable factors X are not affected by the project [22], which is why we use pre-treatment values from 2010 (and from 2008 when available). We include in the set of observable factors X extracted from the baseline 2010 survey: the total land area in hectares in 2010, the amount of forestland as a share of the total land area in 2010 and in 2008, the agricultural land as a share of the total land area in 2010, pastures as a share of the total land area in 2010, the market value of total agricultural production in 2010 (which includes sales and self-consumption), the market value of owned livestock in 2010, the amount of other sources of income received in 2010, such as those derived from wage labour, government social programs, retirement pensions, and outside
businesses (in Reais), as well as family size and the age and education level (in school years) of the head of the household.
Matching eliminates selection bias due to observable factors X by comparing treated farmers to observation-ally identical untreated ones [22]. We apply the DID-matching estimator because, even after conditioning on observable factors X , there may still be systematic differences between treated and matched untreated farmers’ outcomes that could lead to a violation of the identification conditions required for matching [46]. This estima-tor allows for temporally invariant differences in outcomes between participants and their X -matched untreated counterparts. Applied to our data, this identification strategy consists in comparing the change in participants’ forest cover between 2010 and 2014 with the change in forest cover among matched untreated farmers. Forest cover is expressed as a share of the total land area.
Another key assumption for the validity of the DID-matching approach is that the treatment received by one farmer must not affect the outcome of another farmer. This assumption is referred to as the Stable-Unit-Treatment-Value-Assumption [35]. In our analysis, the validity of this assumption is not likely to be threatened because the connection between communities is extremely limited due to the poor quality of transportation in-frastructure.
We use the nearest-neighbour matching estimator, which matches each participant to the two closest un-treated farmer or the four closest unun-treated farmers from the comparison communities, according to the vector
X , and the kernel-based matching estimator [1]. We also apply the matching procedure to the summary statistic
Pr(Di=1|Xi), the so-called propensity score [33]. We use the asymptotically-consistent estimator of the variance
of the nearest-neighbour matching estimator provided by Abadie and Imbens [2], and we implement a bootstrap procedure (500 repetitions) to obtain an estimator of the variance of the kernel matching estimator. In addition, we test for the autocorrelation of the deforestation rates within communities and find that the size of the intra-cluster correlation for this variable is actually small (3.5 percent).23We thus choose to ignore the correlation and analyze the data in a standard way.24
Another, computationally easier, way to estimate the ATT is to regress ∆y on D, controlling for the propensity score (or for X ), by using ordinary least squares. We run these linear regressions as a robustness check.25Finally,
23This result is not surprising since communities as defined in our study cannot be thought like communities as defined in African studies
for example, where there is evidence that the households that are members of the same villages behave the same way. In the present study, households have migrated from different regions and on average have been living in the study communities for 22 years. Also, there is no head of village and there are very few associations.
24With eight clusters only, standard errors might prove too wide and too conservative. We nevertheless obtain still significant estimates
when using clustered standard errors in the estimates for which the sample is large enough, i.e. when we apply our identification strategy to intervention communities taken as a whole. Results are available from authors upon request.
25Standard regression adjustment requires us to assume that there is a linear relationship between the propensity score and the outcome of
interest, which makes the regression more vulnerable to misspecification than matching methods. In the case of the regression adjustment for the propensity score, however, Vansteelandt and Daniel [47] showed that standard tests of the causal null hypothesis, i.e. that E (y1−y0|X ) =
we also provide results of the simple DID estimator, which simply consists in regressing ∆y on D. We estimated heteroskedasticity-consistent standard errors.
5. Results of the impact analysis
5.1. Impacts on intervention communities
We first apply the matching procedure to the group of farmers living in intervention communities and to the one living in the comparison communities, to estimate the ATT effect. Conditional probabilities for living in an intervention community (or propensity scores) are computed by estimating a probit model where the dependent variable is D and which includes all of the aforementioned covariates X . Figure 6 in appendix shows that densities in both groups are high enough for a wide range of propensity scores, meaning that the matching procedure is likely to perform well.
We compare the extent of balancing between the two groups before and after the matching procedure (Ta-ble 2). Column 4 of Ta(Ta-ble 2 shows that, before matching, the intervention group differs significantly from the comparison group in terms of land use and wage income (see Section 3.1). Column 5 of Table 2 reports the nor-malized mean differences after the matching procedure. All the nornor-malized differences are below the suggested rule of thumb of 0.25 standard deviations [23], which indicates that the matching procedure was successful in removing observable sources of bias.
We then examine the validity of the parallel trends assumption further by using a placebo test that applies the identification strategy at a pre-treatment year, 2008, when no effect should be detected. Specifically, we test the parallel trends assumption by matching individuals in the intervention group with individuals in the comparison group using control variables measured in 2010, in the same manner that we aim to estimate the ATT in 2014, except that we evaluate the ATT in 2008 instead. Using this procedure, we find no significant difference in forest cover between households living in intervention communities and their matched counterparts (see column 1 of Table 8 in appendix). Note that applying the simple DID approach to the data leads to the same result (a zero impact of the project in 2008). We conclude that our identification strategy is valid.26
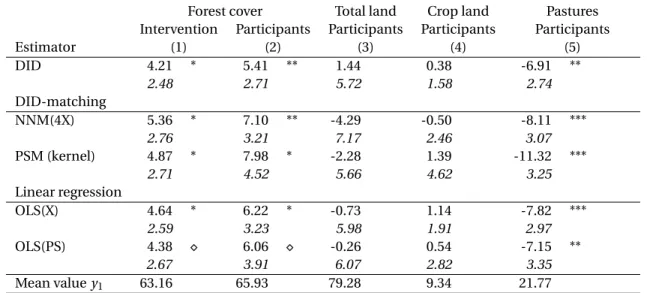
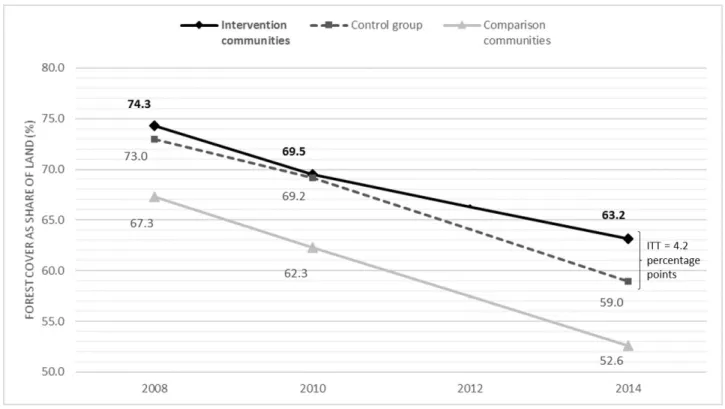
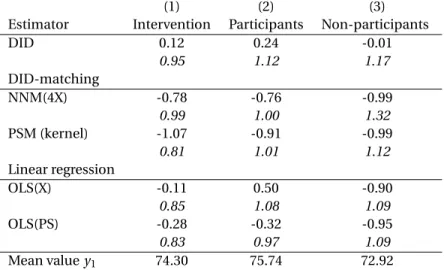
Column 1 of Table 4 gives the estimates of the impact of the project on forestland owned in the intervention group. In the majority of cases, the impact is estimated with precision. When looking at the significant results only, the estimated ATT range between 4.21 and 5.36 percentage points. Using the smallest significant impact estimator, which is the DID estimator (ATT= 4.21 percentage points), it represents the difference in 2014 between
adjustment also requires us to assume that the benefit associated with the project is constant across variables X , meaning that the impact of the project is the same for all treated farmers.
26Although previous participation in the Proambiente program determines participation in the PAS project, it is not associated with any
difference in deforestation rates between groups in absence of the project, as demonstrated by the parallel trends before 2010. We can thus safely assume that participation in Proambiente is not a confounding variable in our framework.
the average land area devoted to forests among eligible farmers (63.16 percent) and the average land area devoted to forests among controls (58.95 percent). Given that average land area equals 95.86 hectares, this indicates that an average of approximately 4 hectares of forests were saved on each eligible farm, compared to the counterfactual scenario of no project.
This result is shown graphically in Figure 3. We observe that the amount of forest cover continues to decline in both intervention and control groups after 2010. However, we see a clear break in the deforestation trend among eligible farmers, which we can attribute to the PAS project. After 2010, the deforestation rate in intervention com-munities decreased to 2.3 percent, which means that the project has led to an approximately 40 percent decrease in the average deforestation rate in these farms, compared to the control group, where the deforestation rate is around 4 percent in 2014.
5.2. Impacts on participants and spillover effects
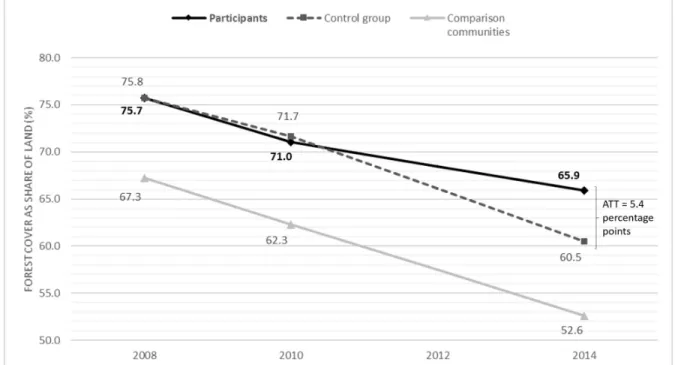
Given the significant result obtained for forest cover in intervention communities, we then apply our identifi-cation strategy to the group of participants. Again, we compute conditional probabilities for participation in the project (see the distribution of propensity scores on Figure 7 in appendix). Column 2 in Table 4 gives the ATT we obtained for this group.27 The ATT values range from 5.41 to 7.98 percentage points. Given that the average land area in participating farms equals 79.28 hectares, this indicates that an average of approximately 4.3 hectares of forests were saved on each participating farm, compared to the counterfactual scenario of no project. Figure 4 displays a clear break in the deforestation trend among participants, which we can attribute to the PAS project. Between 2010 and 2014, the deforestation rate among participants decreased to 1.8 percent, which means that the PAS project has led to an approximately 50 percent decrease in the average deforestation rate in these farms, compared to the control group, where the deforestation rate is around 4 percent in 2014.
We also observe that the deforestation rate among controls is similar to that in comparison communities, around 4 percent between 2010 and 2014, and that it appears to have followed the same trend since 2008. This is why applying the DID approach to the data leads to results that are very similar in size to those obtained from the DID-matching approach. Finally, Figure 4 shows that the average landowner from comparison communities nearly reached the threshold of 50 percent of land as Legal Reserve in 2014, and that the average participant would have crossed this threshold in just a few years in the absence of the project.
Applying the same identification strategy to the total land area, we find no difference between participant and control groups in 2014 (see column 3 of Table 4).28 We conclude that less deforestation among participants
nec-27Again the placebo test suggests that our identification strategy is valid (see column 2 of Table 8 in appendix).
28We apply our identification strategy to this outcome to check whether any change should be detected and attributed to the project. We
did this because one might expect that participants have increased the total land area in order to comply with the requirements of the project while clearing the same area of forest as those in the control group.
essarily caused some changes to the way that other owned land is used. We thus apply our identification strategy to the proportion of land devoted to crops and to pastures. We find no evidence of any impacts on cropland (see column 4 of Table 4).
In contrast, we do find evidence that the project had a significant impact on the creation of pastures. Column 5 of Table 4 displays the estimates of the impact of the project on participants in terms of amount of total land as pasture. The estimated ATT range between −5.78 and −11.32 percentage points. This means that the creation of an average of 4.6 hectares of pastures (taking ATT=−5.78 percentage points) may have been avoided in each participating farm compared to a scenario without the PAS project. These results fit well with our estimates of the project’s impact on forest cover. We thus conclude that an average of about 4 to 5 hectares of forest have been saved on each participating farm in 2014, and that this conservation came at the expense of pastures rather than cropland.
Since participants did not receive the PES until 2014, we investigate whether the changes in land use that occurred due to the project, i.e. more forests and less pastures, prompted participating farmers to seek alternative sources of income outside the farm. To do so, we apply our identification strategy to the variable that measured wage labour in 2014. Most estimators do not allow us to reject the null hypothesis of no impact (see columun 1 of Table 9 in appendix). Thus, we are not able to conclude that participants sought new sources of income outside the farm at this stage of the project.
Finally, we apply our identification strategy to a cattle ranching intensification variable, constructed as the ratio of the value of livestock to pasture area.29The point estimate is positive but lacks precision, and most of the time we are not able to reject the null hypothesis of no impact (see column 2 of Table 9 in appendix). Thus, our data do not allow us to determine whether the participants in the project reduced cattle farming activity as a result of the project.
Looking at the participant group, we can thus safely conclude that the PAS project had a significant impact on forest cover by curbing deforestation and that this change occurred to the detriment of new pastures, not cropland. On the contrary, we failed to detect any significant impact on other variables like livestock or wage labour outside the farm. Moreover, as the project has several components, we are unable to determine whether the detected impact on forest cover is due to one or several of these components.30
29The average value of all cattle owned by participants in 2014 is about 15,000 Reais, which corresponds to about 15 cows per farm. In 2010,
participants owned an average of about 11 cows per farm.
30The way in which the project was implemented in the intervention communities suggests that it is possible to estimate the impact of the
first two components (awareness meetings and registration under the Rural Environmental Registry) in isolation from the payment compo-nent by comparing participants to matched non-participants in intervention communities. We thus applied our DID-matching strategy to the entire sample of intervention communities, considering participants as treated and non-participants as untreated. Unfortunately, the match-ing procedure did not perform well and we failed to find non-participants who did not statistically differ from participants in pre-treatment characteristics, notably regarding family size or the Bolsa Familia payment they received from Brazilian government.
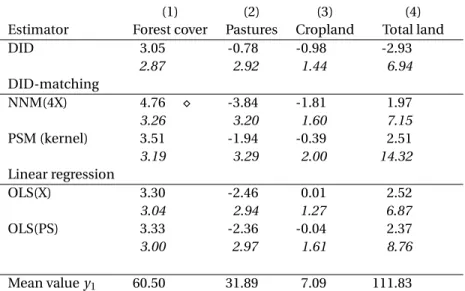
We then test for the presence of spillover effects within intervention communities by applying the DID and DID-matching procedure to the non-participants living in these communities.31 We also run the placebo test and conclude that our identifications strategy is also valid for this group (see column 3 in Table 8 in appendix). Column 1 of Table 5 shows the estimates of the impact of the project on the forest cover of this group (see also Figure 9 in appendix). The null assumption (ATT= 0) cannot be rejected whatever the estimator considered, which indicates that, if there is any spillover effect it is too small to be detected using our data. We also do not find any significant impact on pastures (column 2), cropland (column 3) or total land area (column 4). We are, however, able to show that, if there is any negative spillover effect it is too small to entirely offset the additional impact of the project on forest cover in intervention communities (see Section 5.1). We can thus safely conclude that, even in presence of negative spillovers inside intervention communities, the PAS project had a significant and positive net impact on forest cover in intervention.
6. Cost-benefit analysis
Finally, we use our estimates of the ATT to perform a cost-benefit analysis of the project. First, we provide an estimate of the number of tons of CO2 emissions that have been averted thanks to the project and use this estimate to calculate the project costs per ton of averted CO2 emissions. Then, we provide an estimate of the social benefit of the project under various hypothetical scenarios regarding deforestation rates after the project ends and we calculate the cost-benefit ratio in each case.
6.1. Project costs per ton of averted CO2 emissions
We take our main estimate of the impact of the project on participants as a starting point for the cost-benefit analysis.32 Given that participants saved an average of approximately 4.3 ha of forest on their farm since the beginning of the project in 2012,33we expand this point estimate to the 350 households involved in the project and estimate that a total of 1,505 hectares of forest were saved as a result of the project.
Similiar to Jayachandran et al. [25], we use satellite-based estimates of biomass in forests, available at a 30-meter resolution and provided by the World Resources Institute34to estimate the carbon in forestland in our study area; the average is 116 tons of carbon per hectare.35. We then calculate the impact of the forestland conserved in
31Again, we compute conditional probabilities for this group (see the distribution of propensity scores on Figure 8 in appendix).
32We refer here to the 5.41 percentage point difference in 2014 between the average land area devoted to forests among participants
(65.93 percent) and the average land area devoted to forests among controls (60.52 percent), which is equivalent to an average of approxi-mately 4.3 hectares of forests saved on each participating farm, compared to the counterfactual scenario of no project.
33Participants in the project received PES only in 2014, but we do not rule out the possibility that the numerous public meetings regarding
the significance of the upcoming environmental regulations that took place in 2013 may have played a role in the decrease in deforestation we measure. As a result, we assume that the gains in terms of retained forest cover should be distributed over both years.
34We used the Global Forest Watch dataset, accessed on Frebruary 2017. See the website at www.globalforestwatch.org. 35We refer here to carbon per hectare of forest with at least 50% tree cover
tCO2 (1 tC =3.67 tCO2), and determine that the PAS project led to 639,080 tCO2 in avoided emissions (1,826 tCO2 per participant) over two years.
The total costs of the PAS project can be estimated using the amount of PES disbursed to participants in 2014 (626 USD per participant, which leads to a total of 219,100 USD), plus start-up as well as operational costs (the total costs then reach 1,159,683 USD, i.e. 3,313 USD per participant over two years).36 Assuming unchanged de-forestation rates until the end of the project (2017), the total discounted project costs over the 2012-2017 period are 2,021,859 USD (5,777 USD per participant) while the total avoided emissions reach 3,628,166 tCO2 (10,366 tCO2 per participant). Over the five years of the project, the total cost of the project is thus 0.56 USD per ton of CO2.
6.2. Social benefit under various scenarios
The costs of the project should be compared to the social benefit of the forest protection that it generated. To do so, we use the estimate of the social cost of carbon (SCC) made by the Interagency Working Group on Social Cost of Carbon for the period 2010-2050 [24]. The SCC represents the benefit of permanently averting carbon emissions; it equals 36 USD in 2015, 42 USD in 2020, 52 USD in 2030, 62 USD in 2040 and 73 USD in 2050 [24].37 We then take the constant annual value corresponding to the SCC using a three percent discount rate.38We obtain for example 1.05 USD in 2015, 1.23 USD in 2020, 1.51 USD in 2030, 1.82 USD in 2040 and 2.13 USD in 2050.
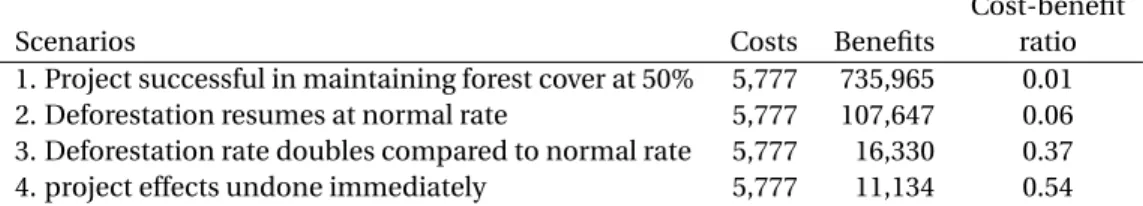
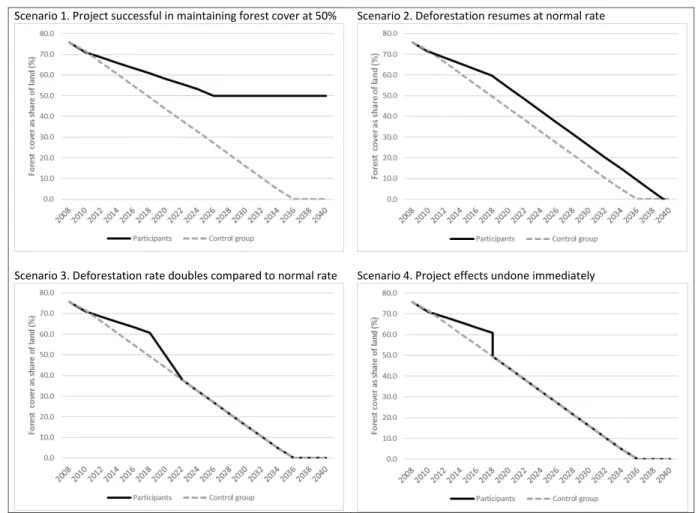
We then make assumptions about the future of the protected forests after the project ends. We focus on four case scenarios (Table 6). In all of them, the counterfactual situation assumes that the participants follow their nor-mal deforestation rate until all the forest is cleared.39Our first case scenario, the most optimistic one, assumes that the average rate of deforestation among participants remains the same after 2014 until a threshold of 50 percent of land as Legal Reserve is attained, and becomes null thereafter. This scenario represents a situation where the project was successful in informing participants about the Forest Code and triggered a transition to more sustain-able land use practices. In that case, the threshold of 50 percent of forest cover would be reached in 2026, whereas it would have been reached in 2018 in the absence of the PAS project (Figure 5, top left). In that case, the forest is preserved permanently (while it would have entirely disappeared in 2036 in the absence of the PAS project) and the cost-benefit ratio is virtually zero.40
Our second case scenario assumes that the participants will resume their normal (pre-project) rate of
defor-36We estimate these costs using information provided by Sills et al. [39]. This amount includes the start-up (awareness meetings, baseline
analysis, etc.) and recurrent (administrative, monitoring, technical assistance, etc.) costs of the project.
37We calculate the SCC for all other years using the growth rates based on the projections by the Interagency Working Group on SCC: 3.2
per-cent over 2010-2020, 2.1 perper-cent over 2020-2030, 1.9 perper-cent over 2030-2040 and 1.6 perper-cent over 2040-2050.
38The SCC equals the discounted sum ad infinitum of annual values: SCC=P+∞
t (1+r )V t where V is the annual value and r is 3 percent, the
middle rate used by the Interagency Working Group on SCC. Then we get V =r ×SCCr +1 [26].
39We thus do not take into account the strengthening of the command-and-control regulation.
40Because we do not have estimates for the SCC after 2050, we can calculate the annual benefits over the 2014-2050 period only. We find a
estation after the project ends (2017) and clear the entire forest they own (Figure 5, top right). This scenario cor-responds to a failure in triggering a transition towards sustainable practices, as the participants revert to their pre-project practices. In that case, all the forest would be cleared by 2040 (while it would have been cleared by 2036 in the absence of the PAS project) and the cost-benefit ratio is 0.05.
Our third case scenario assumes that after 2017, the participants will deforest at a 50 percent higher rate than their normal rate until they catch up on all their postponed deforestation and follow their normal rate thereafter until all the forest is cleared (Figure 5, bottom left). In that case, all benefits will have disappeared by 2021 and the cost-benefit ratio is 0.35.
Our last case scenario, the most pessimistic one, assumes that the participants will catch up on all their delayed deforestation immediately after the project ends (2017) and follow their normal rate thereafter until all the forest is cleared (Figure 5, bottom right). In that case, the cost-benefit ratio is 0.52. Put differently, the cost per participant would have to double to equal the social benefit induced by the project - something that may happen if unexpected costs arise during the implementation of the last component.
It is worth-mentioning that forest owners are unlikely to accelerate their deforestation at the end of the project (third and fourth scenarios), unless for example they use money received through the PES component to increase their work force. The first scenario is also quite unlikely to occur, as the fourth component of the project had not started as of 2014, and achieving a transition towards new agricultural practices in less than three years would be challenging. The most likely scenario is the second scenario of reversion to pre-project deforestation rates. Table 6 summarizes the project’s costs and benefits for the four scenarios. Our calculations show that, even in the more pessimistic scenario, the cost-benefit ratio remains lower than one.
7. Conclusion
Subnational REDD+ initiatives emerged in many areas around the world, and particularly in Brazil. However, the impacts of these projects have been largely under-studied. This article fills this gap by providing a robust impact assessment of a REDD+ pilot project that offers a PES scheme, along with technical and administrative support, to facilitate farmer compliance with the Forest Code in the Brazilian Amazon. We estimate impacts on the participants and within-community spillovers of the project using original data collected from 181 individual farmers in the state of Pará. We apply DID-matching to our data and find support for the parallel trend assump-tion underlying our identificaassump-tion strategy. We estimate that an average of approximately 4 ha of forest have been saved on each participating farm in 2014 compared to a control group. Although the amount of forest cover con-tinues to decline in both participant and control groups after 2010, we highlight a clear break in this trend among participants, which we are able to attribute to the PAS project. After 2010, the deforestation rate among
partici-pants decreases to 1.8 percent, which means that the project led to a decrease in the average deforestation rate by approximately 50 percent.
Our estimates also suggest that without the project, the average participant would have crossed the threshold of 50 percent of land as Legal Reserve within just a few years. Moreover, we show that decreases in deforestation occurred at the expense of pastures over croplands. We find no evidence of within-community spillovers. Finally, we perform a cost-benefit analysis and show that, even in the more pessimistic scenario, the cost-benefit ratio remains lower than one.
Our results suggest that REDD+ projects that include a PES component constitute a promising strategy to reduce deforestation rates among small landowners. The long term on-the-ground presence of the project pro-ponent and the gradual implementation of command-and-control measures in the most remote areas probably helped obtaining such encouraging results. It should be noted, however, that at the time of data collection the PAS project was still in the early stages of implementation, and our data do not allow us to determine whether participants will be able to eliminate their reliance on deforestation activities altogether by switching towards more sustainable agricultural production systems before the project’s expiration date. Our results indicate that participants in the project were able to reduce their deforestation activities by devoting less pastureland to their cattle in the first year of the project, and that they may not have suffered from a loss of income as a result of less deforestation.
Taken together, these results raise several questions. Will participating farmers adopt more intensive cattle ranching systems in the long run? As extensive cattle ranching is a major driver of deforestation in the study area, livestock intensification appears to be a promising strategy to reduce deforestation and constitutes one of IPAM’s priorities. Are there other strategies available to farmers that would enable them to reduce their dependence on deforestation activities? Among the possible alternative practices, the expansion of cocoa production could be a promising alternative to cattle ranching and swidden agriculture because cocoa is grown in an agroforestry system (as such, it can be recognized as Legal Reserve), and because it has the potential to be more profitable than ex-tensive cattle ranching [38, 37]. A limitation, however, is that cocoa production requires fertile soils, high start-up costs, and technical agricultural support to obtain good quality cocoa. Towards this end, the PAS project includes provisions aimed at providing technical assistance and farm inputs for the adoption of such sustainable practices. An evaluation of the project over the long-term could help assess participants’ ability to entirely eliminate their de-pendence on the deforestation of mature forest, switch toward more sustainable agricultural production systems, and enhance their subsistence livelihoods. Understanding the effectiveness of direct cash payments on smallhold-ers’ conservation decisions, in the context of their broader strategies, is indeed fundamental to understanding the implications of PES programs in the long run.
[1] Abadie, A., Drukker, D., Herr, J. L., Imbens, G. W., 2004. Implementing matching estimators for average treat-ment effects in stata. Stata journal 4, 290–311.
[2] Abadie, A., Imbens, G. W., 2006. Large sample properties of matching estimators for average treatment effects. Econometrica 74 (1), 235–267.
[3] Alix-Garcia, J., Wolff, H., 2014. Payment for ecosystem services from forests. Annual Review of Resource Eco-nomics 6 (1), 361–380.
[4] Alix-Garcia, J. M., Shapiro, E. N., Sims, K. R. E., 2012. Forest conservation and slippage: Evidence from mex-ico’s national payments for ecosystem services program. Land Economics 88 (4), 613–638.
[5] Alix-Garcia, J. M., Sims, K. R. E., Yañez-Pagans, P., November 2015. Only one tree from each seed? environ-mental effectiveness and poverty alleviation in mexico’s payments for ecosystem services program. American Economic Journal: Economic Policy 7 (4), 1–40.
[6] Arriagada, R. A., Ferraro, P. J., Sills, E. O., Pattanayak, S. K., Cordero-Sancho, S., 2012. Do payments for environ-mental services affect forest cover? a farm-level evaluation from costa rica. Land Economics 88 (2), 382–399, matching sur PES au Costa Rica.
[7] Assunção, J., Rocha, R., 2014. Getting greener by going black: The priority municipalities in brazil. Tech. rep., Climate Policy Initiative Working Paper.
[8] Borner, J., Marinho, E., Wunder, S., 2015. Mixing carrots and sticks toconserve forests in the brazilian amazon: A spatial probabilistic modeling approach. PloS one 10 (2), e0116846.
[9] Börner, J., Wunder, S., Wertz-Kanounnikoff, S., Tito, M. R., Pereira, L., Nascimento, N., 2010. Direct con-servation payments in the brazilian amazon: Scope and equity implications. Ecological Economics 69 (6), 1272–1282.
[10] Chhatre, A., Agrawal, A., 2009. Trade-offs and synergies between carbon storage and livelihood benefits from forest commons. Proceedings of the National Academy of Sciences 106 (42), 17667–17670.
[11] Costedoat, S., Corbera, E., Ezzine-de Blas, D., Honey-Rosés, J., Baylis, K., Castillo-Santiago, M. A., 2015. How effective are biodiversity conservation payments in mexico? PloS one 10 (3), e0119881.
[12] Cromberg, M., 2012. Meios de vida no polo proambiente da transamazônica-pa. Master’s thesis, Universi-dade do Estado de Santa Catarina.
[13] Ezzine-de-Blas, D., Börner, J., Violato-Espada, A.-L., Nascimento, N., Piketty, M.-G., 2011. Forest loss and management in land reform settlements: Implications for redd governance in the brazilian amazon. Envi-ronmental science & policy 14 (2), 188–200.
[14] Gebara, M. F., Fatorelli, L., May, P., Zhang, S., 2014. Redd+ policy networks in brazil: constraints and opportu-nities for successful policy making. Ecology and Society 19 (3), 53.
[15] Gebara, M. F., Thault, A., 2013. Ghg mitigation in brazil’s land use sector: an introduction to the current national policy landscape. World Resource Institute Working paper.
[16] Godar, J., Gardner, T. A., Tizado, E. J., Pacheco, P., 2014. Actor-specific contributions to the deforestation slowdown in the brazilian amazon. Proceedings of the National Academy of Sciences 111 (43), 15591–15596. [17] Grace, J., Mitchard, E., Gloor, E., 2014. Perturbations in the carbon budget of the tropics. Global Change
Biology 20 (10), 3238–3255.
[18] Hansen, M. C., Potapov, P. V., Moore, R., Hancher, M., Turubanova, S. A., Tyukavina, A., Thau, D., Stehman, S. V., Goetz, S. J., Loveland, T. R., Kommareddy, A., Egorov, A., Chini, L., Justice, C. O., Townshend, J. R. G., 2013. High-resolution global maps of 21st-century forest cover change. Science 342 (6160), 850–853.
[19] Harris, N. L., Brown, S., Hagen, S. C., Saatchi, S. S., Petrova, S., Salas, W., Hansen, M. C., Potapov, P. V., Lotsch, A., 2012. Baseline map of carbon emissions from deforestation in tropical regions. Science 336 (6088), 1573– 1576.
[20] Heckman, J., Ichimura, H., Smith, J., Todd, P., 1998. Characterizing selection bias using experimental data. Econometrica 66 (5), 1017–1098.
[21] Heckman, J. J., Ichimura, H., Todd, P. E., 1997. Matching as an econometric evaluation estimator: Evidence from evaluating a job training programme. The review of economic studies 64 (4), 605–654.
[22] Imbens, G. W., 2004. Nonparametric estimation of average treatment effects under exogeneity: A review. Review of Economics and statistics 86 (1), 4–29.
[23] Imbens, G. W., Wooldridge, J. M., 2009. Recent developments in the econometrics of program evaluation. Journal of economic literature 47 (1), 5–86.
[24] Interagency Working Group on Social Cost of Carbon, 2015. Technical update of the social cost of carbon for regulatory impact analysis under executive order 12866. Tech. rep., United States Environmental Protection Agency.
[25] Jayachandran, S., de Laat, J., Lambin, E. F., Stanton, C. Y., June 2016. Cash for carbon: A randomized con-trolled trial of payments for ecosystem services to reduce deforestation. Working Paper 22378, National Bu-reau of Economic Research.
[26] Lecocq, F., Caurla, S., Delacote, P., Barkaoui, A., Sauquet, A., 2011. Paying for forest carbon or stimulating fuelwood demand? insights from the french forest sector model. Journal of Forest Economics 17 (2), 157 – 168, fuelwood, timber and climate change: Insights from the forest sector modeling.
[27] Moran, E. F., 1981. Developing the Amazon. Indiana Univ. Press.
[28] Nepstad, D., McGrath, D., Stickler, C., Alencar, A., Azevedo, A., Swette, B., Bezerra, T., DiGiano, M., Shimada, J., Seroa da Motta, R., Armijo, E., Castello, L., Brando, P., Hansen, M. C., McGrath-Horn, M., Carvalho, O., Hess, L., 2014. Slowing amazon deforestation through public policy and interventions in beef and soy supply chains. Science 344 (6188), 1118–1123.
[29] Pattanayak, S. K., Wunder, S., Ferraro, P. J., 2010. Show me the money: Do payments supply environmental services in developing countries? Review of Environmental Economics and Policy 4 (2), 254–274.
[30] Perz, S. G., Walker, R. T., Caldas, M. M., 2006. Beyond population and environment: Household demographic life cycles and land use allocation among small farms in the amazon. Human Ecology 34 (6), 829–849. [31] Puyravaud, J.-P., 2003. Standardizing the calculation of the annual rate of deforestation. Forest Ecology and
Management 177 (1â ˘A¸S3), 593 – 596.
[32] Robalino, J., Pfaff, A., 2013. Ecopayments and deforestation in costa rica: A nationwide analysis of psa’s initial years. Land Economics 89 (3), 432–448.
[33] Rosenbaum, P. R., Rubin, D. B., 1983. The central role of the propensity score in observational studies for causal effects. Biometrika 70 (1), 41–55.
[34] Rosenbaum, P. R., Rubin, D. B., 1985. Constructing a control group using multivariate matched sampling methods that incorporate the propensity score. The American Statistician 39 (1), 33–38.
[35] Rubin, D. B., 1978. Bayesian inference for causal effects: The role of randomization. The Annals of statistics 6 (1), 34–58.
[36] Rubin, D. B., 2001. Using propensity scores to help design observational studies: Application to the tobacco litigation. Health Services and Outcomes Research Methodology 2 (3), 169–188.
[37] Sablayrolles, P., Oliveria, C., Pinto, C., 2012. Adequação ambiental e políticas públicas para a agricultura fa-miliar do alto xingu. Tech. rep., GRET.