HAL Id: hal-02051685
https://hal-amu.archives-ouvertes.fr/hal-02051685
Submitted on 16 Oct 2020
HAL is a multi-disciplinary open access
archive for the deposit and dissemination of
sci-entific research documents, whether they are
pub-lished or not. The documents may come from
teaching and research institutions in France or
abroad, or from public or private research centers.
L’archive ouverte pluridisciplinaire HAL, est
destinée au dépôt et à la diffusion de documents
scientifiques de niveau recherche, publiés ou non,
émanant des établissements d’enseignement et de
recherche français ou étrangers, des laboratoires
publics ou privés.
Distributed under a Creative Commons Attribution| 4.0 International License
dissolved organic matter (CDOM) in coastal surface
waters of the northwestern Mediterranean Sea, influence
of the Rhône River
J. Para, P. Coble, B. Charrière, M. Tedetti, C. Fontana, Richard Sempere
To cite this version:
J. Para, P. Coble, B. Charrière, M. Tedetti, C. Fontana, et al.. Fluorescence and absorption properties
of chromophoric dissolved organic matter (CDOM) in coastal surface waters of the northwestern
Mediterranean Sea, influence of the Rhône River. Biogeosciences, European Geosciences Union, 2010,
7 (12), pp.4083-4103. �10.5194/bg-7-4083-2010�. �hal-02051685�
www.biogeosciences.net/7/4083/2010/ doi:10.5194/bg-7-4083-2010
© Author(s) 2010. CC Attribution 3.0 License.
Biogeosciences
Fluorescence and absorption properties of chromophoric dissolved
organic matter (CDOM) in coastal surface waters of the
northwestern Mediterranean Sea, influence of the Rhˆone River
J. Para1,2, P. G. Coble3, B. Charri`ere1,2, M. Tedetti1,2, C. Fontana4,5, and R. Semp´er´e1
1Universit´e de la M´editerran´ee, LMGEM, Centre d’Oc´eanologie de Marseille, Case 901, 13288 Marseille Cedex 9, France 2CNRS/INSU, UMR 6117, LMGEM, Case 901, 13288 Marseille Cedex 9, France
3College of Marine Science, University of South Florida, 140 7th Avenue, St. Petersburg, Florida 33701, USA 4Universit´e de la M´editerran´ee, LOPB, Centre d’Oc´eanologie de Marseille, UMR 6535, Station Marine d’Endoume, Chemin Batterie des Lions, 13007 Marseille, France
5CNRS/INSU, UMR 6535, LOPB, Centre d’Oc´eanologie de Marseille, Station Marine d’Endoume, Chemin Batterie des Lions, 13007 Marseille, France
Received: 28 June 2010 – Published in Biogeosciences Discuss.: 22 July 2010
Revised: 7 December 2010 – Accepted: 17 December 2010 – Published: 23 December 2010
Abstract. Seawater samples were collected monthly in
sur-face waters (2 and 5 m depths) of the Bay of Marseilles (northwestern Mediterranean Sea; 5◦1703000E, 43◦1403000N) during one year from November 2007 to December 2008 and studied for total organic carbon (TOC) as well as chro-mophoric dissolved organic matter (CDOM) optical prop-erties (absorbance and fluorescence). The annual mean value of surface CDOM absorption coefficient at 350 nm [aCDOM(350)] was very low (0.10 ± 0.02 m−1) in compari-son to values usually found in coastal waters, and no signifi-cant seasonal trend in aCDOM(350) could be determined. By contrast, the spectral slope of CDOM absorption (SCDOM) was significantly higher (0.023 ± 0.003 nm−1) in summer than in fall and winter periods (0.017 ± 0.002 nm−1), re-flecting either CDOM photobleaching or production in sur-face waters during stratified sunny periods. The CDOM fluorescence, assessed through excitation emission matrices (EEMs), was dominated by protein-like component (peak T; 1.30–21.94 QSU) and marine humic-like component (peak M; 0.55–5.82 QSU), while terrestrial humic-like fluores-cence (peak C; 0.34–2.99 QSU) remained very low. This reflected a dominance of relatively fresh material from bio-logical origin within the CDOM fluorescent pool. At the end of summer, surface CDOM fluorescence was very low and strongly blue shifted, reinforcing the hypothesis of CDOM photobleaching. Our results suggested that unusual Rhˆone
Correspondence to: R. Semp´er´e (sempere@univmed.fr)
River plume eastward intrusion events might reach Mar-seilles Bay within 2–3 days and induce local phytoplank-ton blooms and subsequent fluorescent CDOM production (peaks M and T) without adding terrestrial fluorescence sig-natures (peaks C and A). Besides Rhˆone River plumes, mix-ing events of the entire water column injected relative aged (peaks C and M) CDOM from the bottom into the surface and thus appeared also as an important source of CDOM in surface waters of the Marseilles Bay. Therefore, the assess-ment of CDOM optical properties, within the hydrological context, pointed out several biotic (in situ biological produc-tion, biological production within Rhˆone River plumes) and abiotic (photobleaching, mixing) factors controlling CDOM transport, production and removal in this highly urbanized coastal area.
1 Introduction
Dissolved organic matter (DOM) represents one of the largest bioreactive organic reservoirs at earth’s surface (Hedges, 1992, 2002) and constitutes the main substrate for heterotrophic bacteria growth (Azam et al., 1983). The dom-inant source of DOM in the ocean is phytoplankton through release of organic compounds during bacterial and viral ly-sis, exudation, excretion and grazing (Mague et al., 1980; Ju-mars et al., 1989; Nagata, 2000; Myklestad, 2000). Though the inputs of terrestrial DOM represent only 0.7–2.4% of the total oceanic DOM pool, river inputs may be impor-tant in coastal oceanic areas (Opsahl and Benner, 1997) by
fueling alternative labile carbon source to sustain local car-bon demand in addition to autochthonous carcar-bon source de-rived from phytoplankton and heterotrophic microbial food web (Semp´er´e et al., 2000) and increasing light attenuation (Blough and Del Vecchio, 2002; Nelson and Siegel, 2002).
Chromophoric (or colored) dissolved organic matter (CDOM), which is the fraction of DOM that absorbs light over a broad range of ultraviolet (UV) and visible wave-lengths, is essentially controlled by in situ biological produc-tion, terrestrial inputs (sources), photochemical degradaproduc-tion, microbial consumption (sinks), as well as deep ocean circu-lation (Siegel et al., 2002; Nelson et al., 2007; Coble, 2007) and upwelling and/or vertical mixing (Coble, 1996; Parlanti et al., 2000). CDOM is the major factor controlling the at-tenuation of UV radiation in the ocean (Kirk, 1994) and is highly photoreactive and efficiently destroyed upon exposure to solar radiation (Mopper and Kieber, 2000, 2002).
In the past 20 years, CDOM fluorescence properties have been widely studied owing to excitation-emission matrices (EEMs). Coble et al. (1990) highlighted that the fluorescence properties of the Black Sea CDOM came from two types of fluorescent peaks (humic-like and protein-like). Protein-like fluorescence, considered as a proxy for labile DOM (Ya-mashita and Tanoue, 2003), has been frequently reported (Mopper and Schultz, 1993; De Souza-Sierra et al., 1994; Determann et al., 1994, 1996; Coble, 1996; Mayer et al., 1999). The identification/quantification of humic-like and protein-like peaks from EEMs has thus allowed determin-ing the dynamics of DOM in relation to its biological reac-tivity. In addition, fluorescence indices have also been used to assess the origin and dynamics of fluorescent CDOM, es-pecially in the coastal areas subjected to freshwater inputs. The humification index (HIX, Zsolnay et al., 1999) and the biological index (BIX, Huguet et al., 2009) have been em-ployed to determine the relative degree of humification and autotrophic productivity of fluorescent CDOM, respectively. Freshwater inputs play a major role in the biogeochem-istry of the coastal areas with a world annual fresh water dis-charge of 40 000 km3, more than 25 billions tons of particu-late and dissolved matter (Milliman et al., 1995) and trans-porting on average 1 ± 0.2 Gt of carbon per year in particu-late and dissolved forms (Amiotte-Suchet et al., 2003). In the Mediterranean Sea, freshwater inputs enhance signifi-cantly primary productivity (Cruzado and Velasquez, 1990; Joux et al., 2009). The annual fluvial loading of TOC to the Mediterranean Sea comprises 0.08–0.3% of the standing stock of TOC in the whole Mediterranean Basin (Semp´er´e et al., 2000), which is much higher than the average value re-ported for the World Ocean (0.024%, Smith and Hollibaugh, 1993). Since the damming of the Nile, the Rhˆone River be-came the major source of fresh water and terrigenous par-ticles to the Mediterranean basin (Margat, 1992). Its mean freshwater discharge is around 1700 m3s−1, which repre-sents 90% of the total freshwater input in the Gulf of Lion’s continental shelf (Durrieu de Madron et al., 2003) and ∼3–
14% and 10–12% of the overall total organic and inorganic carbon (TOC and TIC) river inputs to the Mediterranean Sea (Semp´er´e et al., 2000). Remote sensing observations (Forget et al., 1990; Devenon et al., 1992; Broche et al., 1998) and modeling studies (Estournel et al., 2001; Arnoux-Chiavassa et al., 2003; Reffray et al., 2004) shown the predominant westward direction of the Rhˆone River plume with an ex-tent and a thickness depending on its discharge, the meteo-rological conditions and the surrounding circulation, particu-larly the Northern Current. A less common orientation of the Rhˆone River plume, towards the east as far as 40 km from the Rhˆone River mouth and offshore of Marseilles Bay, has been recently documented by using the acoustic Doppler current profiler (ADCP) measurements (Gatti et al., 2006).
Despite its relative significant role in the Mediterranean carbon cycle, there are only a few studies showing CDOM originating either directly from the Rhˆone River or from by-products of primary production in coastal areas or more generally in the northwestern Mediterranean Sea (Ferrari et al., 2000; Babin et al., 2003; Vignudelli et al., 2004). Moreover, with an annual average of total solar radiation of 162 W m−2 (Ruiz et al., 2008), the western Mediterranean basin is characterized by relatively high solar radiation lev-els due to its weak cloud cover (Vasilkov et al., 2001; Seck-meyer et al., 2008; Cristofanelli and Bonasoni, 2009; The MERMEX Group, 2010). High surface irradiances coupled to a strong penetration of UV and visible radiation (Tedetti and Semp´er´e, 2006 and references therein; Joux et al., 2009) could impact the CDOM content as well as primary produc-tivity in the surface waters of the Mediterranean Sea.
Here we report CDOM absorbance and fluorescence data from a one-year time series in the Bay of Marseilles. This study aims to better understand coastal surface CDOM dis-tribution and dynamics of the Mediterranean Sea. Origins as well as seasonal variation of CDOM are discussed consider-ing the potential influence of Rhˆone River plume.
2 Materials and methods
2.1 Study site and sample collection
From November 2007 to December 2008, surface seawater samples (2 and 5 m depths) were collected monthly close to solar noon on board the R/V Antedon II at the ob-servation station of the Oceanology Center of Marseilles: SOFCOM. This coastal station is located 5 km off Mar-seilles in the northwestern Mediterranean Sea (Fig. 1) and is one of the French Service d’Observation en Mi-lieu LITtoral (SOMLIT, http://www.domino.u-bordeaux.fr/ somlit national/) coastal stations, which have been regu-larly sampled (twice a month) for 13 years. Samples were collected using Niskin bottles equipped with Teflon-O-ring and silicon tubes. Surface irradiance (Es(λ) in µW cm−2) measurements in the UV (305, 325, 340, 380 nm) spectral
J. Para et al.: Fluorescence and absorption properties of chromophoric dissolved organic matter (CDOM) 4085 43 1013 1014 100
1
2
3
Gulf
of
Lions
1015Fig. 1. Map of the Bay of Marseilles marking the location of SOFCOM station (black dot 1) 1016
in the Bay of Marseilles, the two Rhône Estuary stations (black dot 2) and Arles station (black 1017
dot 3). Distance separating SOFCOM station from Rhône River Estuary is around 40 Km. 1018
Fig. 1. Map of the Bay of Marseilles marking the location of SOF-COM station (black dot 1) in the Bay of Marseilles, the two Rhˆone Estuary stations (black dot 2) and Arles station (black dot 3). Dis-tance separating SOFCOM station from Rhˆone River Estuary is around 40 Km.
domain were also performed using OCR-504 downward irra-diance sensors on the ship’s deck. During this study period, water samples were also collected at 2 m depth in the Rhˆone River at Arles station, and from 2 and 5 m depths at two stations in the Rhˆone River Estuary during the CHACCRA-plume cruise (May 2008) (Fig. 1).
For TOC determination, samples were directly transferred from the Niskin bottle into precombusted (6 h at 450◦C) ampoules, immediately acidified with 85% of H3PO4 (final pH∼2) and flame sealed without filtration. For the deter-mination of CDOM optical properties (absorbance and fluo-rescence), samples were transferred from Niskin bottles into
10% HCl washed and precombusted (6 h at 450◦C) glass bottles and stored in the dark. Samples were brought back to the laboratory, filtered in dim light through precombusted 0.7 µm GF/F filters, which had been pre-rinsed with Milli-Q water and sample, and then through 0.2 µm Nuclepore poly-carbonate filters, presoaked in 10% HCl solution and rinsed with Milli-Q water and with sample according to the SeaW-iFS protocols (Mueller and Austin, 1995). Filtered samples were kept in the dark at room temperature (24 h maximum) until absorbance and fluorescence analyses. During the study period, in situ hydrological context was determined at least twice a month by the Service d’Observation of the Oceanol-ogy Center of Marseilles by using a SeaBird Electronics 19 plus conductivity temperature depth (CTD) profiler. In ad-dition, from February 2008 onwards, the hydrological data set was completed with a SeaBird Electronics 19 plus CTD equipped with chlorophyll-a (Chl-a) fluorometer (WET Labs Inc.) deployed during our sampling.
2.2 CDOM optical properties 2.2.1 Absorbance measurements
Absorbance of CDOM was measured throughout the UV and visible spectral domains (280–700 nm) using the mul-tiple pathlength, liquid core waveguide system Ultrapath (MPLCW, WPI Inc.). Absorbance spectra of marine and freshwater samples were measured through 2 m and 50 cm long pathlengths, respectively. Marseilles’ Bay (SOFCOM station) and Rhˆone plume (marine) samples were analysed with reference to a filtered salt solution prepared with Milli-Q water and precombusted NaCl (Sigma) reproducing the refractive index of samples to minimize baseline offsets in absorption spectra induced by the effect of salinity changes between sample and the corresponding reference (D’Sa et al., 1999). Rhˆone River (freshwater) samples were analyzed with reference to filtered Milli-Q water. Reference salt solu-tion and samples were brought to room temperature before analysis. Between each sample, the sample cell was flushed with successively diluted detergent (cleaning solution con-centrate, WPI Inc.), high reagent grade MeOH, 2 M HCl and Milli-Q water. Cleanliness of the sample cell was checked by comparing with a reference value for the transmittance of the reference salt solution. Trapped microbubbles were minimized by using a peristaltic pump to draw the sam-ple into the samsam-ple cell. The spectral absorption coeffi-cients, aCDOM(λ)(m−1) were obtained using the following relationship, aCDOM(λ) =2.303 A(λ)/L, where A(λ) is the absorbance at wavelength λ (dimensionless) and L is the pathlength in meters. All samples that had an absorbance value above 0.2 at 300 nm for a 10 cm cell were corrected for the inner filter effect according to the formula proposed by Ohno (2002). Value of spectral slope of CDOM ab-sorption (SCDOM) has most often been determined using an exponential regression (Jerlov, 1968; Bricaud et al., 1981)
but non-linear regression fitting provides a better estimate of SCDOM, by weighting regions of higher CDOM absorption (Stedmon et al., 2000). Here, SCDOM was determined af-ter applying a non-linear exponential regression to original aCDOM(λ)data measured on the range 350–500 nm. All the determination coefficients (R2) calculated from these expo-nential fits were always >0.99. SCDOMprovides information concerning CDOM origin (terrestrial versus marine), with generally lower slopes in fresh and coastal waters than in the open ocean due to the presence of marine humics and new biological CDOM (Ferrari et al., 2000; Blough and Del Vec-chio, 2002). Additionally, higher SCDOMhave been reported for photobleached CDOM (Vodacek et al., 1997).
2.2.2 Fluorescence measurements
For fluorescence measurements, performed monthly, from June 2008 to December 2008, samples were transferred into a 1 cm pathlength far UV silica quartz cuvette (170–2600 nm; LEADER LAB), thermostated at 20◦C, and analyzed with a Hitachi (Japan) Model F-7000 spectrofluorometer. Instru-ment settings, measureInstru-ment procedures and spectral correc-tion procedures are fully described in Tedetti et al. (2010). Briefly, the correction of spectra for instrumental response was conducted according to the procedure recommended by Hitachi (Hitachi F-7000 Instruction Manual). First, the Ex instrumental response was obtained by using Rhodamine B as standard and a single-side frosted red filter in Ex scan mode. Then, the Em side calibration was done with a dif-fuser in synchronous scan mode. The Ex and Em spectra obtained over the range 200–600 nm were applied internally by the instrument to correct subsequent spectra. EEMs were generated over Ex wavelengths between 200 and 550 nm in 5 nm intervals and Em wavelengths between 280 and 600 nm in 2 nm intervals, with 5 nm bandwidths (FWHMs) on both Ex and Em sides and a scan speed of 2400 nm min−1. Milli-Q water as well as solutions of quinine sulphate (Fluka) in 0.05 M H2SO4(1–10 ppb) were run with each set of samples. Before being processed, all the data (blanks, standards, sam-ples) were normalized to the intensity of the Raman scatter peak at Ex/Em: 275/303 nm (5 nm bandwidths) of pure water (Coble et al., 1993; Coble, 1996; Belzile et al., 2006), which varied by less than 4% over the study period. Samples were then corrected for the corresponding blanks and converted into quinine sulphate units (QSU). EEM data processing and contour plots were conducted with MATLAB 7.1.
Besides the identification of common fluorescent peaks by the traditional “peak picking” technique (examination of Ex and Em spectra), we determined two indices: the humifica-tion index (HIX) and the biological index (BIX). HIX was introduced on the basis of the position of the emission spec-tra in order to estimate the degree of maturation of DOM in soil (Zsolnay et al., 1999). It is the ratio (H /L) of two areas of emission spectrum from excitation at 254 nm (here 255 nm). These two areas are calculated between 300 and
345 nm (here, between 300–346 nm) for L and between 435 and 480 nm (here, between 434–480 nm) for H . In natural aquatic ecosystem (Gironde and Seine estuaries and Mediter-ranean Sea), high values of HIX (10–16) illustrated the pres-ence of strongly humic organic material (terrestrial origin), whereas low values (<4) represent authochtonous organic material (Huguet et al., 2009). BIX allows the determina-tion of the presence of the marine humic-like peak (peak M), which reflects autochthonous biological activity (Huguet et al., 2009). It is calculated at Ex = 310 nm, by dividing the fluorescence intensity at Em = 380 nm (maximum of M peak) by the fluorescence intensity at Em = 430 nm, which corresponds to the maximum of peak C. High values of BIX (>1) correspond to a biological origin and lowest values (<1) illustrate low abundance of organic matter of biologi-cal origin (Huguet et al., 2009). Analytibiologi-cal errors of these indices were within 5%.
2.3 TOC analysis
The Shimadzu instrument used in this study is the com-mercially available model TOC-5000 Total Carbon Analyzer with a quartz combustion column filled with 1.2% Pt on silica pillows. Several aspects of our modified unit have been pre-viously described (Sohrin and Semp´er´e, 2005). The accuracy and the system blank of our instrument were determined by the analysis of the reference material (D. Hansell, Rosenstiel School of Marine and Atmospheric Science, Miami, USA) including Deep Atlantic Water (DAW) and low carbon water (LCW) reference standards. The average DOC concentra-tions in the DAW and in the LCW reference standards were 45 ± 2 µM C, n = 24 and 1 ± 0.3 µM C, n = 24, respectively. Carbon levels in the LCW ampoules were similar to and of-ten higher than the Milli-Q water produced in our laboratory. The nominal analytical precision of the analysis procedure was within 2%.
2.4 Remotely sensed data
Remotely sensed images of SST and Chl-a concentration (Fig. 2) were obtained by applying respectively the long-wave SST algorithm and the OC5 coastal-oriented optical algorithm (Gohin et al., 2002, 2005) to water leaving irradi-ances derived from the Moderate Resolution Imaging Spec-troradiometer (MODIS) sensor. Accuracy of the OC5 algo-rithm applied to the Rhˆone River plume region has been esti-mated to be 40% absolute percentage of difference by com-paring 332 in situ and co-localized remotely sensed values of Chl-a concentrations using the Sea-viewing Wide Field of View Sensor (SeaWiFS) (Fontana et al., 2009).
44
1
2
(a)
(b)
Nov. 07Dec. 07 Jan. 08 Feb. 08 Mar. 08Apr. 08May. 08Jun. 08 Jul. 08 Aug. 08 Sept. 08Oct. 08 Nov. 08
N D J F M A M J J A S O N 10 20 30 40 50 10 20 30 40 50 13 22 14 16 18 20 38.25 38 37.75 37.5 37.25 37 D ep th (m ) D ep th (m ) (a) (b) [ C] Salinity Temperature
°
(a) (b)
(c)
N D J F M A M J J A S O N SST 23/06/2008 (a) SST 7/05/2008 (b) [ C] [ C] SOFCOM (b)°
°
Chlorophyll 7/05/2008 (a) Chlorophyll 23/06/2008 [µg.l-1](c)
(c)
(b)
(b)
(a)
SOFCOM SST 29/04/2008(a)
Chlorophyll 29/04/2008 [ C]1019
Fig. 2. Top panels: Temporal evolution of temperature and salinity at SOFCOM station from
1020
November 2007 to December 2008 from surface to bottom. Data come from CTD profiles
1021
carried out twice a month by the SOMLIT network (n = 30) and completed since February
1022
2008 by CTD data acquired on sampling dates (n = 11). Bottom panels: remotely sea surface
1023
temperature (SST) and chlorophyll concentrations are from the points in the time series
1024
labeled (a), (b) and (c) corresponding respectively to the sampling date 29 April
(non-1025
intrusion of Rhône plume), 7 May and 23 June 2008 (intrusion of Rhône plume). Remotely
1026
SST and Chlorophyll concentrations from satellite images were obtained respectively by
1027
applying the long-wave SST algorithm and the OC5 coastal-oriented optical algorithm (Gohin
1028
et al., 2002; 2005) to water leaving irradiances derived from the Moderate Resolution Imaging
1029
Spectroradiometer (MODIS).
1030
Fig. 2. Top panels: temporal evolution of temperature and salinity at SOFCOM station from November 2007 to December 2008 from surface to bottom. Data come from CTD profiles carried out twice a month by the SOMLIT network (n = 30) and completed since February 2008 by CTD data acquired on sampling dates (n = 11). Bottom panels: remotely sea surface temperature (SST) and chlorophyll concentrations are from the points in the time series labeled (a), (b) and (c) corresponding respectively to the sampling date 29 April (non-intrusion of Rhˆone plume), 7 May and 23 June 2008 (intrusion of Rhˆone plume). Remotely SST and Chlorophyll concentrations from satellite images were obtained respectively by applying the long-wave SST algorithm and the OC5 coastal-oriented optical algorithm (Gohin et al., 2002, 2005) to water leaving irradiances derived from the Moderate Resolution Imaging Spectroradiometer (MODIS).
2.5 Irradiation experiment on Rhˆone River water
A kinetic irradiation experiment was carried out on a Rhˆone River sample collected at Arles station on 7 February 2009 (2 m depth). The 0.2 µm filtered solution was dis-tributed in 50 ml precombusted (450◦C, 6 h) quartz tubes
and placed in thermostated bath at 13◦C. Samples were ex-posed to a simulated sunlight using a Suntest CPS + solar simulator (Atlas, GmbH) in Full Sun (FS) light condition (i.e., FS = PAR + UVB + UVA) giving an optical output of 700 W m−2. Exposure for 2.8 h at this intensity corre-sponds to a natural daily (12 h) dose received in the Western
Mediterranean Basin by taking an annual average of total so-lar radiation of 162 W m−2(Ruiz et al., 2008). Samples were irradiated in duplicate during 8 (T1) and 20 h (T2) which cor-responds to 3 and 7 days of natural solar irradiation, respec-tively. Simultaneous dark control (quartz tube wrapped in black bag) was performed under the same conditions.
3 Results
3.1 Hydrological context and trophic status
During winter and fall periods, the action of winds mixed entirely the water column of Marseilles Bay (60 m depth). The general trend observed from the surface to the bottom during this stormy period was a salinity around 38.1–38.2 and a temperature decreasing from 18 to 15◦C in fall and from 15 to 13◦C in winter (Fig. 2). These are the typi-cal values recorded for the northwestern Mediterranean Sea (Brasseur et al., 1996). At the beginning of spring, the en-tire water column was still well mixed and exhibited a tem-perature and a salinity corresponding to those observed dur-ing winter (Fig. 2). Durdur-ing May, water began warmdur-ing (16– 17◦C) causing the formation of a thermocline around 40 m depth. Early in May, an intrusion of a less salty water mass (37–37.8) was observed in the upper 10 m. The low salin-ity surface water mass, perhaps coupled with physical forc-ing, seems to have also impacted the salinity signature of the deepest water because the salinity of the latter was <38 down to 45 m, whereas the salinity value of deeper Mediterranean water masses are usually close to 38.3 (Brasseur et al., 1996). At the end of June, another important surface intrusion of low salinity water occurred with a salinity ranging from 37.3 to 37.8 and a temperature ranging from 21.5 to 18◦C between 1 and 30 m depth, respectively. As for the previous low salin-ity intrusion, this one also appeared to influence the salinsalin-ity signature of deeper water masses.
These two surface intrusions of low salinity water were also identified by remotely sensed pictures of SST and Chl-a concentration on 7 May 2008 (nearest date available cor-responding to the sampling date 6 May 2008) on 23 June 2008 (sampling date) and were shown on Fig. 2 (insets b and c). These remotely sensed pictures plus those available en-compassing sampling dates (not shown) illustrate clearly that surface inputs of freshwater observed on 6 May 2008 and on 23 June 2008 in Bay of Marseilles came from the eastward extent of the Rhˆone River plume. In order to have an esti-mate of the spreading time of the Rhˆone River plume, suc-cessive satellite pictures were used to track the plume. Using the ones encompassing the Rhˆone River plume intrusion ob-served on 6 May 2008, we estimated the spreading time to be on the order of 2–3 days, which is in good agreement with the time scale determined by Fontana et al. (2010).
In July, 3 consecutive days of wind from north (Mistral wind) mixed the water column, removing all signs of the Rhˆone River plume and resulting in a cooling (14–15◦C) coupled to an increase of salinity (38.1) of surface waters (Fig. 2). Sea surface temperature dropped to 16.5◦C at 1 m depth, which is a specific feature of the Bay of Mar-seilles during stratification period under Mistral wind influ-ence. The last part of summer (August) was more common with the re-establishment of the thermocline around 15–20 m depths separating warm (18–23◦C) and salty (38.2) surface waters from cold deep waters (14–18◦C) of slightly lower salinity (38). At the end of summer (23 September 2008), a warm (21–22◦C) high salinity (>38.4) water mass was ob-served from a depth of 20 m to the surface which was re-placed on 14 October 2008 by a shallower low salinity wa-ter mass (37.6) in the upper 3 m due to intense rains. Other slightly less saline water masses in surface were observed at the end of November 2007 and early in December 2008 but during these windy periods, surface low salinity water masses were attenuated and disappeared rapidly due to the mixing (Fig. 2).
In early May and at the end of June 2008, the influence of the eastward extent of the Rhˆone River could have in-creased nitrate concentrations within the plume along a gra-dient of salinity (10–36) from 90 to 15 µM (Pujo-Pay et al., 2006) as well as others nutrients to lesser extent. Phytoplank-ton biomass in the Bay of Marseilles was enhanced with a value of Chl-a concentration >1µg l−1, while without the in-fluence of the Rhˆone River plume Chl-a concentration re-mained <1µg l−1(Table 1, Fig. 2 insets). In May 2008, sur-face (2 m depth) DOC values decrease from 113±12 µM C in the Rhˆone River to 74–78 µM C in the Rhˆone Estuary. These latest values are lower than those previously reported in the Rhˆone Estuary by Ferrari et al. (2000) (140 µM C).
At SOFCOM station (Table 1), TOC concentrations at both depths studied were similar and were also comparable to DOC concentrations previously reported in open waters of Mediterranean Sea (Doval et al., 1999; Dafner et al., 2001; Santinelli et al., 2002; Semp´er´e et al., 2002; Seritti et al., 2003), with a stable annual mean of 67 ± 7 µM C at 2 m and 63±6 µM C at 5 m. Thus, despite some episodic influence of the Rhˆone River plume, this coastal area exhibited features including Chl-a concentration <1µg l−1and TOC concentra-tion ∼DOC concentraconcentra-tion, which is usually encountered off-shore. It is important to notice that during the period study, this coastal oligotrophic area is subjected to a strong UV sur-face irradiance particularly in spring and summer periods for UVB (305 nm) radiation with surface irradiance (Es) values as high as 4.64 µW cm−2nm−1 for UVB (305 nm) in sum-mer time (Table 1) around solar noon. With the exception of sampling dates that were cloudy, we observed around 10 fold more UVB (305 nm) and 2–3 fold more UVA (325, 340 and 380 nm) radiation in summer and spring compared to fall and winter periods.
T able 1. Absorption coef ficient of CDOM at 350 nm [aCDOM (350)], spectral slope of CDOM (SCDOM ), total or g anic carbon (T OC) concentration, chloroph yll-a concentration (Chl-a ) and mean surf ace irradiance (E s ) in the UVB (305 nm) and UV A (325, 340, 38 0 nm) spectral domains measured during one hour close to solar noon, determined at SOFCOM and Rh ˆone Estuary stations at 2 and 5 m depths and Arles station (Rh ˆone and Rh ˆone irradiation experiment: Rh ˆone Irrad. Exp.) at 2 m depth. aCDOM (350) [m − 1] SCDOM [nm − 1] T OC [µMC] Chl-a [µg l − 1] Es (UV) [µW cm − 2nm − 1] T [ ◦C] Salinity End-member Date 2 m 5 m 2 m 5 m 2 m 5 m 2 m 5 m 305 nm 325 nm 340 nm 380 nm 2 m 5 m 2 m 5 m SOFCOM a 7 No v 2007 0.11 0.1 0.018 0.019 68 62 – – 0 .51 ± 0 .03 12 .78 ± 0 .39 20 .74 ± 0 .59 29 .17 ± 0 .73 17.8 17.8 38.1 38.1 SOFCOM 19 Dec 2007 0.1 0.1 0.017 0.018 60 54 – – 0 .14 ± 0 .01 9 .94 ± 0 .06 17 .13 ± 0 .11 26 .46 ± 0 .11 14.4 14.4 38.2 38.2 SOFCOM 5 Feb 2008 0.11 0.11 0.016 0.015 – 55 0.90 0.92 0 .48 ± 0 .01 15 .72 ± 0 .09 25 .56 ± 0 .17 36 .19 ± 0 .38 13.2 13.2 38.1 38.1 SOFCOM 14 Feb 2008 0.09 0.09 0.018 0.018 78 61 0.20 1.03 0 .42 ± 0 .01 16 .86 ± 0 .08 27 .90 ± 0 .19 38 .81 ± 0 .23 13.2 13.3 38.1 38.1 SOFCOM a 26 Mar 2008 – 0.1 – 0.016 56 59 0.21 0.24 1 .39 ± 0 .03 25 .85 ± 0 .34 39 .09 ± 0 .61 52 .86 ± 0 .98 12.8 12.8 38.1 38.1 SOFCOM 29 Apr 2008 0.11 0.11 0.018 0.020 70 63 0.85 0.89 3 .09 ± 0 .09 36 .62 ± 1 .25 54 .67 ± 2 .29 74 .18 ± 3 .17 14.5 14.4 38.1 38.1 SOFCOM a 6 May 2008 0.13 0.13 0.018 0.018 65 – 1.55 1.69 0 .93 ± 0 .05 12 .83 ± 0 .72 18 .81 ± 1 .08 24 .47 ± 1 .48 16.1 16.0 37.1 37.3 SOFCOM a 9 Jun 2008 0.11 0.1 0.022 0.023 70 61 0.77 0.86 2 .26 ± 0 .09 27 .87 ± 1 .07 40 .55 ± 1 .65 53 .69 ± 2 .57 17.2 17.0 37.9 38.0 SOFCOM 23 Jun 2008 0.12 0.11 0.026 0.026 79 76 1.42 1.33 4 .64 ± 0 .06 39 .14 ± 0 .25 56 .51 ± 0 .43 77 .51 ± 0 .81 21.4 20.8 37.5 37.5 SOFCOM b 10 Jul 2008 0.09 0.09 0.023 0.023 67 68 0.19 0.20 4 .06 ± 0 .09 40 .14 ± 0 .92 58 .88 ± 1 .35 79 .62 ± 1 .69 18.6 17.7 37.9 37.9 SOFCOM a 23 Sep 2008 0.07 0.06 0.021 0.023 72 67 0.40 0.45 1 .13 ± 0 .12 15 .92 ± 1 .64 23 .38 ± 2 .62 30 .98 ± 4 .06 22.2 22.1 38.4 38.4 SOFCOM b 14 Oct 2008 0.09 0.09 0.018 0.018 70 67 0.33 0.35 1 .17 ± 0 .01 19 .58 ± 0 .08 30 .08 ± 0 .27 43 .75 ± 0 .51 19.4 19.4 38.2 38.2 SOFCOM 25 No v 2008 0.13 0.13 0.014 0.014 55 56 0.58 0.56 0 .32 ± 0 .01 13 .73 ± 0 .01 22 .88 ± 0 .01 33 .78 ± 0 .01 15.3 15.3 38.2 38.2 SOFCOM a 4 Dec 2008 0.11 0.1 0.017 0.019 63 65 0.76 0.96 0 .18 ± 0 .01 7 .34 ± 0 .30 11 .65 ± 0 .48 15 .28 ± 0 .62 16.1 16.1 38.1 38.1 Rh ˆone Estuary c 22 May 2008 0.25 0.09 0.019 0.021 74 71 – – – – – – 16.8 17.4 33.5 37.9 Rh ˆone Estuary c 23 May 2008 0.33 0.09 0.017 0.024 78 67 – – – – – – 16.7 17.6 29.9 37.7 Rh ˆone (Arles) 17 Jan 2008– 2 .42 ± 1 .05 – 0 .017 ± 0 .001 – 136 ± 38 – – – – – – – – – – – (n = 14) c 18 No v 2008 Rh ˆone Irrad. Exp. c T0 3.11 – 0.018 – 163 – – – – – – – – – – – Rh ˆone Irrad. Exp. c Dark control 3.12 – 0.018 – 157 – – – – – – – – – – – Rh ˆone Irrad. Exp. c T1 duplicate 2 .23 ± 0 .09 – 0 .018 ± 0 .001 – 158 ± 2 – – – – – – – – – – – Rh ˆone Irrad. Exp. c T2 duplicate 1 .17 ± 0 .05 – 0 .018 ± 0 .000 – 150 ± 0 – – – – – – – – – – – aCloudy day bSea mist cF or Rh ˆone Estuary , Rh ˆone and Rh ˆone Irrad. Exp. end-members, DOC concentration w as measured in place of T OC concentration. www.biogeosciences.net/7/4083/2010/ Biogeosciences, 7, 4083–4103, 2010
3.2 CDOM absorbance
The aCDOMat 350 nm was chosen for describing changes in CDOM quantity, and SCDOMto differentiate CDOM quality (Table 1). In the Bay of Marseilles (SOFCOM station), the annual mean values of aCDOM(350) at 2 and 5 m depths were comparable and very low (0.10 ± 0.02 m−1) with regard to the entire range of the aCDOM(350) found in the literature for diverse aquatic environments (i.e. 0.046–29.9 m−1) (Kowal-czuck et al., 2003) and thus were more similar to those found offshore. The aCDOM(350) maximum value of 0.13 m−1at 2 and 5 m was observed under Rhˆone River plume influence (6 May 2008) and during the fall mixing period (25 November 2008), right after 12 consecutive days of Mistral wind that initiated a strong mixing of the entire water column. By con-trast, aCDOM(350) minimum value at 2 m (0.07 m−1) and 5 m (0.06 m−1) occurred at the end of summer time (23 Septem-ber 2008) (Table 1), when the highest salinity (>38.4) and high temperature (22◦C) water was observed (Fig. 2). Since no significant seasonal trend of aCDOM(350) appeared during this period, our results suggest that external influences such as Rhˆone River plume intrusion and mixing events control CDOM surface content and variability in Marseilles coastal area. At Arles station, Rhˆone River’s aCDOM(350) annual mean (2.42 ± 1.05 m−1) was likely higher than the marine one (Table 1). In the Rhˆone River plume, aCDOM(350) was 3–4 fold more important at 2 m compared at 5 m depth. Ir-radiation experiment on the Rhˆone River CDOM induced 30 and 60% losses of aCDOM(350) in T1 and T2 samples com-pared to T0 and dark control, respectively (Table 1).
In the Bay of Marseilles, the annual mean of SCDOM de-termined during this study was 0.019 ± 0.003 nm−1at both depths which is consistent to that previously reported for Oc-tober 1997 at the surface in vicinity of Rhˆone River mouth (0.018 ± 0.003 nm−1) and for surface blue waters of the Gulf of Lions (0.017 ± 0.003 nm−1) by Ferrari (2000). S
CDOM extreme values (2 and 5 m) ranged from 0.014 nm−1on 25 November 2008 to 0.026 nm−1 on 23 June 2008 (Table 1). Seasonal means of SCDOMwere the lowest and comparable during fall and winter periods (SCDOMat 2 and 5 m = 0.017± 0.002 nm−1) while during summer time SCDOMwere signifi-cantly higher (U-Test, p < 5%, n = 3–4) with seasonal mean value reaching 0.023 ± 0.003 nm−1and 0.024 ± 0.002 nm−1 at 2 and 5 m depths, respectively. Spring means of SCDOM were in the middle of the range with 0.020±0.002 nm−1and 0.019 ± 0.003 nm−1at 2 and 5 m depths, respectively.
The SCDOM annual mean of Rhˆone River samples (Ar-les Station) was lower (0.017 ± 0.001 nm−1) than the ma-rine one, whereas no apparent change in SCDOM value pre-sented with a precision in the thousandth was observed af-ter full sun exposure in T1 and T2 samples compared to T0 and dark control samples (SCDOM=0.018 nm−1, Table 1). However, it tended to increase during the irradiation exper-iment (from 0.0175 to 0.0180 nm−1). In addition, this ten-dency was comforted by the slope ratio (SR) values defined
by Helms et al. (2008). SRconsistently increased during irra-diation in relation to the shifts in molecular weight. Indeed, between T0 (initial time) and T2 (final time), SRincreased respectively from a terrestrial value (0.8) to a more typical coastal value (1.36 ± 0.05). Interestingly, in the Rhˆone River plume SCDOMvalues at 2 m depth (0.017–0.019 nm−1) were strongly lower than at 5 m depth (0.021–0.024 nm−1) (Ta-ble 1).
The significant inverse relationship between salinity and aCDOM(350) for the shallowest depth studied (2 m) indicates a theoretical conservative behavior for surface CDOM ab-sorbance (Fig. 3). The CDOM absorption mixing line estab-lished using all SOFCOM data at 2 m depth plus two data points acquired close to the Rhˆone Estuary in the Rhˆone River plume at 2 m depth in May 2008 has an intercept of 1.20 ± 0.06 m−1, which is in the range of that calculated for the Rhˆone River end member at Arles station (2.42 ± 1.05 m−1) (Table 1). Moreover, when data from the Rhˆone River plume are excluded and all the SOFCOM data at both 2 and 5 m depths were used except the extreme values (23 September 2008 and 25 November 2008), another significant inverse relation was observed (p < 1%, n = 11 at 2 m and n =12 at 5 m), with aCDOM(350) = −0.032 ± 0.007 salin-ity +1.33 ± 0.25, which is comparable to the previous calcu-lation. However several data deviate significantly from the regression line. Points above the mixing line in Fig. 3 rep-resent a net production of CDOM. The most important net production of CDOM was associated with low TOC con-centration values (55–56 µMC) and with the lowest SCDOM (0.014 nm−1) values and occurred at both depths during a strong mixing event (25 November 2008). By contrast, the two points that fall far below the mixing line also present the highest salinities (38.4), high temperature (22◦C), high SCDOM values (0.021–0.023 nm−1), as well as moderately high surface irradiance [Es=1.13 µW cm−2nm−1for UVB (305 nm)] and were collected at the end of summer time (23 September 2008).
3.3 CDOM fluorescence
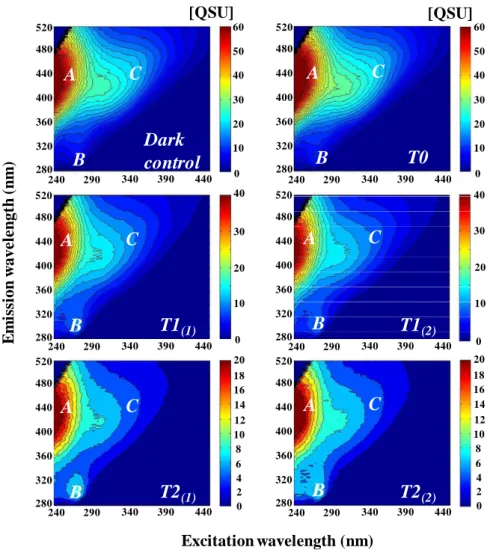
All the fluorescence peaks observed in this study in the Bay of Marseilles (SOFCOM Station) can be summarized from 3 samples showing contrasting hydrological conditions and collected on 23 June 2008 (Rhˆone plume intrusion), 23 September 2008 (photobleached water) and 25 November 2008 (well mixed water). On the other side, the fluorescence peaks determined from Rhˆone River samples (Arles Station) can be observed from the sample collected on 7 February 2009 and used for the irradiation experiment. EEMs for these samples are presented in Figs. 4 and 5 for SOFCOM and Arles samples respectively, while peaks intensities for all samples are reported in Table 2. During the fluores-cence study period (i.e. June 2008–December 2008), in Mar-seilles’ Bay, peak T (tryptophan-like, Ex/Em = 225/340 nm and 275/340 nm) was the major fluorescent peak present
45
0 0,05 0,1 0,15 0,2 0,25 0,3 0,35 0,4 0,45 0,5 29 30 31 32 33 34 35 36 37 38 39 Salinity 0,050 0,070 0,090 0,110 0,130 0,150 37 37,5 38 38,5 25 Nov. 08 14 Oct. 08 14 Feb. 08 10 Jul. 08 5 Feb. 08 23 Sept. 08 4 Dec. 08 29 Apr. 08 6 May 08 aCDOM(350) = -0.029 salinity + 1.199 n = 15 R² = 0.96 0.50 0.45 0.40 0.15 0.13 0.11 0.09 0.07 0.05 37 37.5 38 38.5 0.35 0.30 0.25 0.20 0.15 0.10 0.05 0.00 29 30 31 32 33 34 35 36 37 38 39 aC D O M (3 5 0 ) [m -1]1031
Fig. 3. Relationship between salinity and CDOM absorption at 350 nm (in m
-1) determined at
1032
SOFCOM station at 2 m (red circle, n = 13) and 5 m (blue circle, n = 14) depths. Data from
1033
Rhône Estuary stations collected in May 2008 during CHACCRA cruise at 2 m (red open
1034
circle, n = 2) and 5 m (blue open circle, n = 2) were also plotted. The mixing line (black line)
1035
with its confidence interval at 95% (dashed line) was established using all SOFCOM station
1036
data at 2 m depth (n=13) plus Rhône Estuary stations (CHACCRA cruise data) at 2 m depth
1037
as well (n = 2).
1038
1039
1040
1041
1042
1043
1044
Fig. 3. Relationship between salinity and CDOM absorption at 350 nm (in m−1) determined at SOFCOM station at 2 m (red circle, n = 13) and 5 m (blue circle, n = 14) depths. Data from Rhˆone Estuary stations collected in May 2008 during CHACCRA cruise at 2 m (red open circle, n = 2) and 5 m (blue open circle, n = 2) were also plotted. The mixing line (black line) with its confidence interval at 95% (dashed line) was established using all SOFCOM station data at 2 m depth (n = 13) plus Rhˆone Estuary stations (CHACCRA cruise data) at 2 m depth as well (n = 2).
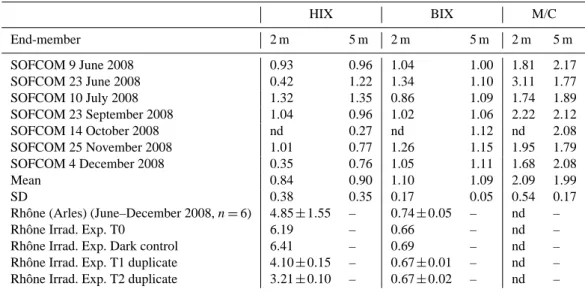
(6.45 ± 8.25 QSU at 2 m depth and 1.94 ± 0.93 QSU at 5 m depth), followed by peak M (UVA marine humic-like, Ex/Em = 290–310/370–410 nm) with a mean value of 2.38 ± 2.15 QSU at 2 m depth and 1.74 ± 1.65 QSU at 5 m depth, and peak C (UVA humic-like Ex/Em = 320–360/420– 460 nm) which was the least intense (1.10 ± 0.99 QSU at 2 m depth and 0.93 ± 0.95 QSU at 5 m depth). Peak B (tyrosine-like, Ex/Em = 225/305 nm and 275/305 nm) was found only on 23 June 2008. The most striking feature about all EEMs is the lack of peak A (UVC humic-like, Ex/Em = 260/400– 460 nm) for marine samples which was not the case for Rhˆone River samples. The Rhˆone River fluorescent CDOM had a strong terrestrial signature (humic-like components, peaks A and C). Indeed, the peak A was the major fluores-cent peak with an annual mean value of 43.09 ± 18.93 QSU, followed by peaks C (16.91 ± 7.98 QSU), and B (7.96 ± 0.82 QSU). However this fluorescent terrestrial signature de-creased strongly after irradiation exposure as suggest the ir-radiation experiment results (Fig. 5 and Table 2). Indeed at T1 and T2, the intensity of peaks A and C was divided by 3 and 4.5 respectively compared to the ones determined at T0 and dark control, while the intensity of peak B remained constant.
For Marseilles’ Bay samples, maximum fluorescence in-tensities of peaks C, M and T (Table 2) at both depths oc-curred on 25 November 2008, during a strong mixing event enhanced by 12 consecutive days of Mistral wind and dur-ing a Rhˆone River plume extent event observed on 23 June 2008. For all other samples, all peak intensities were stable and low, especially in summer as observed on 10 July 2008 (despite the minor mixing event due to 3 consecutive days of Mistral wind) and 23 September 2008 (Table 2). The sample from 23 September 2008 showed a strong fluorescence sig-nal in short Ex/Em wavelengths at both depths and possibly a slight signal of peak T as well (Fig. 4). This kind of signal at short wavelengths has been previously observed in strongly photobleached samples (P. Coble, unpublished data, 1998).
In contrast to the significant apparent relationship between surface aCDOM(350) and salinity, there was only a weak in-verse relationship (p < 5%, n = 6, R2=0.69 and 0.67 for peaks C and M respectively, data not shown) between fluo-rescence of peaks C and M (Table 2) and salinity at 5 m depth when excluding the maximum values (25 November 2008). This result indicates that fluorescent CDOM character in the surface water is mainly driven by other processes than water mixing and thus highlights the dissimilar trends in CDOM absorption and fluorescence properties.
46
T
T
B B
M
C
T
T
M
C
250 300 350 400 450 0 8 12 16 20 4 0 5 10 15 0 2 3 5 6 1 4 Excitation wavelenght (nm) 200 250 300 350 400 450 280 320 360 400 440 480 520 200 250 300 350 400 450 280 320 360 400 440 480 520 200 250 300 350 400 450 280 320 360 400 440 480 520 [QSU]T
T
B
B
M
C
T
T
T
T
M
C
[QSU] 4 6 8 10 2 0 8 12 16 20 4 0 200 250 300 350 400 450 280 320 360 400 440 480 520 280 320 360 400 440 480 520 0 8 12 16 20 4 E m is si o n w a v el e n g h t (n m ) 200 250 300 350 400 450 200 250 300 350 400 450 280 320 360 400 440 480 520 200 250 300 350 400 4502 m
2 m
2 m
5 m
5 m
5 m
E m is si o n w a v el e n g th (n m )1
2
3
?
?
Excitation wavelength (nm)
E
m
is
si
o
n
w
a
v
e
le
n
g
th
(n
m
)
2 3 J u n e 2 0 0 8 (R h ô n e p lu m e in tr u si o n ) 2 3 S e p te m b e r 2 0 0 8 (p h o to b le a ch e d w a te r) 2 5 N o v e m b e r 2 0 0 8 (w e ll m ix e d w a te r )1045
Fig. 4. 2-D EEM contour plots of CDOM (in QSU) collected in the Bay of Marseilles
1046
(SOFCOM station) at 2 (left panels) and 5 m depths (right panels) on 23 June (upper panels),
1047
23 September (middle panels) and 25 November 2008 (bottom panels). These spectra
1048
illustrated fluorescent peaks positions observed during this study. Corresponding peaks
1049
fluorescence intensities are reported on Table 2. On middle panels, question marks indicate a
1050
possible slight signature of the peak T.
1051
1052
1053
1054
Fig. 4. 2-D EEM contour plots of CDOM (in QSU) collected in the Bay of Marseilles (SOFCOM station) at 2 (left panels) and 5 m depths (right panels) on 23 June (upper panels), 23 September (middle panels) and 25 November 2008 (bottom panels). These spectra illustrated fluorescent peaks positions observed during this study. Corresponding peaks fluorescence intensities are reported on Table 2. On middle panels, question marks indicate a possible slight signature of the peak T.
HIX and BIX values determined for marine (SOFCOM) and freshwater (Arles) samples are presented on Table 3. During the study period, for SOFCOM samples at both depths, HIX values were low and variable with 0.84 ± 0.38 and 0.90 ± 0.35 at 2 m and 5 m depths, respectively, while BIX values were high and stable: 1.10 ± 0.17 and 1.09 ± 0.05, respectively. These results suggest a predominantly au-tochthonous origin of DOM in surface marine waters. BIX maximum values were observed at 2 m depth on 23 June 2008 and 25 November 2008 while the lowest one was observed on 7 July 2008 at 2 m depth. This date corre-sponded also at the maximum values observed at both depths for HIX. At Arles station, Rhˆone River CDOM likely con-tains compounds of higher molecular weight compared to marine CDOM. Indeed, high HIX values (4.85 ± 1.55) and low BIX values (0.74 ± 0.05) suggest a predominantly al-lochthonous origin of DOM. The high variability of HIX (CV = 32%), which is the ratio of H /L, for these
freshwa-ter samples came from the variability concerning the pres-ence of complex high molecular weight components (i.e., H , CV = 41%), while low molecular weight components part re-mained more steady (i.e., L, CV = 13%). The Rhˆone River irradiation experiment shows a strong decrease in HIX at T1 and T2 triggered by H value decreased (H = 1433, 1326, 810 ± 44 and 426 ± 15 QSU at T0, Dark control, T1 and T2, respectively) while corresponding BIX remained con-stant (Table 3), due to an alteration in similar proportion of humic-like components, compared to T0 and dark control. Such results, strong decrease of HIX (∼50%) coupled to a constant BIX between T0 (initial time) and T2 (final time) underline the higher photosensitivity feature of high molec-ular weight DOM (i.e. humic-like components) compared to low molecular weight DOM (i.e. protein-like components) (Table 2).
47
280 320 360 400 440 480 520Dark
control
T1
(1)T2
(1)E
m
is
si
o
n
w
a
v
e
le
n
g
th
(n
m
)
Excitation wavelength
280 320 360 400 440 480 520 280 320 360 400 440 480 520 240 290 340 390 440 240 290 340 390 440 240 290 340 390 440A
C
B
A
C
B
A
C
B
T0
T1
(2)T2
(2)Excitation wavelength (nm)
280 320 360 400 440 480 520 280 320 360 400 440 480 520 280 320 360 400 440 480 520 240 290 340 390 440 240 290 340 390 440 240 290 340 390 440A
C
B
A
C
B
A
C
B
Excitation wavelength (nm)
[QSU]
0 10 30 20 40 60 50 0 10 30 20 40 60 50[QSU]
0 10 20 30 40 0 10 20 30 40 0 10 20 2 4 6 8 12 14 16 18 0 10 20 2 4 6 8 12 14 16 181055
Fig. 5. 2-D EEM contour plots of CDOM (in QSU) collected from Rhône River sample,
1056
before (T0: upper panel right), and after a full sun exposure of 8 (T1: middle panels) and 20h
1057
(T2: bottom panels) using solar simulator. Color-bars’ scales are different. Dark control is
1058
indicated in upper panel (left). Corresponding peaks fluorescence intensities are reported on
1059
Table 2.
1060
1061
1062
1063
1064
Fig. 5. 2-D EEM contour plots of CDOM (in QSU) collected from Rhˆone River sample, before (T0: upper panel right), and after a full sun exposure of 8 (T1: middle panels) and 20 h (T2: bottom panels) using solar simulator. Color-bars’ scales are different. Dark control is indicated in upper panel (left). Corresponding peaks fluorescence intensities are reported on Table 2.
Shape of normalized emission spectra to the correspond-ing maximum emission intensity can provide information on the nature as well as on biogeochemical processes affect-ing DOM. Normalized emission spectra of peaks C and M were both determined (Fig. 6) for the 3 marine samples influ-enced by contrasted hydrological conditions (23 June 2008, 23 September 2008 and 25 November 2008) (Fig. 6). Addi-tional normalized emission spectra of the peak C correspond-ing to T0 (initial time), dark control and T2 (final time) of the Rhˆone River sample irradiation experiment were also plotted on Fig. 6. At SOFCOM station, both humic-like peaks (C and M) presented the same pattern at both depths, with the broadest emission spectra observed on photobleached wa-ter samples (23 September 2008) followed by the Rhˆone River intrusion one (23 June 2008) while the narrowest spec-tra were determined during the mixing event (25 November 2008). For the Rhˆone River, emission spectra of peak C were likely broader than the SOFCOM ones. Interestingly,
af-ter irradiation (i.e. T2 sample) corresponding emission spec-tra were widening towards the longer Em wavelengths com-pared to T0 and Dark control.
4 Discussion
4.1 Evidence for a biological origin of CDOM at SOFCOM station
Despite the low and quite stable values of aCDOM(350) de-termined in surface waters of the Bay of Marseilles, the sig-nificant inverse linear relationship observed at both depths between aCDOM(350) and salinity illustrated a theoretical conservative behavior of surface CDOM in this area. This represents the first report of the potential biogeochemical influence of the Rhˆone River plume in this oligotrophic coastal area. Such a strong significant inverse relation-ship between salinity and fluorescent/absorbant CDOM is
T able 2. Fluorescence intensity (in QSU) and peak positions of tyrosine-lik e (B), tryptophan-lik e (T), UV A humic-lik e (C), marine h umic-lik e (M) and UVC humic-lik e (A) determined at SOFCOM (2 and 5 m depths) and Arles station (Rh ˆone and Rh ˆone irradiation experiment: Rh ˆone Irrad. Exp.) at 2 m depth. Emission ranges represent the band from which a mean of fluorescence intensity w as calculated. (n d = not determined). Peak fluorescence intensity (QSU) B C M T A Ex/Em (nm) = 275/300–310 Ex/Em (nm) = 350/430–450 Ex/Em (nm) = 300/380–400 Ex/Em (nm) = 275/330–350 Ex/Em (nm) = 260/430–440 End-member 2 m 5 m 2 m 5 m 2 m 5 m 2 m 5 m 2 m 5 m SOFCOM 9 Jun 2008 nd nd 0 .56 ± 0 .04 0 .57 ± 0 .04 1 .02 ± 0 .06 1 .24 ± 0 .08 1 .70 ± 0 .18 1 .74 ± 0 .13 nd nd SOFCOM 23 Jun 2008 11 .06 ± 0 .81 3 .51 ± 0 .67 1 .40 ± 0 .06 1 .54 ± 0 .08 4 .34 ± 0 .13 2 .73 ± 0 .12 14 .13 ± 1 .57 3 .78 ± 0 .20 nd nd SOFCOM 10 Jul 2008 nd nd 0 .49 ± 0 .03 0 .51 ± 0 .04 0 .85 ± 0 .06 0 .96 ± 0 .06 1 .25 ± 0 .13 1 .46 ± 0 .09 nd nd SOFCOM 23 Sep 2008 nd nd 0 .57 ± 0 .04 0 .42 ± 0 .03 1 .26 ± 0 .07 0 .90 ± 0 .09 2 .77 ± 0 .20 1 .87 ± 0 .09 nd nd SOFCOM 14 Oct 2008 nd nd nd 0 .27 ± 0 .03 nd 0 .55 ± 0 .08 1 .30 ± 0 .18 1 .58 ± 0 .17 nd nd SOFCOM 25 No v 2008 nd nd 2 .99 ± 0 .18 2 .85 ± 0 .22 5 .82 ± 0 .49 5 .11 ± 0 .52 21 .94 ± 2 .66 nd nd nd SOFCOM 4 Dec 2008 nd nd 0 .59 ± 0 .04 0 .34 ± 0 .03 0 .98 ± 0 .05 0 .71 ± 0 .07 2 .08 ± 0 .18 nd nd nd Mean – – 1.10 0.93 2.38 1.74 6.45 1.94 – – SD – – 0.99 0.95 2.15 1.65 8.25 0.93 – – Rh ˆone (Arles) 7 .96 ± 0 .82 – 16 .91 ± 7 .98 – nd – nd – 43 .09 ± 18 .93 – (Jun–Dec 2008, n = 6) Rh ˆone Irrad. Exp. T0 8 .99 ± 0 .76 – 21 .35 ± 0 .33 – nd – nd – 56 .30 ± 0 .72 – Rh ˆone Irrad. Exp. Dark control 7 .12 ± 0 .50 – 19 .71 ± 0 .21 – nd – nd – 53 .60 ± 1 .56 – Rh ˆone Irrad. Exp. T1 duplicate 10 .24 ± 0 .65 – 9 .67 ± 0 .52 – nd – nd – 31 .36 ± 1 .59 – Rh ˆone Irrad. Exp. T2 duplicate 8 .34 ± 0 .58 – 4 .57 ± 0 .21 – nd – nd – 16 .77 ± 0 .22 – Biogeosciences, 7, 4083–4103, 2010 www.biogeosciences.net/7/4083/2010/
Table 3. Values of Humification (HIX; Zsolnay et al., 1999), Biological (BIX; Huguet et al., 2009) indices and the ratio of marine humic-like (Ex/Em = 300/380–400 nm) to humic like (Ex/Em = 350/430–450 nm) (M/C) fluorescence determined at SOFCOM (2 and 5 m depths) and Arles station (Rhˆone and Rhˆone irradiation experiment: Rhˆone Irrad. Exp.) at 2 m depth. (nd = not determined).
HIX BIX M/C End-member 2 m 5 m 2 m 5 m 2 m 5 m SOFCOM 9 June 2008 0.93 0.96 1.04 1.00 1.81 2.17 SOFCOM 23 June 2008 0.42 1.22 1.34 1.10 3.11 1.77 SOFCOM 10 July 2008 1.32 1.35 0.86 1.09 1.74 1.89 SOFCOM 23 September 2008 1.04 0.96 1.02 1.06 2.22 2.12 SOFCOM 14 October 2008 nd 0.27 nd 1.12 nd 2.08 SOFCOM 25 November 2008 1.01 0.77 1.26 1.15 1.95 1.79 SOFCOM 4 December 2008 0.35 0.76 1.05 1.11 1.68 2.08 Mean 0.84 0.90 1.10 1.09 2.09 1.99 SD 0.38 0.35 0.17 0.05 0.54 0.17 Rhˆone (Arles) (June–December 2008, n = 6) 4.85 ± 1.55 – 0.74 ± 0.05 – nd – Rhˆone Irrad. Exp. T0 6.19 – 0.66 – nd – Rhˆone Irrad. Exp. Dark control 6.41 – 0.69 – nd – Rhˆone Irrad. Exp. T1 duplicate 4.10 ± 0.15 – 0.67 ± 0.01 – nd – Rhˆone Irrad. Exp. T2 duplicate 3.21 ± 0.10 – 0.67 ± 0.02 – nd –
typically observed in coastal areas subjected to high river in-puts (Blough et al., 1993; Green and Blough, 1994; Nelson and Guarda, 1995; Højerslev et al., 1996; Nieke et al., 1997; Vodacek et al., 1997; Seritti et al., 1998; Del Castillo et al., 2000; Ferrari, 2000; Stedmon et al., 2000).
By contrast, the lack of correlation between salinity and fluorescence intensities of peaks C and M at 2 m depth (ex-cluding the maximum values, 25 November 2008) and the only weakly significant correlation observed for 5 m depth samples suggest that the Rhˆone River plume is not a domi-nant source of fluorescent CDOM in the Bay of Marseilles. Fluorescent CDOM content in surface waters is likely driven by others processes such as in situ production or photo-oxidation rather than water mixing as already hypothesized by Vignudelli et al. (2004) for coastal waters of the northern Tyrrhenian Sea (Italy). The first of these processes is pho-tobleaching, which has more impact on fluorescence than on absorbance properties (Moran et al., 2000; Nieto-Cid et al., 2006). This phenomenon is likely observed during water stratification, especially during spring and summer periods when UV irradiance is high (Table 1). Therefore, it is very likely that samples collected at the end of summer period (23 September 2008), were strongly photobleached explain-ing the lack (loss) of peaks M and C (Fig. 4). This assump-tion would be consistent with high SCDOM coupled to low aCDOM(350) values (Table 1) that fell beneath the mixing line in Fig. 3, and suggest a net loss of CDOM at this time (i.e. on 10 July 2008 and 23 September 2008). In addition, the lowest specific absorption coefficient (aCDOM(350)/TOC = 0.0010 and 0.0009 at 2 and 5 m depths respectively) was determined at this date too. In situ production is another process that may
modify CDOM fluorescence character. Indeed, phytoplank-ton production (Romera-Castillo et al., 2010), zooplankphytoplank-ton grazing (Coble et al., 1998) and bacterial activity (Stedmon and Markager, 2005) may induce production of fluorescent CDOM through by-products, especially peaks B, T, and M. Primary production and bacterial activity promoted by the Rhˆone River plume intrusion event rich in nutrients (Chl-a concentration >1 µg l−1; on 6 May 2008 and 23 June 2008) may have produced fluorescent CDOM. Finally, the strong mixing observed on 25 November 2008 sample could have injected relatively aged CDOM from the bottom to the face as well as nutrients and thus explain an increase of sur-face CDOM concentrations (Coble et al., 1998; Nelson et al., 2004, Nieto-Cid et al., 2006). Moreover, this humic CDOM showed the highest specific absorption coefficient (aCDOM(350)/TOC = 0.0024 and 0.0023 at 2 and 5 m depths, respectively) at both depths and that could explain the high-est aCDOM(350) determined at this date.
Surface CDOM content in the Bay of Marseilles results, therefore, from the combination of several processes which differentially affect its fluorescence and absorbance proper-ties. In any case, our results put forward that CDOM prop-erties in this area is much more affected by autochthonous production induced by the Rhˆone River plume intrusion than by the original Rhˆone River DOM (i.e. system truly non-conservative).
In Marseilles Bay, during the one year survey, surface CDOM exhibited very low and stable aCDOM(λ) and high variability of SCDOM, highest values being observed dur-ing summer time. Generally such signals as well as low surface TOC concentration and Chl-a concentration are
48
0 0,1 0,2 0,3 0,4 0,5 0,6 0,7 0,8 0,9 1 410 420 430 440 450 460 470 480 490 500 em 420-460 Peak C 2m , Exc= 350 nm 0 0,1 0,2 0,3 0,4 0,5 0,6 0,7 0,8 0,9 1 410 420 430 440 450 460 470 480 490 500 em 420-460 Peak C 5m , Exc= 350 nm 0 0,1 0,2 0,3 0,4 0,5 0,6 0,7 0,8 0,9 1 330 350 370 390 410 430 450 470 490 510 530 Marine humic like 2m0 0,1 0,2 0,3 0,4 0,5 0,6 0,7 0,8 0,9 1 330 350 370 390 410 430 450 470 490 510 530 Marine humic like 5m
(a)
(b)
Emission wavelength (nm) Emission wavelength (nm)
F lu o r e sc en ce F lu o r e sc e n c e 0 0.1 0.2 0.3 0.4 0.5 0.6 0.7 0.8 0.9 1 (c) (d) 410 430 450 470 490 0 0.1 0.2 0.3 0.4 0.5 0.6 0.7 0.8 0.9 1 0 0.1 0.2 0.3 0.4 0.5 0.6 0.7 0.8 0.9 1 0 0.1 0.2 0.3 0.4 0.5 0.6 0.7 0.8 0.9 1 330 370 410 450 490 530 Peak T 25 Nov. 08 23 Jun. 08 23 Sept. 08 25 Nov. 08 23 Jun. 08 23 Sept. 08 25 Nov. 08 23 Jun. 08 23 Sept. 08 T0 and Dark control
T2 (final time)
25 Nov. 08
23 Jun. 08
23 Sept. 08 T0 and Dark control
T2 (final time)
1066
Fig. 6. Normalized emission spectra of peak M at Ex = 300 nm (a and b) and peak C at Ex =
1067
350 nm (c and d) acquired at SOFCOM station on 23 June (Rhône plume intrusion sample,
1068
black solid line), 23 September (photobleached sample, blue solid line) and 25 November
1069
2008 (well mixed sample, green solid line) at 2 (upper panel) and 5 m (bottom panel) depths.
1070
Normalized emission spectra of peak C determined at T0, dark control (red solid line) and T2
1071
(duplicate, orange solid line) of the irradiation experiment performed on Rhône River sample
1072
collected on 7 February 2009 at 2 m depth were also plotted on both panels c and d. These
1073
emission spectra were normalized to the maximum emission intensity in the range 380-400
1074
nm for the peak M and 430-450 nm for the peak C. These spectra were smoothed by a moving
1075
average order 3 which imposes a red shifted of 5 nm.
1076
Fig. 6. Normalized emission spectra of peak M at Ex = 300 nm (a and b) and peak C at Ex = 350 nm (c and d) acquired at SOFCOM station on 23 June (Rhˆone plume intrusion sample, black solid line), 23 September (photobleached sample, blue solid line) and 25 November 2008 (well mixed sample, green solid line) at 2 (upper panel) and 5 m (bottom panel) depths. Normalized emission spectra of peak C determined at T0, dark control (red solid line) and T2 (duplicate, orange solid line) of the irradiation experiment performed on Rhˆone River sample collected on 7 February 2009 at 2 m depth were also plotted on both panels (c) and (d). These emission spectra were normalized to the maximum emission intensity in the range 380–400 nm for the peak M and 430–450 nm for the peak C. These spectra were smoothed by a moving average order 3 which imposes a red shifted of 5 nm.
observed offshore (Blough and Del Vecchio, 2002) or in an oligotrophic coastal area not influenced by river inputs. High SCDOM could reflect either CDOM photobleaching if aCDOM(λ)is low as observed during summer (10 July 2008 and 23 September 2008) or fresh biological CDOM produc-tion in surface waters if aCDOM(λ) is high as observed on 23 June 2008. By contrast, low SCDOMwith high aCDOM(λ) as observed on 25 November 2008 suggest the presence of aged CDOM in surface that could be the consequence of the strong mixing of deep water that was reported at this period. Concerning CDOM fluorescence properties, our study showed the dominance of recent autochthonous compounds (peak T, BIX >1) and extremely low values of humic sub-stances (peaks C and M, HIX≈1) within marine surface CDOM pool. Fluorescence intensity of peak T observed on
all dates (except on 23 June 2008 and 25 November 2008) at 2 and 5 m depths (Table 2) was in accordance to that reported in surface Ise Bay in the Pacific coastal area (Yamashita and Tanoue, 2003). Interestingly, during Rhˆone River plume trusion and mixing events in Marseilles Bay, fluorescence in-tensity of peak T was one order of magnitude higher at 2 m depth (Table 2). The origins of peaks T and M have been at-tributed to planktonic activity (Determann et al., 1998; Myk-lestad, 2000; Nieto-Cid et al., 2006; Romera-Castillo et al., 2010) while the origin of peak C is known to be terrestrial and thus coming from freshwater inputs (Sierra et al., 1997, 2005; Komada et al., 2002). However, peak C which is rela-tively abundant in deep waters could also originate from the humification of marine DOM and thus may reach surface wa-ters during upward mixing events (Coble et al., 1998; Parlanti