Publisher’s version / Version de l'éditeur:
Canadian Geotechnical Journal, 15, 4, pp. 494-500, 1978-11
READ THESE TERMS AND CONDITIONS CAREFULLY BEFORE USING THIS WEBSITE. https://nrc-publications.canada.ca/eng/copyright
Vous avez des questions? Nous pouvons vous aider. Pour communiquer directement avec un auteur, consultez la première page de la revue dans laquelle son article a été publié afin de trouver ses coordonnées. Si vous n’arrivez pas à les repérer, communiquez avec nous à PublicationsArchive-ArchivesPublications@nrc-cnrc.gc.ca.
Questions? Contact the NRC Publications Archive team at
PublicationsArchive-ArchivesPublications@nrc-cnrc.gc.ca. If you wish to email the authors directly, please see the first page of the publication for their contact information.
NRC Publications Archive
Archives des publications du CNRC
This publication could be one of several versions: author’s original, accepted manuscript or the publisher’s version. / La version de cette publication peut être l’une des suivantes : la version prépublication de l’auteur, la version acceptée du manuscrit ou la version de l’éditeur.
Access and use of this website and the material on it are subject to the Terms and Conditions set forth at
Adfreeze strength of frozen sand to model piles
Parameswaran, V. R.
https://publications-cnrc.canada.ca/fra/droits
L’accès à ce site Web et l’utilisation de son contenu sont assujettis aux conditions présentées dans le site LISEZ CES CONDITIONS ATTENTIVEMENT AVANT D’UTILISER CE SITE WEB.
NRC Publications Record / Notice d'Archives des publications de CNRC:
https://nrc-publications.canada.ca/eng/view/object/?id=d087cc08-6424-4b35-bde1-52ca8d55a801 https://publications-cnrc.canada.ca/fra/voir/objet/?id=d087cc08-6424-4b35-bde1-52ca8d55a801
National Research Conseil national Council Canada de recherches Canada
ADFREEZE STRENGTH OF FROZEN SAND TO MODEL PILES
*Q&?%,.,
u<<,4RY
-
JAN
16 1979
Reprinted from
Canadian Geotechnical Journal Vol. 15, No. 4, November 1978 p. 494-500
DBR Paper No. 800
Division of Building Research
Adfreeze strength of frozen sand to model piles
V. R. PARAMESWARAN ,
Geotechnicai Section, Division ofBuiiding Research, National Research Council of Canada, Ottawa, Ont., Canada KIA OR6
Received March 22,1978 i
Accepted July 12, 1978
I
Laboratory measurements of adfreeze strength of Ottawa fine sand to three different types ofmodel piles under constant rates of loading are reported in this paper. Adfreeze strength, rf, at peak load increased with increasing loading rate (i.e., rate of displacement of cross-head of the testing machine), I, and followed a power law
The maximum adfreeze bond strength developed with uncoated wood piles (B.C. fir and spruce). Concrete piles developed adfreeze bond strengths lower than wood but higher than steel and coated piles. Coatings (creosote, paint, etc.) reduced adfreeze bond strength considerably. In decreasing order of adfreeze bond strength, the piles rated asfollows: uncoated B.C. fir, uncoated spruce, concrete, unpainted steel cylindrical and H-sections, creosoted B.C. fir, and, finally, painted steel pipe.
Cet article presente les mesures en laboratoire de la force d'adhision due au gel d'un sable fin d'Ottawa le long de trois differents types de pieux-modeles soumis a une vitesse constante de chargement. La force d'adhesion rf obtenue B la valeur de pic du chargement augmente avec la vitesse du chargement (i.e., la vitesse de diplacement de la t6te de I'appareil), 1, et repond a la loi de puissance
.,
-
imL'adhesion maximale a i t & obtenue sw des pieux de bois sans enduit (sapin el epinette). Les pieux de g t o n ont develop$ une force d'adhesion infkrieure au bois mais sup6rieure a I'acieret aux pieux avec enduil. Les enduils (ckosote, peinture, etc.) ont rkduit considerabltmerrt la force d'ad hesion. Dans I'ordre decroissant de force d'adhesion due au gel. les pieux se classent comrne suit: sapin sans enduir, epinette sans enduit, k t o n , acier non peinture cylindrique ou en sections
H, sapin criosoti et finalement tuyau d'acier peinrur6.
[Traduit par la revue]
Can. Geotech. .I.. 15.494-SOO(1978) Introduction
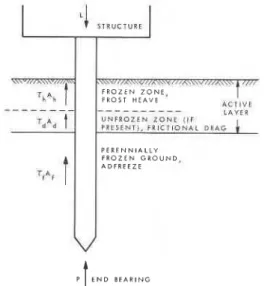
Pile foundations in permafrost areas must be designed to support the load of structures and to resist uplift forces resulting from frost heave in the active layer. The total bearing capacity of a pile is the sum of the contributions of two mechanisms by which it transfers load to the frozen ground: adfreezing or shear along the pilesoil interface, and end bearing. The adfreeze bond or 'grip' of permanently frozen soil to a pile or foundation wall is the major factor that decides the capacity of the ground to withstand the loads imposed on the foundation.
A design value for the end bearing capacity of a piIe can be obtained from the values of the com- pressive strength of the soil, determined under confined and unconfined conditions, and from long- term creep tests (Mel'nikov et al. 1966). It is only significant for piles located on bedrock or con- solidated sand and gravel. In fine textured frozen soils having high ice content, end bearing support is negligible, and hence the bearing capacity of a
pile in ice-rich permafrost arises mainly from ad- freeze strength (Crory 1966).
In
genera!. the foIlowing condition should be met for a pile-supported structure in permafrost:where P is the end bearing capacity of the pile, as determined from the compressive strength of the
soil under the pile, the cross-sectional area of the
bottom end of the pile, and
a
suitable factor of safety; rf is the adheeze strength at the piIe-soil interface; Af is the pile-soil interfacial area in the permafrost zone; m is the frictional drag stress (i.e., skin friction) between the pile and unfrozen soil(if present) in the active layer; Ad is the pile-soil
interfacial area in this zone; L is the structural load, and a combination of several live loads such
as seismic, wind, construction loading, and thermal expansion and wntraction; is the stress due to frost heave in the frozen active layer; and Ah is
the pile-soil interfacial area in the frozen active
layer.
NRCC No. 17010
PARAMESWARAN 4 95 Figure 1 shows schematically the various vertical
forces acting on a pile foundation in permafrost. Adfreeze strength or shearing resistance de- veloped at the pile-soil interface has two com- ponents: that due to adhesion of ice to the pile, and that due to soil grain friction at the pile-soil interface. Factors affecting the value of adfreeze strength are type and gradation of the soil, soil composition, temperature and moisture content of the soil, rate of load application, and nature of the I pile surface.
I Data on the adfreeze strength of soils in contact I with different kinds of piles are very important in
calculating bearing capacity and depth of placement of foundations in frozen ground. Although mea- surements of adfreeze strength between piles and frozen ground have been made since the 1930's, information is not yet adequate for optimal design of foundations. Most of the available data on the bond strength developed as a result of adfreezing of soils to piles have been derived from tests carried out in the field on undisturbed, fine grained soils (Tsytovich 1975; Vyalov 1965). Crory (1966), Crory and Reed (1965), and Sanger (1969) carried out studies of adfreeze strength, pile settlement under loads, and heaving of piles as a result of freeze-back of the active layer in permafrost areas. Penner and Gold (1971 ) and Penner (1974) calculated adfreeze strengths from field measurements of the maximum uplift forces developed by frost action on columns and walls in a seasonal frost area. All these field data have been valuable in developing empirical criteria for design of foundations in frozen ground. As the data avail-
FROST H E A V E
- - -
- - - A C T I V E L A Y E R U N F R O Z E N Z O N E ( I F P K E I i N T I , F I I C T I O F . I A 1 D I A G P E R E N N I A L L Y F R O Z E N G R O U N D , A D F R E E Z EV
E N D B E A R I N GFIG. 1. Schematic representation of forces acting on a pile foundation in permafrost.
able in the literature on the systematic measure- ment of the adfreeze strength under controlled conditions in the laboratory are meagre, however, an experimental program was initiated to evaluate the effects on adfreeze bond strength of various factors such as temperature and moisture content of the soil, rate of loading, and surface charac- teristics of piles, and to study the behaviour of model foundations under short- and long-term loads. This paper reports the results of measure- ments of adfreeze strengths on model piles of wood, steel, and concrete with different surface characteristics in a frozen sand-ice mixture and subjected to a constant rate of loading.
Experimental Procedure
The piles used in the study were B.C. fir, spruce, and creosoted B.C. fir, steel (coated and un- coated), and concrete. Both B.C. fir and local spruce timber piles are widely used in northern Canada, usually with a preservative treatment to protect them against decay in the active layer where they may be subjected to wetting, drying, and bac- terial action. Frequently, B.C. fir piles are pressure creosoted, and spruce may sometimes be given a 'paint-on' coating of a chemical preservative. Very seldom are the surfaces of steel pipe and H-section piles or of precast concrete piles given special treatment.
All the piles tested were cylindrical, except for one H-section steel pile. Each cylindrical pile was 76.2 mm in diameter and 304.8 mm long. The H-section pile was a wide-flange steel H-beam 304.8 mm long with depth of section 101.6 mm, width of flange 100 mm, and thickness of web 6.35 mm.
Pile Preparation
( 1 ) Natural B.C. fir piles were machined to a smooth surface finish.
(2) Some of these machined B.C. fir piles were creosoted in a high pressure autoclave in the Eastern Forest Products Laboratory, Department of Fisheries and Environment, Ottawa. The wood absorbed an average of 96.3 kg.m-3 of creosote; i.e., each pile would absorb about 0.13 kg of creosote.
( 3 ) Spruce piles were machined to a smooth surface finish and no coating was applied.
( 4 ) Concrete piles with a smooth surface finish were made by mixing Sakrete concrete mix with the recommended amount of water (3.4 L ( 3 qt) to a 36.3 kg (80 Ib) sack of mix) so that the finished product exceeded the strength requirement of
496 CAN. GEOTECH. J. VOL. IS, 1978 American Society for Testing and Materials
(ASTM) specification C-387, i.e., 24.1 MPa or 3500 psi). The mix was cast in Plexiglas tubes having an internal diameter of 76.2 mm and wall thickness of 12.7 mm, and vibrated by pneumatic vibrator to eliminate as much occluded air as pos- sible. The concrete was allowed to set in the Plexiglas tube for 2 days. After setting, the tubes were immersed in warm water so that the piles would slip out easily. Each pile remained immersed in water at room temperature for about a week for complete curing. Cured and dried, they had a den- sity of 2250 kg.m-3.
( 5 ) Steel pipe piles made from cold drawn seamless mild steel tubes having an outside diam- eter of 76.2 mm and wall thickness of 6.35 mm were closed at the bottom end with a welded steel plug and at the top by a rubber stopper. They were sandblasted to remove the black oxide coating and painted with a red oxide primer to give a smooth surface finish.
( 6 ) Steel pipes of the same size as those of (5)
were sandbIasted but not painted.
( 7 ) H-section steel piles were lightly sandblasted to remove mill scale from the surface.
Test Method
A schematic diagram of the experimental setup for measuring adfreeze strength under constant rates of displacement is shown in Fig. 2. A model pile ( A ) (cylindrical or H-section) was placed in the middle of a Plexiglas box ( B ) having internal dimensions of 304.8 X 304.8 X 304.8 mm. The box was made from 25.4 mm thick Plexiglas plates and the plug ( C ) and the base ( D ) were of aluminum (see Fig. 2).
Ottawa fine sand (ASTM specification C-109, passing sieve No. 30 and retained on sieve No. 100) mixed with 14% by weight of water was placed and compacted around each pile in five layers, each 38.1 mm thick, to an optimum density of about 1700 kg.m-3, as determined by a stan- dard Proctor test. Mixing was done manually, using a rubber spatula and taking care that there was as much uniformity as possible. Compacting also was done manually, with the base plate (D) of the box resting on a rigid table. After the sand had been compacted, the box containing both pile and wet sand was placed in a cold room (main- tained at -6 2 0.2"C) for 4 days for complete freezing. The temperature of the sand was mea- sured by the thermocouple ( T ) placed in the sand during moulding.
Following complete freezing, the four legs ( F )
FIG. 2. Schematic diagram of experimental setup to measure adfreeze strength under constant rate of cross- head motion: ( A ) pile, 76.2mm ( 3 in.) diameter; ( B ) Plexiglas box; ( C ) plug; (D) base plate; (E) upper com- pression member from Instron load cell; (T) thermocouple; and (F) supporting legs.
were mounted under the base plate (D) and the box was piazed on the rigid base plate of a floor-model Instron testing machine (25 000 kg capacity) installed in a cold room. The plug ( C ) was removed and two direct-current differential transducers (DCDT) were positioned under the box, one to measure movement of the pile and the other to measure deflection of the base plate at a point adjacent to the pile. The initial height of the pile above the frozen sand was measured prior to loading; then the pile was pushed down by a ram
PARAMESWARAN
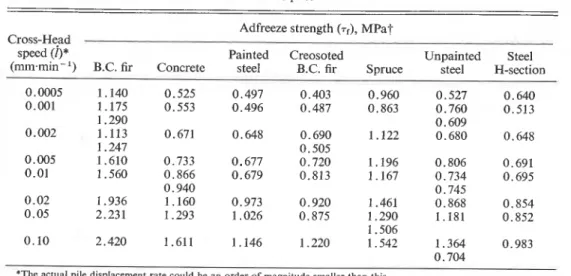
TABLE 1. Values of the peak adfreeze bond strength measured under constant rates of displacement for various piles
- -
Adfreeze strength (4, MPat Cross-Head
speed (I)* Painted Creosoted Unpainted Steel
(rnm.min-') B.C. fir Concrete steel B.C. fir Spruce steel H-section
0.0005 1 . 1 4 0 0.525 0.497 0.403 0.960 0.527 0.640 0.001 1.175 0.553 0.496 0.487 0.863 0.760 0.513 1.290 0.609 0.002 1.113 0.671 0.648 0.690 1.122 0.680 0.648 1.247 0.505 0.005 1.610 0.733 0.677 0.720 1.196 0.806 0.691 0.01 1.560 0.866 0.679 0.813 1.167 0.734 0.695 0.940 0.745 0.02 1.936 1.160 0.973 0.920 1.461 0.868 0.854 0.05 2.231 1.293 1.026 0.875 1.290 1.181 0.852 1 .506 0.10 2.420 1.611 1 .I46 1 .220 1 ,542 1.364 0.983 0.704
'The actual prle displacement rate could be an order of magn~tude smaller than this. t l MPa = 10.2 kgcm-2 = 145.06 psl.
(E), attached to a load cell mounted on the cross- head of the testing machine. Tests were carried out at rates varying between 0.0005 and 0.1 mm.min-l, each test at a constant rate of cross- head movement.
Results
When a pile was loaded at a constant rate of cross-head movement (and presumably constant rate df displacement of pile), the ioad-displace- ment curve was very similar to the stress-strain curves for ice and frozen soil in unconfined com- pression. Figure 3 shows typical load-displacement curves: A for an untreated B.C. fir pile, B for a
D I S P L A C E M E N T , mrn
FIG. 3 . Load-displacement curves for piles in frozen sand: (A) untreated B.C. fir, T = -6OC, cross-head speed = 0.1 mm/min; (B) painted steel, T = -6OC, cross-head speed = 0.1 mm/min; and ( C ) concrete, T = 5.94OC, cross-head speed = 0.02 mm/min.
painted steel pile, and C for a concrete pile. The load reached a peak and then dropped quickly, indicating that the bond between pile and sand had broken. The shape of the post-peak curve depended on pile material and rate of loading. In a few cases, when the rate of loading was greater than 0.02 mm.min-l, the load dropped abruptly after the peak, indicating a clean shear of the pile from the soil. This was especially true for painted steel piles (curve B, Fig. 3 ) . For untreated wood piles the adfreeze bond was enhanced, probably owing to moisture that had penetrated the wood before freezing. This caused a less abrupt loss in strength as the pile was loaded. Concrete piles behaved in the same way (curve C, Fig. 3 ) at lower rates of loading. In general, unpainted steel piles showed better bonding (higher adfreeze bond strength) than painted ones (see Table I ) , due probably to the rougher surface.
The cross-head speed of the Instron testing machine was varied between 0.0005 and 0.10 mm.min-l. The time to reach peak load and the cross-head displacement at peak load are given in
Table 2 for all the piles tested. At a particular displacement rate, peak strength was attained faster for painted steel pipe and creosoted B.C. fir than for the other piles. The displacement at peak load was also smaller for these piles because of their smoother surfaces in comparison with the others. The H-section steel pile had the roughest surface of all, and hence required a long time and a large displacement to attain peak adfreeze strength.
49R CAN. GEOTECH. J. VOL. 15, 1978 CI I-- m 0 0 b W w m "'C? N.? 9
-
.-
& &Z
m m m - m s * 3 8 m y ' wz
w 0 0 m a ; &gE
N g zz m
z
m m 2of the pile with respect to the frozen soil, was much less than the displacement of the cross-head. The Instron cross-head displacement is the sum of the following contributions: ( 1 ) axial elastic deforma- tion of the pile due to applied load, ( 2 ) elastic deformation of the compression ram ( E ) and the four supporting legs (F) shown in Fig. 2, ( 3 ) deflection of the bottom plate ( D ) due to the load, ( 4 ) elastic deformation of the elements of the testing machine itself, and ( 5 ) actual pile displace- ment with respect to the frozen sand.
The relative movement of the pile with respect to the frozen sand was measured as the difference in the readings of the two DCDT's placed below the box. For example, net movement of an un- painted steel pile loaded at a cross-head rate of 0.1 mm.min-l was 0.1 mm, measured at peak load by the DCDT's, whereas the cross-head move- ment at peak load was 0.92 mm. The peak load P was 6300 kg (=63 kN). The approximate values of the various contributions of ( 1 ) to ( 4 ) , above, caused by this load can be determined as follows:
(i) Axial deformation 6 of the pile can be calcu- lated using the equation (Nair et al. 1969)
m
or-:
z z
where p ( h ) is load transferred to the soil along the length of the pile, A is the cross-sectional area of the pile, and E is the modulus of elasticity. Assuming a trianguIar load distribution (Nair et al.
1969, p. 122) for the segment of pile embedded in frozen sand (Fig. 4), the value of 6 for a 76.2 mm od, 6.35 mm wall, tubular steel pile 304.8 mm long and embedded 190.5 mm in sand is
(ii) Deformation of each of the supporting steel rods of length 1 = 203.2 mm and diameter 25.4 mm is
The deformation of the compression ram ( E )
,
PARAMESWARAN 499
L O A D tions ( 1 ) to ( 4 ) from the cross-head movement,
a value of (0.92 - 0.805) = 0.115 mm was ob-
tained for relative movement between pile and frozen sand. This agrees well with the value of 0.1 mm measured directly by the DCDT's.
The peak or maximum adfreeze strength was calculated by dividing the maximum load at the peak of the load-displacement curve by the surface area of contact between the pile and the sand
(Table 1 )
.
Each value represents one test. Owingto the length of time required for freezing and test-
---
- -
ing, duplicate tests were not carried out at each rate. Tests were repeated only where there wasL E N G T H E M B E D D E D I N FROZEN S A N D
I
/
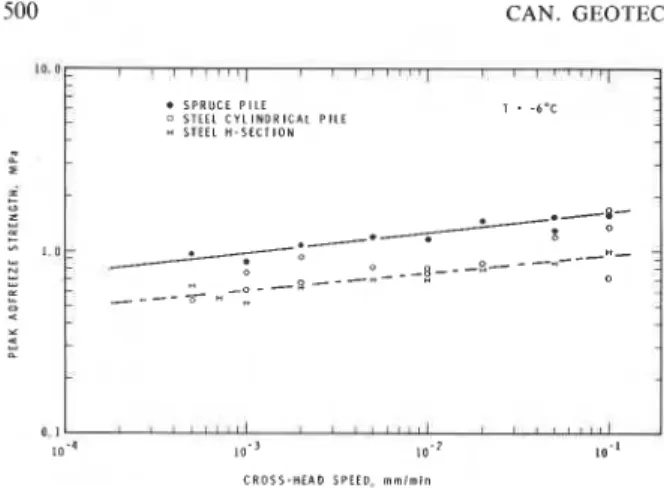
some ambiguity in the result. The peak adfreezestrengths for the various piles are plotted as a function of loading rate on a log-log scale in Figs.
5 and 6.
C Discussion
On a log-log scale the adfreeze yield strength,
7f, at peak load increased approximately linearly
with increasing displacement rate, I, within the
range of displacement rates .investigated. The re-
sults show that T~ varies with I in the following way:
[31
.,
-
imor
FIG. 4. Variation of axial load along length of pile. [41
where n = l / m . (iii) Elastic deflection at the centre of the plate
( D ) due to applied load will be about 0.3 mm, as The values of m and n obtained by linear regres-
calculated from theories of bending of flat plates sion analysis of the data for various piles are:
(Den Hartog 1952).
( i v ) Deflection induced in the machine elements themselves at a load of 6300 kg was about 0.4 mm, obtained by calibration of the machine using a steel cylinder.
After subtracting the sum of the elastic deforma- BC F I R 8 C O N C R E T E 0 P A I N T E D S T E E L 0 C R E O S O T E D BC F I R Material B.C. fir concrete painted steel creosoted B.C. fir unpainted steel natural spruce H-section
The results show that the dependence of ad- freeze strength on rate of displacement has the same power-law form as was observed for the de- formation of sand-ice and ice samples under com- pression and shear, but with a different value for
the exponent n. For example, under uniaxial un-
confined compression, cylindrical samples of frozen sand at -6OC were found to follow an equation
(Parameswaran, unpublished data)
C R O S S - H E A D S P E E D , m m l m i n
where i is the strain rate and o the uniaxial com-
500 CAN. GEOTECH. J. VOL. 15. 1978
I 0 . P - , , , , , , , ,
,
, , , , , . , , , , , ,: ably. In general, for a pile in frozen sand the peak
.
S P R U C E P I L E0 STEEL C Y L I N D R I C A L P l l l 1 . - 6 O C
* STEEL H - S E C T I O N - adfreeze strength measured by short-term tests
under constant loading rates increases with in- creasing rate of displacement of the pile, according
'3
.
- 0 - to a power law given by [3].
..,
.z=
-
.-.
x-
1.0:..,
.
w - - a 8 - - - 0
,--.
---*-:
This is the first of a series of laboratory tests-
-.., M
-;
- -R - - - - carried out in the Division of Building Research,e -
_
-
* 0 Ic,
:
National Research Council of Canada, Ottawa, to-
.% - evaluate adfreeze bond strength and to study the
behaviour of foundations in frozen soils under
O I L ' ' ' " " " ' 1 ' I " ' - " 1 short- and long-term loads. Future tests will in-
IO-O 10.' I,-) vestigate adfreeze strength under constant load
C R O S S - H E A D S P E E D m.i.,n conditions (creep).
FIG. 6. Variation of adfreeze strength with rate of load-
ing for spruce piles and for unpainted cylindrical and Acknowledgements
H-section steel piles. The author gratefully acknowledges helpful dis-
The strain rate dependence of stress in ice has been found to follow a relation of the type:
161 ;
-
where i and a are the strain rate and compressive
strength, respectively, in a uniaxial constant strain rate compression test; or they could be the steady- state creep rate and the corresponding applied stress, respectively, in a constant stress creep test. The value of the exponent n, observed by different authors varied between 1.3 and 4 (Weertman 1973).
For the same rate of cross-head movement, un- coated B.C. fir had the maximum adfreeze strength and creosoted B.C. fir and painted steel had the minimum (Table 1 ) . Spruce piles developed ad- freeze strength slightly lower than that of uncoated B.C. fir, but higher than all others. Concrete piles developed adfreeze bond strength lower than that of untreated wood piles. The uncoated steel cylin- drical as well as H-section piles developed almost the same bond strengths, especially at the higher rates of pile displacement. In general, the piles investigated rated in decreasing adfreeze bond strength in the following order: uncoated B.C. fir, uncoated spruce, concrete, unpainted steel cylindrical and H-sections, creosoted B.C. fir, and finally, painted steel pipe.
Conclusions
Preliminary laboratory investigations of the ad- freeze bond strength developed for wood, steel, and concrete model piles having different surfaces in frozen sand having a moisture content of 14% indicate that the values of the adfreeze bond strength developed were maximum for uncoated wood piles (B.C. fir and spruce). Coatings such as creosote and paint reduced bond strength consider-
cussions with G . H. Johnston and the assistance of
G . Mould in designing the equipment and carrying out the tests. This paper is a contribution from the Division of Building Research, National Research Council of Canada, and is published with the approval of the Director of the Division.
CRORY, F. E. 1966. Pile foundations in permafrost. Permafrost.
Proceedings, 1st International Conference on Permafrost, Lafayette, IN, National Academy of Sciences, Washington, DC, pp. 467-476.
CRORY, F. E., and REED, R. E. 1965. Measurement of frost
heaving forces on piles. United States Army, Corps of En- gineers, Cold Regions Research and Engineering Laboratory, Hanover, NH, Technical Report No. 145, p. 31.
DEN HARTOG, J . P. 1952. Advanced strength of materials.
McGraw-Hill Book Company, New York, NY.
MEL'NIKOV, P. I., VYALOV, S. S., SNEZHKO, 0. V., and
SHISHKANOV, G. F. 1966. Pile foundations in permafrost.
Permafrost. Proceedings, 1st International Conference on Permafrost, Lafayette, IN, National Academcy of Sciences, Washington, DC, pp. 542-547.
NAIR, K., GRAY, H., and DONOVAN, M. C. 1969. Analysis of
pile group behaviour. In Performance of deep foundations.
American Society for Testing and Materials, Special Techni- cal Publication 444, pp. 118-159.
PENNER, E. 1974. Uplift forces on foundations in frost heaving
soils. Canadian Geotechnical Journal, 11, pp. 323-338.
PENNER, E., and GOLD, L. W. 1971. Transfer of heaving forces
by adfreezing to columns and foundation walls in frost- susceptible soils. Canadian Geotechnical Journal, 8, pp.
514-526.
SANGER, F. J . 1969. Foundations of structures in cold regions.
United States Army, Corps of Engineers, Cold Regions Re- search and Engineering Laboratory, Hanoker, NH. Cold Re- gions Science and Engineering Monograph 111-C4.
TSYTOVICH, N. A. 1975. The mechanics of frozen ground.
McGraw-Hill Book Company, New York, NY.
VYALOV, S. S. 1965. Rheological properties and bearing capac-
ity of frozen soils. United States Army, Corps of Engineers, Cold Regions Research and Engineering Laboratory, Hanover, NH, Translation No. 74.
WEERTMAN, J . 1973. Creep of ice. In Physics and chemistry of
ice. Edited by E. Whalley, S. J. Jones, and L. W. Gold. Royal