Publisher’s version / Version de l'éditeur:
Vous avez des questions? Nous pouvons vous aider. Pour communiquer directement avec un auteur, consultez la
première page de la revue dans laquelle son article a été publié afin de trouver ses coordonnées. Si vous n’arrivez pas à les repérer, communiquez avec nous à PublicationsArchive-ArchivesPublications@nrc-cnrc.gc.ca.
Questions? Contact the NRC Publications Archive team at
PublicationsArchive-ArchivesPublications@nrc-cnrc.gc.ca. If you wish to email the authors directly, please see the first page of the publication for their contact information.
https://publications-cnrc.canada.ca/fra/droits
L’accès à ce site Web et l’utilisation de son contenu sont assujettis aux conditions présentées dans le site LISEZ CES CONDITIONS ATTENTIVEMENT AVANT D’UTILISER CE SITE WEB.
Forging the Solar Transition: Proceedings of Solwest 80 - the Joint Solar
Conference, pp. 294-298, 1980
READ THESE TERMS AND CONDITIONS CAREFULLY BEFORE USING THIS WEBSITE.
https://nrc-publications.canada.ca/eng/copyright
NRC Publications Archive Record / Notice des Archives des publications du CNRC :
https://nrc-publications.canada.ca/eng/view/object/?id=d8ae9f4e-fa20-4e55-89f1-3ea5a676410d
https://publications-cnrc.canada.ca/fra/voir/objet/?id=d8ae9f4e-fa20-4e55-89f1-3ea5a676410d
NRC Publications Archive
Archives des publications du CNRC
This publication could be one of several versions: author’s original, accepted manuscript or the publisher’s version. / La version de cette publication peut être l’une des suivantes : la version prépublication de l’auteur, la version acceptée du manuscrit ou la version de l’éditeur.
Access and use of this website and the material on it are subject to the Terms and Conditions set forth at
Measured energy consumption of a group of low-energy houses
National Research
Conseil national
I
*
Camcil
Canada
de
mcherches
Canada
MEASURED ENERGY CONSUMPTION O F A GROUP
O F LOW-ENERGY HOUSES
by R.S. Dumont, He W. O r r ,
C. P.
Hedlin and
J. T. Makohon
ANALYZED
Reprinted f r o m
Proceedings of The Joint Solar Conference
Sponsored by the Solar Energy of Canada, Inc.
August 6-10, 1980
University of B r i t i s h Columbia, Vancouver,
B.
C.
p. 294
-
298
DBR P a p e r No. 1031
Division of Building R e s e a r c h
P r i c e $1.00
IB I B L I O T H ~ Q V E
'
Rech. Bd:im.
. . , r T * _Y1_- L-
OTTAWA
NRCC 20203
Environ 50 maisons s o l a i r e s p a s s i v e s dconomiques o n t d d j l Btd c o n s t r u i t e s dans l a rBgion de Saskatoon. On expose i c i d e s m e s u r e s c h i f f r d e s du c h a u f f a g e d e s l o c a u x e t d e l a consommation d ' b n e r g i e t o t a l e d'un groupe de ces maisons. La consolamat i o n d' Bnergie moyenne des m i s o n s unif a m i l i a l e s c h a u f f b s
B
l l d l e c t r i c i t B e t c o n s t r u i t e s avant 1970, dans l a rdgion de Saskatoon, e a t d ' e n v i r o n 670w/m2
d e s u p e r f i c i e de plancher t o t a l e pour une s a i s o n de chauffage d e 6077 degrds- j o u r s Celsius. Pour l e s 13 biltiments dconomiques d t u d i d s , l a consomeation d'bnergie t o t a l e a v a r i d d e 121a
499 M J / ~d u r a n t l ' h i v e r 197911980, e t pour tous ces b l t i m e n t s sauf deux, c e t t e consommation B t a i t comprise e n t r e 121 e t 240 MJ/m2. La consormeation moyenne pour c e s 13 maisons a Btd 218 MJ/m2. Voici des c a r a c t g r i s t i q u e s courantes que l ' o n retrouve dans c e s maisons Bconomiques :
i ) m e i l l e u r e Btanchditd
a
l ' a i r grzce au c o n t r a l e de l a v e n t i l a t i o ni i ) n i v e a w d ' i s o l a t i o n environ t r o i s f o i s p l u s dlev6s que l a nome minimale a c t u e l l e
i i i ) u t i l i s a t i o n de f e n s t r e s f a i g a n t f a c e au sud pour r e c u e i l l i r passivement de l ' d n e r g i e s o l a i r e .
R.S. Dumont, H.W. Orr, C.P. Hedlin and J.T. Makohon
Prairie Regional Station, Division of Building Research, National Research Council, Saskatoon. Sask.
ANALYZED
ABSTRACTApproximately 50 low-energy passive solar houses have been constructed in the Saskatoon area to date. Quanti- tative measurements are now presented on the space heat- ing and total energy consumption of a group of these houses.
The average space heating energy consumption for electri- cally heated, detached residences built before 1970 in
the Saskatoon area is about 670 M J / ~ Z of total floor
area for a heating season of 6077 Celsius degree-days. Of the 13 low-energy buildings surveyed, the total energy
consumption figures varied from 121 to 499 M J / ~ Z during
the winter of 1979-80, with all but two of the buildings in the range of 121 to 240 ~J/rnz. Average consumption for the 13 buildings was 218 ~ J / m 2 . Features common to the low-energy houses are:
i) improved air tightness with controlled ventilation, ii) insulation levels approximately three times the
present minimum standard,
iii) use of south windows for passive solar gain.
Introduction
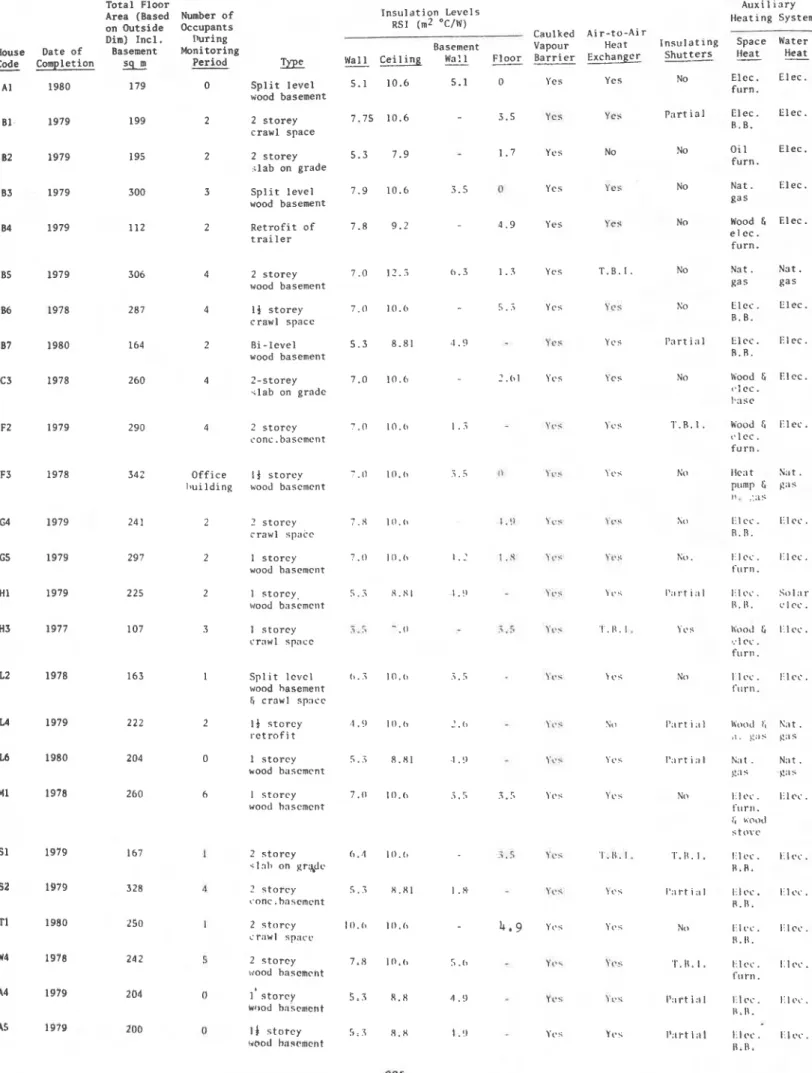
From 1977 to 1979 approximately 50 low-energy houses have been constructed in the Saskatoon area, with jnsLlla- tion levels approximately three times those of 1975 Canadian minimum standards. Ceiling insulation levels have varied in the range of RSI 7 (R40) to RSI 14.8
(R84); wall insulation levels, in the range of RSI 4.9 (R28) to 10.6 (R60); and floor insulation levels in the range of RSI 0 to RSI 4.9. On a number of the houses night insulation for windows has been used as well. To limit air leakage, special sealing techniques have been used for most of the houses. One of the main features is the use of 150 micrometre (6 mil) polyethy- lene carefully caulked at all joints and penetrations.
The booklet, Low Energy Passive Solar ~ o u s i n ~ ] , details
the air tightness measures used on many of the houses. To provide needed ventilation air in a number of the houses an aii-to-air heat exchanger of a novel design2 has been incorporated; air flow rates in the range of 40 L/s (80 cfm) are used with it. The heat exchanger operates with an effectiveness of approximately 0.7. In typical outside temperature conditions of -20°C in
winter it will raise the outside air from -20°Cto about
+lO°C. A common control scheme incorporates a relative
humidity sensor to control operation of the fans. A number of schemes have been used to defrost the heat
exchanger, and these a r c described in the l~reviously
mentioned booklet.
In most of the houses in the Saskatoon low-energy house sample passive solar collection has been used to supple- ment space heating. A few exceptions have no major window areas oriented to the south, but generally this has been caused by improper lot orientation. For those with south-facing windows the approach has been to use a modest amount of glazing, generally in the range of 6 per cent south window area in relation to the total floor area. With this size of south window few problems of overheating have occurred in wood frame housing; the thermal capacity of the interior materials of the house is sufficient to limit temperature swings from solar gain. For a number of the houses, the south window
performance has been upgraded by th'e use of nightin~.ula- tion or triple glazing. A listing of the physical size and thermal characteristics of the low-energy houses is
provided in Table I.
Measured Energy Consumption
No extra monitoring equipment was installed on most of the houses. Instead, utility-supplied meters for electricity and natural gas were used, and readings were taken on a monthly basis from September 1979 to May 1980.
Space Heating Energy Consumption as a Function of Heating Degree-Days
With conventional housing on the Canadian hairies
it is usually possible to determine a linear relation
between the total ener y consumption of a house and the
number of degree-days.g A plot for a typical pre-1970
house located in Regina is shown in Figure
A linear relation between total energy consumption and
degree-days per day describes the two variables. The slope of the curve may be regarded as an indication of the space heating performance of the house.
If a building has a slope of 24.4 MJ/degree-day and the
annual degree-days for the location are 6,000, then the annual space heating load would be approximately the product of these numbers (i.e., 146,000 MJ or 146 GJ). The analysis is somewhat complicated by the fact that electrical usage for lighting and for the furnace fan increases with greater degree-day per day figures. For standard houses, however, this is usually a minor correction of the order of 10 per cent or less. With low-energy houses, the total energy consumption
D E C R E E O A Y S I D A Y . " C
Fig. 1. Total energy consumption versus degree days per day, standard house.
versus degree-days per day curve is often not a simple linear relation. In a low-energy house with a rate of heat loss of the order of 100 watts per C deg tempera- ture difference between inside and outside, internal heat gain and passive solar gain can readily provide a 24 h average of approximately 2,000 W. With this amount of heat gain the space heating system for the house need not cut in until the temperature difference between inside and outside is 20 C deg (2,000 W t 100 W/C deg).
With such a house the total energy consumption would no longer be linear with the degree-day figures. Figure 2 presents a plot of the total energy consumption versus degree-days for one of the occupied low-energy houses in Saskatoon. At the low degree-days per day figures the total energy consumption per day is relatively constant. Beyond a figure of about 10 degree-days per day, however, the total energy consumption per day increases because the internal heat gain and passive solar gain are no longer sufficient to meet the space heating load. To provide a standard of comparison for the houses the space heating energy consumption per unit of total floor area was chosen as the measure of performance. Table I1 gives the energy consumption statistics for the winter of 1979-80. As may be seen, the space heating energy consumption of the low-energy houses varied between 121 and 499 M J / ~ Z over the heating season. Owing to the fact that occupancy commenced at somewhat different times in the autumn, not all the houses had accumulated the same number of degree-days during the monitoring period.
O l C R E E O A Y S I D A Y , C
,.
Fig. 2. Total energy consumption versus degree days per day, low-energy house
: 1 0 0 0
-
Y I = 8 0 0 0-
-
a I 6 0 0 3 V1 Z 0 u 4 0 0 > v LL 2 0 0It was not possible to measure the space heating energy consumption directly. Total energy consumption was measured and the space heating energy consumption calcu- lated by subtracting the measured total energy consump- tion per day in the non-heating season times the number of days in the monitoring period. Thus, for house B1 the total energy consumption during the monitoring period was 62.4 CJ. To estimate the space heating energy consumption, the measured total energy consump- tion per day in the non-heating season (86.4 MJ/day) was multiplied by the number of days in the monitoring period (256) and the result subtracted from the total energy consumption (62.4 GJ) to give 40.3 GJ. To determine the estimated space heating energy consumption per unit area, the estimated space heating energy consumption was divided by the total floor area (199 m2) for a figure of 203 M J / ~ ~ . I I I I
-
H O U S E C O D E ' W 4-
-
-
n 0 0 0-
d 0 & o c n-
?oO 0 O-
O 0For occupied houses for which a measurement of energy consumption during the non-heating season was not available, a figure of 105 MJ/day, the average for the measured houses, was used. Thus, for house B7 the estimated figure for space heating energy consumption was calculated by subtracting the product of 105 MJ/day and 105 days from the total energy consumption of 28.6 GJ.
1:
€$pO
2 0 I I I I
0
-
0 10 2 0 3 0 dD 5 0For the three unoccupied houses (Al, AA4 and AAS), in which no hot water was used, a figure of 59.1 MJ/day was used as the estimated energy consumption during the non-heating season.
As may be seen from these calculations, it would have been preferable to install separate meters on all of the houses to measure more accurately the space heating load. Figure 3 shows a histogram of the results presented in Table 11. As five of the houses used wood heat for a substantial portion of space heating, these houses are shown in the separate upper histogram. Because the efficiency of wood heating apparatus varies, it is diffi- cult to quantify the net heating-contribution of the wood burned.
Discussion
A number of points have been clarified by the results presented in this paper. The first is that the increased insulation has dramatically reduced the energy consump- tion of the test houses over that of standard houses. The space heating energy consumption per square metrc has been reduced on three of the low-energy houses to one- fifth that of standard pre-1970 dwellings. The space heating energy consumption of the median house is one- third that of the standard pre-1970 dwelling.
L 0 A V E R A G E P R E - I 9 7 0 A V E R A G E P E E - 1 9 7 0 E 3 -
-
m-
H O U S E U I l N G H O U S E U S I N G E L E C T R I C I T Y F O R N A T U R A L G A S F O R2
2 - - 3 . S P A C E H E A r l N G S P A C E H E A T I N G 0 <:: 4 1 -4
t
- * . - 3 3 - u z e 0o IUO zoo 300 aoo soo 6 0 0 loo 800 qoo 1 0 0 0
M J , ~ '
Fig. 3. Space heating energy consumption (electricityor natural gas) per unit total floor area for heating season
TABLE I - LOW-ENERGY HOUSE FEATURES
-
A u x i l i a r y Heating System Total Floor
Area (Based Number o f on Outside Occupants Dim) I n c l . I'uring Date of Basement Monitoring
Completion Period
I n s u l a t i o n Levels RSI (m2 'C/W)
Caulked A i r - t o - A i r
Vapour Heat Insulating Space Water B a r r i e r Exchanger S h u t t e r s Heat Basement = C e i l i n g Wa:l Floor S p l i t l e v e l 5.1 10.6 5.1 0 wood basement 2 s t o r e y 7.75 10.6 3.5 crawl space 2 s t o r e y 5 . 3 7.9 1.7 ; l a b on grade S p l i t l e v e l 7.9 10.6 3.5 0 wood basement R e t r o f i t o f 7.8 9.2 4 . 9 t r a i l e r House Code
-
Al Yes Yes No Elec. f u r n . Elec.
Y cs Ycs p a r t i a l Elec. Elcc. B . B .
Yss No No Oil Elec.
f u r n .
Yes Y cl; No Nat. Elec.
gas
Yes Ye?; No wood t Elec
.
e l e c.
f u r n . Yes T . B . I . No Nat. N3t. gas gas 1979 306 4 2 s t o r e y 7.0 I?..; 0 . 3 1 . 3 wood basementYes Yes No E l c c . Elec. R . B .
1978 287 4 I f s t o r e y 7 . 0 10.6 5 . 3
crawl space
Yes Ycs r t i ~ Illcc. l i l c c .
R . R .
1980 164 2 Ri-level 5 . 3 8.81 3 . 9
wood basement
\'<as \-cs I ' . R . l . Wood4 lilec. t . l c c . f u r n . 1979 290 4 2 s t o r e y '.0 10.0 1 . 3 conc.bnscmcnt Yc.i 'I ~ > 5 h'cl Ilc;~ t N:lt . pump t gas 1 1 . :.:Is 1978 342 O f f i c e I t s t o r e y 1 10.(> 3 . 5 1, I ~ u i l d i n g wood bascmcnt 1979 24 1 2 7 s t o r e y 7 . 8 10.(> 1 .!1 crawl sp;~i-c
It,.; I r s ho lilec. lilcc
R.R. I (*.: Y t ~ 5 K O . I:Icc. I:Icc. f u r n . 1979 297 2 1 s t o r c y ? . O l0.h 1 . I .?l wood hasement 1979 225 2 1 s t o r c y , 5 . 3 A.SI I.!) \good basement I r ? \ 1.
.;
I ' : ~ r t i : i l I ~ I L - L . . So1;1r H.11. c l c c . 1977 107 3 I s t o r e y 5.1.-
. O t.5 crawl space 1978 163 1 S p l i t lcvcl I)..? 10.0 .i. 5 wood hasement crawl s p : ~ c c 2 If s t o r e y 4 . I l l . ( > 2 . (, r c t rof i t 0 1 s t o r c y 5.3 8.81 ,l . !l wood h;lscmentyL.c Yc.; r t i : k ~ t . Nat.
<:Is \g:1s h I s t o r e y 7 . 0 10.0 .?.5 5.5 wood hnscmcnt YCS Yes No I . l c ~ . . l i l r ~ . t'u r II
.
t ; U>,><I s t o v e 1 2 s t o r e y 0 . 1 IO.0 i.
5 .;la11 on gr4de \'t.< '1'. II.
I . . l . l lilcc. 1:11*1.. H.R. 4 ? s t o r e y 5 . . 8.81 I . R ~ m c . hnscmcnt 1 2 s t o r c y i 0 . 0 10.0 cr:lwl sp:lci. 4.9 5 2 s t o r c y 7.8 10.0 5 . I ) \good hascmcht 0 1 s t o r c y 5 . 3 8.8 4 .$) Wtrod hnicmchtTABLE I1
-
ENERGY CONSUMPTION STATISTICSMeasured Total Energy Estimated Space Heating Consumption Per Day Energy Consumption Monitoring Period Celsius in Non-heating
Degree Days Total Energy Season During For Heating No. Relative to Consuption Monitoring Season House Start Finish
&
--
-
lS°C-
GJ KW-h/Day MJ/Day Period (GJ) (MJ/M~)79/05/03 80/04/30 363 5663.5 77.8 EL'OO~ 42.8 154 21.9 + wood 57 + wood 47 + wood 79/10/26 80/04/30 187 4836.2 27.1 20 72 13.6 + wood 79/08/29 80/04/30 245 5276.9 33.4 E L ~ O O ~ 26 93.6 10.5 + wood 98 + wood 440 15 .5 E L ~ O O ~ 79/08/25 80/04/30 249 5285.9
-
12.3 + wood 22.9 N.Gas 55 + wood 79/05/04 80/04/30 362 5649.2 84.5 E L ~ O O ~ 21.6 77.8 56.3 + wood 217 + wood 140 240 9I t is clear that the design of the building must be care- fully planned. House L2, as shown on Figure 3, had the second highest energy consumption of the group of low- energy buildings, although it has insulation levels
(walls, RSI 6 . 3 ; ceiling, aSI 10.6; basement malls, RSI
3.5) that meet o r exceed the levels used in the majority
of the low-energy houses. The reason for this is a large amount of south-facing glazing
-
32.5 m2 (equal to20 per cent of the total, floor area); the night heat loss from these windows (5,880 W at -Mot outside,
21°C inside) seriously degrades the performance of the
house. The building is a direct-gain structure with no edditional t h e m 1 mass, and on sunny days it readily overheats, necessitating use of reflective blinds to limit heat gain.
A third point is that a low-energy l~uilding must be operated in an energy conserving manner. Building F3
is an office building that uses large amounts of outside air for ventilation. Thus, in spite of its high
insulation levels it is a high energy user in relation to the rest of the low-energy houses. By reducing the outside air intake during the hours when the building is not used, the energy consumption for space heating could be reduced significantly.
A fourth point is that internal gains from electricity and hot water usage make up a very significant fraction of the annual space heating requirements. As may be seen from Table 11, this varies greatly from one family to another. The average for the 12 houses measured is
29.2 KW h/day, but the values range from 7.9 to 56.4
KW h,'dny. This 7 to 1 variation can be partly explaiaed by family size (the house with lower energy consumption had one occupant, the house with higher energy consump- tion, four occupants), but it is well to keep in mind these fairly large differences in internal gains when predicting the space heating and total energy
consumption for a house.
A related point is that low-energy houses with snail
internal heat gains because of the lifestyle of the
occupants will necessaril? have a higher space heating
load than will similar houses with greater internal heat
gains. It would be useful to define a "reference" family whose internal heat gains are fixed in order that more accurate comparisons could be made among houses in different parts of the world.
Further monitoring of these and other low-energy houses is intended for the coming year. With monitoring it will be possible to isolate more clearly the space
heating load From the remainder of the energy load in
all of the houses. In addition, the authors plan to
compare the measured and predicted space heating energy
consumption of 8 group of ten such houses.
Acknowledgement
This paper is a contribution from the Division of Building Research, National Research Council of Canada, and is published with the approval of the Director of the Division.
References
(1) Low Energy Passive Solar Housing. University of Saskatchewan, Department of Mechanical Engineering, Saskatoon, Canada, 1979. (Available from U-Learn, Ccl,t.
of Extension and Community Relations, Univeristy of Saskatchewan, Saskatoon, Canada S7N OWO.)
(2) Besant. R.W., R.S. Dumont and D. Van Ee, An Air to Air Heat Exchanger for Residences. University of Saskatchewan, Department of Mechanical Engineering, Saskatoon, Canada, 1978. (Available from U-Lea-n, P c l l t .
of Extension and Community Relations, University of Saskatchewan, Saskatoon, Canada S7N OWO.)
(3) Hedlin, C.P. and PI. Bantle, A Study of the Thermal Performance of a Group of Houses on the Canadian Prairies. To be published.
This publication ia being distributed by the Division of Building R e s e a r c h of the National R e s e a r c h Council of Canada. I t should not be reproduced in whole o r in p a r t without permission of the original publieher. The Di- vision would be glad to b e of a s s i s t a n c e in obtaining such permiesion.
Publications of the Division may be obtained by mail- ing the appropriate remittance ( a Bank, Exprese, o r P o s t Office Money Order, o r a cheque, made payable
to the Receiver General of Canada, c r e d i t NRC) to the
National R e s e a r c h Council of Canada, Ottawa. K1A OR6.
Stamps a r e not acceptable.
A l i s t of a l l publicationa of the Division is available and may be obtained f r o m the Publications Section, Division of Building Research, National R e s e a r c h Council of


![Absorbed doses to mice for three [18F]-tracers calculated from experimental kinetic data and Monte Carlo simulations](data:image/gif;base64,R0lGODlhAQABAIAAAP///wAAACH5BAEAAAAALAAAAAABAAEAAAICRAEAOw==)