Designing Materials for Energy Storage with High Power and
Energy Density: LiFePO
4 Cathode Materialby
Byoungwoo Kang
B.S. Materials Science and Engineering Seoul National University, 2003
MASSACHUSETTS INSTVTtfrE OF TECHNOLOGY
JUN 16 2010
LIBRARIES
Submitted to the Department of Materials Science and Engineering in partialfulfillment of the requirements for the degree of
ARCHNES
DOCTOR OF PHILOSOPHY
IN MATERIALS SCIENCE AND ENGINEERING
at the
MASSACHUSETTS INSTITUTE OF TECHNOLOGY
February 2010
0 Massachusetts Institute of Technology, 2009. All rights reserved.
Signature of Author: _,,
Department of Materials Science and Engineering Dec 17, 2009
Certified by: -4 Sac /F -o.*
Gerbrand Ceder R.P. Simmons Professors of Materials Science and Engineering
2
/
7)
Accepted by:.
is Supervisor
Ch stine Ortiz Associate Professor of Materials Science and Engineering Chair, Departmental Committee on Graduate Students
Designing Materials for Energy Storage with High Power and
Energy Density: LiFePO
4cathode material
by
Byoungwoo Kang
Submitted to the Department of Materials Science and Engineering in Partial Fulfillment of the Requirements for the Degree of
Doctor of Philosophy
in Emerging, Fundamental, and Computational Materials Science
Abstract
LiFePO4 has drawn a lot of attention as a cathode material in lithium rechargeable
batteries because its structural and thermal stability, its inexpensive cost, and environmental friendliness meet the requirements of power sources for electric vehicles, except high power capability. Strategies to increase the rather sluggish rate performance of bulk LiFePO4 have focused on improving electron transport in the
bulk or at the surface of the material, or on reducing the path length over which the electron and Li* have to move by using nano-sized materials. However, recent evidence indicates LiFePO4 is pure one dimensional lithium conductor. So, lithium
transport is as important as electron transport. Strong anisotropic lithium diffusion results in limited transports of lithium ions in both the bulk and the surface. Reducing the particle size improves the transport of lithium ions in the bulk, and modification of the surface with a lithium-ion conducting material should enhance the transport of lithium ions on the surface.
A poorly crystallized lithium phosphate phase on the surface of nanoscale LiFePO4
is created by using proper off-stoichiometry (LiFeo.9Po.9504.3). The off-stoichiometric
strategy leads to small particles less than 50 nm through grain growth restriction and a poorly crystallized lithium phosphate on the surface. The conducting surface phase can not only improve the transport of lithium ions on the surface but also facilitate the access of lithium ions to the surface by reducing anisotropic lithium diffusion on the surface induced by its amorphous nature. The off-stoichiometric material shows extremely high rate performance, achieving reasonable capacity even at 400C (9 s charge/discharge).
In this thesis, the main finding is as follows: LiFePO4 shows fast bulk kinetics and
in itself does not limit the rate of charge and discharge. When bulk Li transport is very fast, the battery charging and discharging are limited by other factors such as the surface adsorption and surface transfer of lithium ions and the configuration of a cell.
The off-stoichiometric strategy to improve surface transports addresses the right rate-limiting step and reveals the real capability of LiFePO4.
Thesis Supervisor: Gerbrand Ceder
Acknowledgements
I would like to thank my supervisor Prof Gerbrand Ceder for his generous fmancial
supports and great inspiration and motivations. He always encourages me to be a scientist rather than just a graduate student with his visions and insights.
I would like to thank my two committees, Prof Sadoway and Prof Tuller for their
valuable time and great comments for my thesis.
I would like to thank former and present members of Ceder group. They shared their
expertise with me and make my graduate life delightful: Dane Morgan, Anton Van der Ven, Ashley Predith, Maria Chan, Byungchan Han, Shirley Meng, Kisuk Kang, Fei Zhou, Kristin Persson, Chris Fischer, Tim Muller, Rober doe, Denis Kramer, Gang Yang, Kevin Tibbetts, Yoyo Hinuma, Osman Burak Okan, Xiaohua Ma, Geoffroy Hautier, Charles Moore, Anubhav Jain, Jaechul Kim, Shinyoung Kang, Rahul Malik, Shyue Ping Ong, Ruoshi Sun, Yabi Wu, Lusann Yang, Aziz Abdellahi, Hailong Chen, Rickard Armiento and Vincent Chevrier. Also, I would like to thank Kathryn Simons as an administrator of the group for helping me out.
I would like to thank all visitors of Ceder group for sharing their experience and
expertise. They always inspired me: Prof Masanobu Nakayama, Dr. Chilhoon Doh, and Xiaofei Sun.
My gratitude goes to my parents and brother and sisters for their unconditional love.
My deepest gratitude goes to my wife, Eunhee Kim and my son, Kihoon. Her
Table of Contents
A cknow ledgem ents...3
List of Figures...10
List of Tables ... 27
C hapter 1. Introduction and Thesis outline ... 31
1.1 Introduction...31
1.2 Background of lithium ion batteries ... 33
1.3 Com ponents of Lithium ion batteries ... 34
1.3.1 Cathode (positive electrode)...34
1.3.2 Anode (negative electrode)...35
1.3 .3 T h e electro ly te...3 5 1.3.4 T h e separator...36
1.4 Intercalation process ... 36
1.5 Param eters of lithium ion batteries ... 37
1.5.1 V oltag e (V ) ... 37
1.5.2 Theoretical capacity (mAh/g)...38
1.5.3 Specific energy (Wh/kg) and energy density (Wh/L)... 38
1.5.4 Specific pow er (W /kg)...38
1.5 .5 C y cle life ... 3 8 1.6 Anode m aterials for Lithium ion cells ... 39
1.6 .1 C arbon anode ... 39
1.6.2 Li4Ti5O12 for high rate system...39
1.7 Cathode m aterials in lithium ion batteries ... 40
1.7.1 Layered structure (LiMO2).----...40
1.7.2 Spinel system (LiMn204)...42
1.7.3 LiMPO4 (M =Fe, Mn, Co, Ni)...43
References ... 47
Chapter 2. Overview of LiFePO 4 ... 49
2.1 Structural characterization... 49
2.2 Kinetic factors of LiFePO4: Ionic and electronic conductivity... 52
2 .2 .1 Ion ic con ductivity ... 52
2 .2.2 E lectronic conductivity ... 55
2.3 Kinetic factors to be considered in LixFePO4 during electrochemical process...61
2.3.1 First-order phase transformation in LiFePO4 during electrochemical process. ... ... 61
2.3.2 Mechanisms of phase transformation...64
2.3.3 Surface potential and anisotropic behavior affecting the exchange rate of lithium ions with electrolyte...70
References ... 72
Chapter 3. Phase stability of LiFePO4 and secondary phases induced by off-stoichiom etry ... 77
3.1 Introduction...77
3.2 Experiments...80
3.3 Results...81
3.3.1 Silicon doping instead of phosphorus in LiFePO4 ... .. ... ... ... ... .. ... ... ... .. ... .... .. ... . . 81
3.3.2 Off-stoichiometric LiFePO4 case (different ratio of Li, Fe, and P)... 84
3.4 Discussions... 99
3.4.1 Structural change and secondary phase...99
3.4.2 Volume changes: formation of the composite material...100
3.4.3 Secondary phase can help to achieve small particles ... 102
3.4.4 Comparison of experimental data with calculated phase diagram...105
3.5 Conclusions... 107
References ... 109
Chapter 4. Making small particle in LiFePO4 using solid-state reactions with iron oxalate...112
4.1 Introduction... 112
4.2 Experim ents... 115
4 .2 .1 S ynth esis...1 15 4.2.2 XRD, SEM, and TEM ... 116
4.2.3 ATR-FTIR and TGA-MS...116
4.3 Results... 117
4.3.1. Characterization of the precursors and the ball-milled mixtures (before heating)...117
4.3.2 Characterization of the reaction route: TGA-M S...126
4.3.3 Characterization of the first heated materials (250 QC or 350 QC): ... 130
4.3.4 Characterization of the final products...137
4.4 Discussions... 141
4.4.1 Effects from ball-milled powder: Before the second heat treatment ... 141
4.4.2 Main mechanism of making small particles ... 142
4.4.3 Structural argumentation...144
4.4.4 XRD data of the two materials synthesized at 800 QC ... 144
4.4.5 TEM data: the secondary phase was on the surface ... ... 147
4.4.6 Morphology argumentations for the restriction of grain growth ... 150
4.4.7 Different sintering time at the same temperature...153
References ... 162
Chapter 5. Secondary phase characterization and the enhancement of the electrochemical performance in LiFePO4 induced by off-stoichiometry...167
5.1 Introduction... 167
5.2 Experim ents...170
5 .2 .1 S yn th esis...170
5.2.2 Characterization methods...170
5.2.3 E lectrochem ical test...172
5.3 Results...172
5.3.1 Characterization of bulk properties, XRD and SEM ... ... 172
5.3.3 The chemistry of the surface: XPS and STEM ... ... 176
5.3.4 M6ssbauer and Electrochemical test in discharging first...183
5.3.5. NMR data for off-stoichiometric material...195
5.3.6 Summaries of the characteristic of the secondary phase...196
5.3.7 Small volume of the off-stoichiometric material ... ... 197
5.3.8 E lectrochem ical test results...199
5.4 Discussions... 211
5.4.1 How to improve the electrochemical performance with secondary phase ... ... ... 211
5.4.2 Particle size effect for electrochemical performance...212
5.5 Conclusion ... 218
References ... 221
Chapter 6. The dependence of phase fraction on the particle size in chemically delithiated LiFePO 4 system ... 227
6.1 Introduction... 227
6.2 Experimental...230
6.2.1 Synthesis of L iF ePO 4... 230
6.2.2 C hem ical delithiation ... 23 1 6.2.3 C entrifuge m ethod ... 232
6.2.4 E lectrochem ical test...233
6.3 Results... 233
6.3.1 M aterials characterization ... 233
6.3.2 The validity of centrifuge method...236
6.3.3 Phase fraction and particle size based on XRD measurement...239
6.3.4 Phase fraction and the global composition...242
6.4 Discussions...245
6.4.1 The pathway of phase transformation based on the observations... ... ... 245
6.4.2 Implications for the electrochemical behavior...248
6.5 Conclusion ... 251
Chapter 7. Electrochemical performance of LiMnPO4 synthesized with off-stoichiometry
... ... ... ... ... 0 ... ... 256
7.1 Introduction... 256
7.2 Experimental...257
7.3 Results... 258
7.3.1 Characterization of the off-stoichiometric LiMnPO4... .. ... .. ... ... . ... . ... . ... ... ... ... .. ... ... ... ..258
7.3.2 Electrochemical performance...262
7 .3.2 R ate cap ab ility...264
7.4 Discussions... 268
7.5 Conclusion ... ... 269
References ... 271
Chapter 8 Conclusions ... 274
List of Figures
Figure 1-1. Comparison of the different rechargeable batteries in terms of volumetric and gravim etric energy density[ 1]... 31
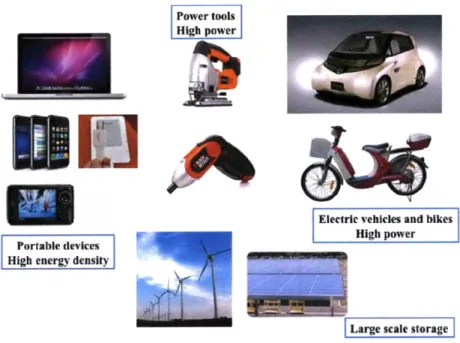
Figure 1-2. A variety of applications such as portable electronics, power tools, electric vehicle and bike, and large-scale energy storage... 33
Figure 1-3. Schematic diagram of lithium ion cell. The cell is composed of cathode, anode, the separator, and the electrolyte ... 34
Figure 1-4. Typical voltage profile at anode and cathode in lithium ion batteries[8]... 40
Figure 1-5. Schematic layered structure based on .-NaFeO2 structure. Lithium and cobalt are
occupied in octahedral site. ... 41
Figure 1-6. Crystal structure of spinel, LiMn204. Green circles are lithium ions and violet
octahedrons are M nO 6... . ... ... .. ... . . 42
Figure 2-1. (a) Overview of olivine structure (M1M2TO4) based on Pnma framework. (b) Ml
and M2 octahedron show different distortion and size. The same number represents the connection between M l and M 2... 50
Figure 2-2. Connectivity of M1 octahedron and M2 octahedron in olivine structure... 51
Figure 2-3. One dimensional lithium diffusion channel, b direction, [0 1 0]. View is along b direction under Pnma framework. Red: Oxygen, Violet: P04, Green: Li, and Blue: FeO6.52
Figure 2-4. Electronic conductivity[29] for LiFePO4/C and pure LiFePO4 induced by carbon
Figure 2-5. Electronic conductivity of LiFe(Ni)P04 induced by metal phosphides conducting
layer from H erle et al. [30]... 58
Figure 2-6. Electronic conductivity of doped LiFePO4 and pure LiFePO4. Doped LiFePO4 shows
higher electronic conductivity than that of pure LiFePO4... ... ... .... . . . 60
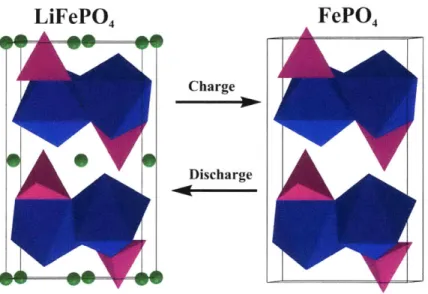
Figure 2-7. Structural change in LiFePO4 during electrochemical process indicating two-phase
reactio n . ... 62
Figure 2-8. Schematic voltage curve driven by Gibbs free energy. A flat potential is the indication of the same chemical potential leading to two-phase reaction... 63
Figure 2-9. Schematic diagram of mosaic model in small uniform particles. Mosaic model is limited by grain growth mechanism. Each particle has two phases indicating different color. Black: FePO4 and W hite: LiFePO 4 ... . .. ... .. ... ... . . 65
Figure 2-10. Schematic Core-shell (Shrinking-core) model with the movement of phase boundary proposed by Srinivasan et al. [44]... 67
Figure 2-11. Schematic diagram for Mosaic model from Andersson et al. [50]... 68
Figure 2-12. Schematic diagram of Domino-cascade model in small uniform particles. Single-phase exists in a given particle. ... 69
Figure 2-13. Schematic diagram of Domino-cascade model in LiFePO4 proposed by Delmas et
Figure 3-1. XRD patterns of LiFe(SixP.x)O4 (x = 0, 0.01, 0.04, 0.1, 0.2, and 0.3) synthesized at
700 *C under Ar. Iron metal clearly appears and linearly increases according to the amount of
silico n . ... 83
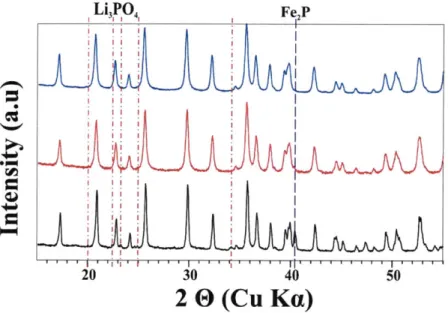
Figure 3-2. XRD patterns of samples synthesized at 700 *C under Ar. The formula of the sample is the same as Table 1. Sample 3 shows the trace of Li3PO4. *: M-Li4P20 7, ±: Li3PO4, and 1:
T-Li4P20 7. T: triclinic and M : monoclinic... 86
Figure 3-3. Simulated XRD patterns of two polymorphs of Li4P207 from ICSD data... 87
Figure 3-4a. XRD patterns of LiFePO4 (sample 1) synthesized at different synthesis temperatures
u nd er A r... 89
Figure 3-4b. XRD patterns of LiFeo.9Po.9 504 (sample 4) synthesized at different synthesis
temperatures under Ar. 1: T- Li4P207. T: triclinic... 89
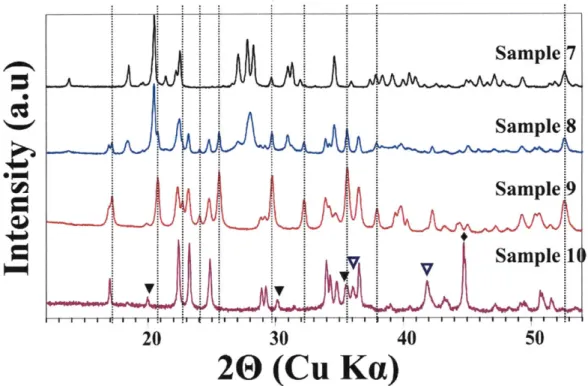
Figure 3-5a. XRD patterns of samples from #7 to #10 synthesized at 700 *C under Ar. Y: FeO,
E: Fe metal, and L0: Fe304. The vertical dotted lines represent LiFePO4... ... . . 94
Figure 3-5b. XRD patterns of Li2Feo.5PO4 (Sample 9) synthesized at different temperatures under
Ar. Vertical long-dot lines represent some of peaks for LiFePO4 ...... ... . . 96
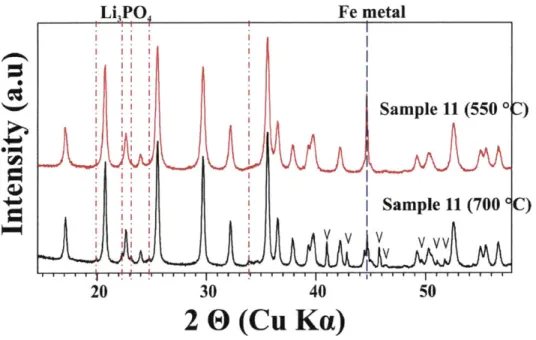
Figure 3-6. XRD patterns of LiFeo.9 5Po.904, sample 11 synthesized at 550 *C and 700 *C under
A r. El: F e3P ... 9 7
Figure 3-8. SEM images of samples synthesized at 700 *C under Ar. (a) LiFePO4, sample 1 (b)
LiFeo 98Po.9904, sample 2 (c) LiFeo 94Po.9704, sample 3 (d) LiFeo.9Po.9504, sample 4 (e)
LiFeo 7Po 8504, sample 5 (f) LiFeo.9sPo 904, sample 11 ... 104
Figure 3-9. Calculated Li-Fe-P ternary phase diagram equilibrated with an oxygen potential under reducing conditions, which represents typical synthesis conditions for LiFePO4. Samples
are plotted based on nominal composition. Filled type represents samples, which are synthesized in this work. Open type represents calculated compounds. ... 106
Figure 4-1. XRD patterns of the ball-milled (BM) mixture of precursors and BM-precursors before heating. (a) LiFePO4 (b) off-stoichiometric LiFePO4 (c) Li2CO3 (d) FeC204 2H20 (e)
NH4H2PO4. LI represents some peaks from Li3PO4 phase... 119
Figure 4-2. XRD patterns of the ball-milled materials with different milling time before heating. (a) BM off-stoichiometric LiFePO4 for a week (b) BM off-stoichiometric LiFePO4 for 15hrs (c)
BM- FeC204-2H20. "*" is the unidentified phase. The iron oxalate in the box finally disappeared
in the sample ball-milled for a week. LI represents some of peaks from Li3PO4... ... 120
Figure 4-3. ATR-FTIR spectra of the precursors and the ball milled mixtures of precursors. (a)
BM- LiFeo.9Po 95045 (b) BM- LiFePO4 (c) Li3PO4 (d) BM- FeC2O4-2H20 (e)
(NH4)3Fe(C204)3-xH20 (Ammonium Ferric Oxalate) (f) BM- (NH4)2HP0 4. The large difference
between (a) and (b) can be seen with vertical lines. New peak (*) appears in the off-stoichiom etric m aterials. ... 122
Figure 4-4. Schematic diagram of the structural change of iron oxalate during ball milling in the off-stoichiometric material. (a) Fe : C204 = 1:1 (b) Fe: C204 = 1: 3. The oxalate ions were
Figure 4-5. FTIR spectra of the off-stoichiometric materials at different ball milling time. (a) for
one week ball milling (b) for 15hrs ball milling (c) BM-FeC204-2H20 (d)
(NH4)3Fe(C204)3-xH20. The striking differences are indicated with vertical lines. '*' indicates
the appearance of a new peak. ... 125
Figure 4-6. TGA-MS results of (a) BM- stoichiometric material and (b) BM- off-stoichiometric material under inert gas environment, Helium. ... 128
Figure 4-7. Comparison of C0 2/CO release behavior at the stoichiometric and the
off-stoichiometric material. The starting temperature of the gas release is quite different from each other. The ratio of CO2 to CO is also quite different. ... 129
Figure 4-8. XRD patterns of the off-stoichiometric material at different temperatures under Ar. (a) before heating (ball-milled powder), (b) heated at 250 *C, and (c) heated at 350*C. The LiFePO4 was formed and iron oxalate (*) almost disappeared at 250 *C. L: LiFePO4 and Li:
L i3P O 4...
13 1
Figure 4-9. XRD patterns of the stoichiometric material at different temperatures under AR. (a) ball-milled powder (before heating) (b) heat treatment at 250 *C and (c) heat treatment at 350 *C. At 250 *C, iron oxalate still existed indicated by the "*". At 350 *C, the material showed similar behavior yet a larger amount of LiFePO4 and smaller amount of Li3PO4. L: LiFePO4 LI: Li3PO4.
... 13 3
Figure 4-10a. TEM image of the off-stoichiometric material synthesized at 250 "C under Ar. There were a crystalline part and an amorphous part. The red circles represent some of the crystalline regions while the matrix is still amorphous at this temperature. The crystallite size is less than 5nm . ... 135
Figure 4-10b. TEM image of the off-stoichiometric LiFePO4 at 350 *C under Ar. There were
several crystalline structures in the amorphous matrix. This was consistent with the TEM result at 250 *C. Based on XRD measurements, the crystalline structures are mainly Li3PO4 and
LiFePO4. The crystallite size is around l0nm . ... 136
Figure 4-11. The XRD patterns of the off-stoichiometric and the stoichiometric material synthesized at different temperatures under Ar. ... 138
Figure 4-12a. SEM image of the stoichiometric material synthesized at 600 *C. The stoichiometric material showed broad particle size distribution (scale bar: 500nm)... 140
Figure 4-12b. SEM image of the stoichiometric material synthesized at 600 *C. The
off-stoichiometric material showed narrow particle size distribution. Scale bar: 500nm .... 141
Figure 4-13. TEM image of the off-stoichiometric material synthesized at 350 *C under Ar. The edge of the grain shows a poorly crystallized phase while the inside is crystallized. This is consistent with the characterization of the material synthesized at 250 'C, which was also surrounded by a poorly crystallized state. The crystallite size was around 15 nm... 142
Figure 4-14. XRD patterns of (a) the stoichiometric material and (b) the off-stoichiometric material synthesized at 800 *C. L1: Li3PO4, L2: Li4P20 7, and Fl: Fe2P ... 146
Figure 4-15. TEM images of the stoichiometric and the off-stoichiometric material. (a) the stoichiometric material synthesized at 600 *C, (b) and (c) the off-stoichiometric material synthesized at 600 *C and 700 *C, respectively. The stoichiometric material didn't show the poorly crystallized phase on the surface indicated by lattice fringes while the off-stoichiometric
material showed the poorly crystallized phase on the surface and the crystalline phase was surrounded by the poorly crystallized phase. ... 149
Figure 4-16a. SEM image of LiFePO4 with different precursors synthesized at 700 *C. The
morphology is faceted, not sphere. This morphology is an equilibrium shape considering the anisotropic grain growth rate and surface energy of LiFePO4. The particle size is large, 1 I m.
... 15 2
Figure 4-16b. STEM image of the stoichiometric material synthesized at 600 *C. The morphology of the particle is faceted, not a uniform sphere. The size is around 100 -150 nm with a large variation. The faceted morphology indicated that the grain growth was active. Scale bar:
10 0 nm ... 152
Figure 4-16c. STEM image of the off-stoichiometric material synthesized at 600 *C. The particle size of the off-stoichiometric material is less than 50nm with a small variation. The morphology of the particle was close to sphere. (Scale bar: 100 nm)... 153
Figure 4- 17. XRD patterns of the off-stoichiometric materials at different sintering times and temperatures (a) at 700 *C for 10hrs (b) at 700 *C for 60 hrs, and (c) at 800 *C for 10hrs. Li: Li3PO 4, F1: Fe2P, and L2: Li4P2O 7 ... ... .. ... ... .. 155
Figure 4-18a. SEM image for the off-stoichiometric material synthesized at 700 "C for 10 hrs. The particle size is also less than 50 nm comparable with that of 600C. Also, the morphology is a uniform sphere like 600 *C m aterial ... 156
Figure 4-18b. SEM image of the off-stoichiometric material synthesized at 700 *C for 60 hrs. The particle size is also less than 50 nm. Also, the morphology is close to a uniform sphere.
... 1 5 7
Figure 4-18c. SEM image of the off-stoichiometric material synthesized at 800 *C for 10hrs. The particle size is 400 ~ 500 nm and the shape of the particle is faceted hexagon-like shape, not
sphere-like...157
Figure 4-18d. Schematic diagram of the particle size and morphology at different times and different temperatures in the off-stoichiometric material based on SEM data... 158
Figure 4- 19. Schematic structural and chemical separation of the off-stoichiometric material during entire process based on experimental data. (a) The structure of the ball-milled powder (Before heat treatment) (b) The structure of the material obtained at 1st heat treatment at 350 *C
(c) The structure of the material obtained at 2nd heat treatment at 600 *C or 700 *C heating (d)
The structure of the material obtained at 2nd heat treatment at 800 *C. ... 161
Figure 5-1. Calculated Li-Fe-P ternary phase diagram equilibrated with an oxygen potential under reducing conditions. The 'A' arrow indicates off-stoichiometry induced in the samples described in this chapter. The 'B' and 'C' arrow respectively indicate the more common one-to-one Fe/P deficiency and lithium deficiency. The shaded area in phase diagram indicates relevant coating com positions... 169
Figure 5-2. The Rietveld refinement result of LiFeo 9Po9504-8 synthesized at 600"C under Ar. The
Rwp is 5.677 and the Rp is 2.458. (From X'pert High Score plus software)... 173
Figure 5-4. XRD patterns of the LiFePo.9Po.95044 materials synthesized at different temperatures
under Ar. Fe2P starts to appear at 700'C. Li4P207 starts to crystallize at 8000C... 175
Figure 5-5. Characterization of the LiFePo.9Po.9504- material synthesized at 600*C under Ar. ... 17 6
Figure 5-6. Comparison of phosphorus 2p XPS spectra at different compounds. The data is normalized by counts per second. The data was corrected by the binding energy of the adventitious hydrocarbon, 248.8 eV [25]...178
Figure 5-7. Phosphorus 2p XPS spectra from three different compounds. (a) LiFePO4, (b)
LiFeo.9Po.9504.., and (c) Li4P207. The vertical blue dash line is the P
2
p3/2 peak from LiFePO4 and
the vertical pink dotted line is the P 2
P3/2 peak from Li4P207... ... ... 179
Figure 5-8. Point elemental analysis data from STEM measurement for LiFeo9Po.9 5
04-synthesized at 600*C under Ar. (a) STEM bright field image at region 1, (b) STEM dark field image at region 1. The red circle indicates where the surface measurement as taken, and the blue circle represents the measurement in the grain interior. This measurement was repeated at two additional regions of the sample. The result for all three regions is given in (c). Scale bar is 100 n m ... 18 1
Figure 5-9. (a) STEM data for stoichiometric LiFePO4 synthesized at 600'C. (b) The ratio of iron
to phosphorus (Fe/P) from STEM point analysis from different regions for LiFePO4 synthesized
at 600'C . Scale bar: 100nm ... 183
Figure 5-10. Mdssbauer spectroscopy for LiFeo.9Po.9 5044 synthesized at 600*C. The
observed data. Blue solid line: fitted LiFePO4 Red solid line: fitted data for different iron
environm ents... 184
Figure 5-11. Missbauer spectroscopy for LiFeo 9Po.95O4- synthesized at 600*C. The
measurement was performed at 77.3K. The value is relative to iron metal foil. Solid open circle:
observed data. Blue solid line: fitted LiFePO4 Red solid line: fitted data for different iron
env ironm ent...186
Figure 5-12. A map of the value of IS and QS in several crystalline systems and inorganic glass systems at room temperature[27, 30-42]. The shaded region represents the IS and QS value of Fe3 in octahedral site in inorganic glasses system[35]. ... 191
Figure 5-13. Electrochemical voltage profile between 3.2V and 2.OV for a cell started in discharge with as-made LiFeo.9Po.9 504.. synthesized at 6000C. The rate was C/30 based on
LiFePO4, which has 170 mA/g at IC. The loading density was 2.93 mg/cm2. The electrode was
composed of active material (80), carbon (15), and binder (5) (weight percentage)... 193
Figure 5-14. "P MAS NMR spectra of three samples around 0 ppm at 38 kHz at room tem perature...196
Figure 5-15. Volume Vs 'a' lattice parameter data for LiFePO4 obtained from several
literatures[l1-13, 23, 47, 51-55]. ... 198
Figure 5-16. The volume of LiFePO4 as a function of the particle size. Small particle size shows
smaller volume. Also, LiFePO4 in two-phase region shows smaller volume than stoichiometric
Figure 5-17. Discharge rate capability and capacity retention for LiFeo9Po.9 504.3 synthesized at 600*C (a) Discharge rate capability after charging at C/5 and holding at 4.3 V until the current
reaches C/60. The density of the electrode is 3.86mg/cm2. The voltage window is 2.0 ~ 4.3V. (b) Capacity retentions when performing charge and discharge cycles at 20C and 60C constant current rate without holding the voltage for 50 cycles. The density of the electrode is 3.60mg/cm2 for 20C rate and 2.71mg/cm2 for 60C rate. The voltage window is 2.5 - 4.3V. The
formulation of electrode was 80(active): 15(carbon): 5(binder) in weight percentage.. 201
Figure 5-18. Charge and discharge voltage profile at (a) 20C and 60C of LiFeo.9Po.9 504-3
synthesized at 600*C for the l' and 50th cycle. The cell was charged at 20C (60C) and
discharged at 20C (60C) with a 1 min open-circuit rest at the end of each charge/discharge cycle. The loading density was 3.6 mg/cm2 for 20C rate and 2.71 mg/cm2 for 60C. The voltage window
was 2.5 ~ 4.3V and the formulation of electrode was 80 (active), 15 (carbon), and 5 (binder) in w t% . ... 2 04
Figure 5-19. Discharge rate capability and capacity retention for LiFeo.9Po.9504.. synthesized at 700*C (a) Discharge rate capability after charging at C/2 and holding at 4.3 V until the current
reaches 0.01 mA. The density of the electrode is 3.53mg/cm2. (b) Capacity retention when performing full charge/discharge cycles at 20C constant current rate without holding the voltage for 50 cycles. The density of the electrode for 20C is 3.44 mg/cm2. The voltage window for both
test was 2.5 ~ 4.3V. The formulation of electrode was 80(active), 15(carbon), and 5(binder) in w t% . ... 2 0 5
Figure 5-20. Charge and discharge voltage profile at 20C of LiFeo 9Po 9504.3 synthesized at 7000C
open-circuit rest at the end of each charge/discharge cycle. The voltage window was 2.5 ~ 4.3V and the loading density was 3.44 mg/cm2. The formulation of electrode was 80 (active), 15 (carbon),
and 5 (binder) in w t% ... 206
Figure 5-21. Charge and discharge voltage profile (a) at 200C for the Is, 5 0th and 10 0th Cycle and
(b) at 400C for the Is, 3 0th and 10 0th cycle of LiFeo 9Po 9504.3 synthesized at 600*C. The cell was
charged at 200C (400C) and discharged at 200C (400C) with a 1 min open-circuit rest at the end of each charge/discharge cycle. The voltage window was 2.0 ~ 4.5V and the loading density was
2.96 mg cm -2. The formulation of electrode was 30(active), 65(carbon), and 5(binder) in wt%.
... 2 0 8
Figure 5-22. Charge and discharge capacity retention data at 200C and 400C of LiFeo 9Po. 9504.3 synthesized at 600*C. Note that the 1St charge capacity is always larger than 1st discharge
cap acity ... 2 0 9
Figure 5-23. Discharge and charge voltage profile for carbon and binder in the same quantities. Electrode (a) is 92.9 wt% carbon and 7.1 wt% binder, and the high rate electrode (b) is 94.4 wt% carbon and 5.6 wt% binder. The currents in the legend are gram of electrode mass (carbon + binder). For comparison, the current in the 200C experiments was around I1 A/g of total electro de m ass... 2 11
Figure 5-24. XRD pattern of stoichiometric LiFePO4 synthesized at 600 *C under Ar with
extensive ball milled precursors. The crystallite size obtained from Rietveld refinement is
33.lnm, which is comparable with that of LiFeo.9P 9504..6, 32.4 nm... 213
Figure 5-26. Discharge rate capability for (a) LiFeo 9Po.9504. and (b) BM-LiFePO4 synthesized at 600'C (a) Discharge rate capability was performed after charging at C/5 and holding at 4.3 V
until the current reaches C/60. The density of the electrode is 3.86 mg/cm2 for LiFeo.9Po.9sO4- and
3.15 mg/cm2 for BM-LiFePO
4. The voltage window is 2.0 ~ 4.3V. The formulation of electrode
was 80 (active), 15 (carbon), and 5 (binder) in wt% ... 215
Figure 5-27. Capacity retentions when performing charge and discharge cycles 60C constant current rate without holding the voltage for 50 cycles. The density of the electrode is 2.71mg/cm2 for LiFeo 9Po.9504 and 2.93mg/cm2 for BM-LiFePO4. The voltage window is 2.5 ~
4.3V. The formulation of electrode was 80(active): 15(carbon): 5(binder) in weight percentage.
... 2 16
Figure 5-28. Discharge at various rates for ball-milled LiFePO4 and LiFeo 9Po.9504-8 with similar
particle size. The cells were charged at C/2 and held at 4.3V until the current reaches C/20. The loading density was 3.18 mg/cm2 for LiFeosP.
95044 and 3.11 mg/cm2 for LiFePO4. The
formulation of electrode is 30 (active): 65 (carbon): 5 (binder) in wt %... 217
Figure 6-1. XRD patterns of (a) LiFePO4 and (b) chemically delithiated LixFePO4. The
composition of the delithiated material is Lio.4 9FePO4 based on XRD refinement. This value is
consistent with the mole ratio of LiFePO4 to NO2BF4... ... .. ... 234
Figure 6-2a. SEM image of pristine LiFePO4. The image shows a wide range of particle size
d istribution ... 2 35
Figure 6-2b. Particle size distribution of pristine LiFePO4 collected with a set of SEM images
is around 1.3 pm. Particle size distribution (PSD) is sufficiently wide for separating the material. The centrifuge method can separate the material by different particle size... 235
Figure 6-2c. SEM image of the chemically delithiated Lio.49FePO4. The particle size and
morphology is similar to the pristine LiFePO4... ... ... 236
Figure 6-3a. SEM image of Lio.49FePO4 obtained at 0 rpm (Gravitational method). The average
particle size is around 1.5ptm, which is larger than the average particle size of the pristine or chemically delithiated material with global composition... 238
Figure 6-3b. SEM image of Lio.49FePO4 after centrifuging at 4,200rpm. The particle size is much
smaller than that of the pristine and chemically delithiated material with global composition. The average particle size is around 500 nm . ... 238
Figure 6-3c. SEM image of Lio.49FePO4 obtained at 0 rpm (gravitational method). The centrifuge
method cannot differentiate between large homogeneous particles and secondary particles (i.e., agglomerates of small particles) of similar size... 239
Figure 6-4. XRD measurements of samples obtained at different centrifuge speeds and of pristine LiFePO4. (a) Pristine LiFePO4, (b) 0 rpm (Gravitational method, IG), (c) global composition
(homogeneously mixed), and (d) 4,200 rpm (3,398G). Even at the same global composition, the phase fraction depends on particle size (centrifuge speed). L: LiFePO4 and F: FePO4.. 241
Figure 6-5. XRD patterns of Lio.78FePO4 obtained at different centrifuge speeds. (a) Material
obtained at 4,200 rpm (3,398G), and (b) Material with global composition (homogeneously mixed). Even at the same global composition, the phase fraction depends on particle size as
previously seen. At 4,200 rpm, the phase fraction was 56 wt% FePO4 and 44 wt% LiFePO4. L:
L iFePO 4 and F : FePO 4 ... .. .. ... ... ... ...243
Figure 6-6. Phase fraction of the material obtained at 4,200 rpm with different global composition. (a) Lio.49FePO4 (global composition = 0.51) (b) Lio 78FePO4 (global composition =
0.22) L: LiFePO 4 and F: FePO 4... ... ... .. ... .. 244
Figure 6-7. Schematic diagram for two proposed models of the delithiation process with a broad particle size distribution. (a) and (d) show LiFePO4 phase and FePO4 phase, (b) and (c) show a
delithiated state with different global compositions (x and y) with x being smaller than y. The mosaic model allows for two phases in one particle and the domino cascade model postulates one phase in one particle. Empty and filled circles represent LiFePO4 and FePO4, respectively.
... 2 4 5
Figure 6-8. Comparison of weight percentage of FePO4 at similar particle size and predictions
from two proposed models, Mosaic and Domino cascade. The domino cascade model predicts that the weight percentage of FePO4 is independent of global composition. Thus, the dependence
of phase fraction is compatible with the prediction from the mosaic model at different global com po sition s... 24 8
Figure 6-9. Voltage profiles at different charge rates and with different charge procedures for pristine LiFePO4 (a) Charge at C/20 (b) charge at 2C (c) charge at C/20 for 2 hours and then
charge at 5C for 1 min with 12 hrs rest period between charges repeating this procedure until the voltage reaches the cut-off voltage. Even though the cell exhibits a flat potential, the material still shows nucleation overshooting behavior at state 'A'. 'A' is about 10% SOC state. The cut-off voltage is 4.3V ... 249
Figure 7-1. XRD pattern and refinement result on the LiMno 9Po.9504, sample synthesized at 700'C under Ar. The structural model for XRD refinement was olivine LiMnPO4... 259
Figure 7-2. SEM image of LiMno 9Po 9504, synthesized at 700*C under Ar... 260
Figure 7-3. XRD pattern of LiMno 9Po 9504, synthesized at 700*C under air. Besides LiMnPO4,
Li3PO 4 and Li4P20 7 are present. ... 261
Figure 7-4. (a) Voltage profile of stoichiometric LiMnPO4 at C/20 and (b) Voltage profile of
L iM no 9PO 950 4- at C /20. ... 263
Figure 7-5. Comparison of the capacity retention of LiMno 9Po.9504, and LiMnPO4 at IC rate.
The cell was charged at IC and discharged at IC in a voltage window from 3.OV to 4.8V. The formulation of the electrode was 80: 15: 5 in a ratio of active, carbon, and binder in wt%, respectively. Inset shows the corresponding voltage profiles of LiMn. 9Po.9 5 04. and LiMnPO4 at
l' and 5 0th cycle at IC rate... 264
Figure 7-6. Rate capability of LiMno.9Po.9504. synthesized at 700*C under Ar. The cell was
charged at C/20 and held at 4.8V until the current reached C/100 and was discharged at various rates. The discharge test at 2C was the first cycle. The sequence of the discharge tests: 2C4 C/104 1C- C/5. The voltage window is 3.0 ~ 4.8V. ... 265
Figure 7-7. Comparison of the discharge behavior of LiMno.9Po.9504. and LiFeo 9Po 9504.. Both
materials were discharged at 2C. The LiMnPO4 data is the same as in Figure 6. The
off-stoichiometric LiFePO4 was charged at C/5 and held at 4.3V until the current reached C/20. The
Figure 7-8. Electrochemical performance of the electrode formulated with 65 wt% carbon in the LiMno 9Po.9sO4.. The cells were charged and discharged in constant current mode. The loading
density of the electrode with 65 wt% carbon was 3.61 mg/cm2. The voltage window is 3.0 ~ 4 .8V ... 2 6 7
List of Tables
Table 1-1. Comparison of ionic conductivity in various electrolyte systems[3]... 36
Table 1- 2. Comparison of three major cathode materials in terms of their properties. .. 43
Table 2-1. Connectivity of cations in olivine structure[1]. ... 51
Table 2- 2. Lattice parameters and unit volume of LiFePO4 and FePO4. The data is from
A ndersson et al. [42]... 62
Table 3-1. Refinement result of XRD patterns of LiFe-2xPi-xO4 (x = 0, 0.01, 0.03, 0.05, 0.15, and 0.25) synthesized at 700 *C under Ar. The weight percentage of each compound in parentheses
was obtained from XRD refinement. ... 86
Table 3-2. Refinement result of XRD patterns of LiFe..2xPI-xO4 (x = 0 and 0.05) synthesized at
different temperatures under Ar. The weight percentage of each compound was obtained from X R D refinem ent... 9 1
Table 3-3a. Secondary phases and weight percentage obtained from XRD refinement results in Li2FePO4 (x = 0, 0.1, 0.03, and 0.5) and Li3Feo.sPO4. T: Triclinic and M: Monoclinic .. 93
Table 3-3b. XRD refinement results of Li2Feo.5PO4 (sample 9) synthesized at different
tem p eratures... 9 5
Table 3-4. XRD results of LiFeo 9 5Po,904 (Sample 11) synthesized at 550 *C and 700 *C under Ar.
Table 3-5. Lattice parameters and volume of LiFei-2xPIx0 4 samples and LiFeo 95Po 904
synthesized at 700 *C under Ar. The results are obtained by XRD refinement. ... 101
Table 4-1. The existence of the amorphous phase and crystalline phases at different temperatures. The weight percentages were from the result of XRD refinement. # :The hump around 20 - 400 in XRD patterns represents the existence of amorphous phase. ... 132
Table 4-2. XRD refinement results of the stoichiometric and the off-stoichiometric material synthesized at 600'C. The lattice parameters and crystallite size were different from each other. The off-stoichiometric material showed smaller crystallite size than the stoichiometric one. The results were obtained from XRD refinements. ... 138
Table 4-3. Phases and weight percentage of the stoichiometric and the off-stoichiometric material synthesized at different temperatures. The results were obtained from XRD refinements.
() represents the w eight percentage... 147
Table 5-1. Binding energy difference between lithium phosphate compounds based on Mogan et
a l.[2 4 ]... 17 7
Table 5-2. Fitted peak positions based on P 2p doublet for LiFePO4, LiFeo 9Po.9s044, and
Li4P207. The line shape of peak for fitting is the product of a Gaussian (0.7) and a Lorentzian (0.3). The parameters of P 2p/2 peak were made to depend on those of P 2p3/2 peak by a constant shift and fixed ratio of integrated intensity... 180
Table 5-3. Fitted data using Lorentzian shape peak for M6ssbauer spectroscopy for LiFeo.9Po.95044 synthesized at 600'C. The measurement was performed at 293K. The
x
2 isTable 5-4. Fitted data using Lorentzian shape peak for Mtssbauer spectroscopy for LiFeo.9Po.950 4- synthesized at 6000C. The measurement was performed at 77.3K. The
x
2 is1.8 5 9 ... 18 6
Table 5-5. Literature MS data of Fe2P and FeP at room temperature in literatures. a: amorphous
and c: crystalline... 188
Table 5-6. Literature MS data of Amorphous Fe2P and FeP at low temperature (8k or 77K).
... ... 18 8
Table 5-7. Literature MS data for LiFePO4, FePO4, and Li3Fe2(PO4)3 at room temperature. ... 1 8 9
Table 5-8. Values of isomer shift (IS) in inorganic glasses as a function of coordination number.
... 19 0
Table 5-9. Comparison of MS data of the off-stoichiometric material and air exposed LiFePO4. ... 19 4
Table 6-1. Summary of experimental studies investigating the delithiation behavior of LiFePO4
system. Based on these results, the shrinking-core model seems least capable of describing the pathw ay of phase transform ation... 229
Table 6-2. Phase fraction of FePO4 to LiFePO4 of the chemically delithiated Lio.49FePO4 material
for samples centrifuged at different speeds. The weight percentage of the phase was obtained from XRD refinements. The average particle size was obtained from SEM measurement.242
Table 6-3. The phase fraction of samples separated at 4,200 rpm with different global composition. The particle size of both samples is similar. But, the phase fraction is different for the com pared global com positions... 244
Chapter 1. Introduction and Thesis outline
1.1 Introduction
Since lithium ion batteries have been introduced by Sony corporation in 1991, batteries as an convenient power source have been widely used in portable electronics such as cellular phones, multimedia players, laptop computers because they have a high gravimetric and volumetric energy density compared to other battery technologies as shown in Figure 1-1. The most important factor for these devices where size and weight must be considered is volumetric energy density. Intense research focuses on the increase of this density.
400 300 200 LLJ 100 0 Lighter weight 0 50 100 150 Energy density (W h kgl) 200 250
Figure 1-1. Comparison of the different rechargeable batteries and gravimetric energy density[ 1].
in terms of volumetric
However, the requirement of lithium ion batteries depends on the applications. For example, large-scale energy storage for renewable energy sources such as wind and
solar is next feasible application. Lithium ion batteries for this application will have large gravimetric energy density and inexpensive cost rather than volumetric one. The advent of high power applications such as plug-in hybrid electric vehicles (PHEV), hybrid electric vehicles (HEV), electric vehicles (EV) as shown in Figure 1-2 also dramatically changes the requirements of lithium ion batteries. The critical factors in such high power applications where size and weight is less important are safety, long calendar life, cost, and power capability rather than volumetric energy density. Different requirements of batteries demand different properties of materials. For example, the material in batteries in PHEV must be able to be deeply charged and discharged during cycling besides high power capability while the material in HEV needs high power capability only in middle of charged state. So, the stability of the material at fully charged state in PHEV is much more important than HEV. The realization of advanced technology really depends on materials used in batteries. The power capability of a lithium ion battery with electrode materials will depend critically on the rate at which the Li* ions and electrons can migrate through the electrolyte and composite electrode structure, into the active electrode material. To improve rate capability, the kinetic properties such as ionic and electronic conductivity of the material and kinetic behaviors such as phase change and transports of material during charging/discharging should be understood and improved.
Electric vehicles and bikes
Highpower
Portable devices gpoe
High eneg density
Large scale storage
Figure 1-2. A variety of applications such as portable electronics, power tools, electric vehicle and bike, and large-scale energy storage.
1.2 Background of lithium ion batteries
An electrochemical cell is a device that converts chemical energy into electrical energy by means of an electrochemical oxidation-reduction (redox) reaction. Lithium ion batteries are composed of one or more electrochemical cells connected in series or parallel and rechargeable secondary battery. By supplying an electrical current to move electrons from positive electrode to negative electrode, chemical reaction is reversed and the battery is recharged. Figure 1-3 shows the schematic diagram of lithium ion batteries. Chemical oxidation reaction occurs at negative electrode and reduction processes occurs at positive electrode. Two electrodes are physically separated by the separator in the electrolyte, which is the medium for transfer of charged ions. These four are basic components of an electrochemical cell. The
electrochemically active ingredient of the positive or negative electrode is called the active material. The electrodes must be mixed conductors. Negative electrodes give up electrons and positive electrodes accept these electrons. The flow of electrons in the cell goes through the external electrical circuit that connects the two electrodes.
L E+
Electrolyte
Figure 1-3. Schematic diagram of lithium ion cell. The cell is composed of cathode, anode, the separator, and the electrolyte.
1.3 Components of Lithium ion batteries
1.3.1 Cathode (positive electrode)
The positive electrode is transition metal oxides or some other compounds that are capable of being reduced during cell discharge and accepts electrons from the external circuit during electrochemical reaction. The cathode in lithium ion batteries is a thin layer composite film which is composed of the active material, conducting
additive such as carbon nanotube or carbon black to facilitate electron transfer and binder. The performance of lithium ion batteries is mainly limited by the property of cathode, especially the active material.
Requirements for Li-ion cathode Materials [2]
e High free energy of reaction with lithium (higher voltage) " Can incorporate large quantities of lithium (larger capacity)
* Reversibly incorporates lithium without structural change (better stability) * High lithium ion diffusivity and good electronic conductivity (Fast kinetic) * Insoluble in the electrolyte (better stability)
* Low cost synthesis (marketability)
1.3.2 Anode (negative electrode)
The negative electrode is a metal or an alloy or carbon that is capable of being oxidized during cell discharge and gives up electrons in the external circuit during electrochemical reaction. The anode is a thin layer composite film which is composed of graphite or other types of carbons and binder.
1.3.3 The electrolyte
The electrolyte is the medium that transfers charge between positive and negative electrodes of a cell. The electrolyte in lithium ion batteries is a non-aqueous organic solvent with dissolved lithium salt such as LiPF6, LiClO4, and LiBF4 with a higher
potential window. Also, the electrolyte must be an insulator for electrons in order to avoid short circuit in the cell. Table 1-1 shows the ionic conductivity of well-known electrolyte systems.
TABLE 2.1 Conductivity Ranges of Various Electrolytes at Ambient Temperature
Specific conductivity, Electrolyte system 1-1 cm-' Aqueous electrolytes 1-5 x 10-Molten salt -10-' Inorganic electrolytes 2 x 10⁻²-10-' Organic electrolytes 10-10-2 Polymer electrolytes 10--10
Inorganic solid electrolytes 10-1-105
Table 1-1. Comparison of ionic conductivity in various electrolyte systems[3].
1.3.4 The separator
The separator is the electrically insulating polymer layer of material that physically separates electrodes of opposite polarity. Separators must be permeable to lithium ions of the electrolyte. So, separators require a reasonable porosity and excellent wetting ability to the electrolyte.
1.4 Intercalation process
Electrochemical reaction in lithium ion batteries occurs through intercalation process of lithium ions into cathode or anode. Intercalation process is that lithium ions insert into unoccupied interstitial sites in the crystal structure of a host material such as cathode and anode. So, intercalation process causes the structural changes of the host material such as volume. However, the incorporation of lithium ions usually occurs topotatically, without any significant change to the host. Intercalation compound is the host material which is capable of inserting and extracting the lithium ions. The cathode and anode in lithium ion batteries typically have either a layered structure or a tunnel structure.
1.5 Parameters of lithium ion batteries
1.5.1 Voltage (V)
The Gibbs free energy of the electrochemical reaction determines the voltage of the cell. The electrochemical potential of one component is the sum of electrical potential and chemical potential.
where i is the chemical potential of species i, zi is the effective charge on lithium, F is Faraday's constant (96,487 C) and & is the electrical potential.
The electrochemical potential should make equilibrium at the cathode and anode if there is no external current. Under this equilibrium condition, the cell voltage is obtained by the Nernst equation.
The cell voltage is driven by the difference of Li chemical potential in both electrodes. During charging and discharging of a cell, measuring the voltage is equal to measure the chemical potential of lithium. For example, Potentiostatic Intermittent Titration Technique (PITT) measurement controls the Li chemical potential to measure current relaxation with time. The voltage is primarily determined by the chemistry of the active material in the electrode and measured with respect to the metallic lithium (Vs. Li*/Li).
1.5.2 Theoretical capacity (mAh/g)
Theoretical capacity of a cell is the amount of charge able to be generated, typically defined in terms of ampere-hours. Theoretically, molecular weight of the active materials with 1 electron delivers 26.8 Ah or 96,487 C. The capacity in lithium ion cell is only based on active materials participating in electrochemical reaction. This value also depends on the chemistry of the active material.
1.5.3 Specific energy (Wh/kg) and energy density (Wh/L)
The energy obtained from the cell is the voltage times the capacity of the cell, typically defined in terms of watthour (Wh). Specific energy and energy density is defined as energy per unit weight and energy per unit volume, respectively.
1.5.4 Specific power (W/kg)
Specific power is defined as the power delivered from the cell per unit weight
(W/kg). Power is a product of the voltage and the current. Specific power shows the
"torque" available from the battery.
1.5.5 Cycle life
It is defined as possible number of charge/discharge cycles before the capacity falls below a certain percentage (often 80%) of its initial capacity. The cycle life is dependent on many factors such as the formation of a stable SEI (Solid Electrolyte Interphase) layer, the stability of electrolyte, and the structural stability of electrodes. Most of all, the cycle life is believed to depend primarily on the stability of the electrode material during operation.
1.6 Anode materials for Lithium ion cells
1.6.1 Carbon anode
Lithium metal as an anode is the best choice because it is the lightest and most electropositive and has a high specific capacity, 3860 mAh/g. However, the strong reactivity with the electrolyte and the formation of dendrite during charge/discharge make metallic lithium unpractical. In lithium ion batteries, the anode is usually related to carbon such as graphite or MCMB (Mesocarbon Microbead). Graphite is a layered
structure, allowing lithium ions to intercalate between the layers. Theoretical capacity of graphite is 372 mAh/g corresponding to LiC6. The average potential of graphite is
close to 0.3 ~ 0.1V vs. Lie/Li leading to higher voltage of the cell. At high rates, lithium ions can be deposited on carbon anode because of a large overpotential induced by high rates compared to low equilibrium potential of carbon as shown in Figure 1-4.
1.6.2 Li4Ti5O1 2 for high rate system
Alternative anode for high rates cell is lithium titanates (Li4TisO 12) which has
reasonable capacity (-175 mAh/g), high rate capability[4-6] with zero strain during charging/discharging[7]. Also, there is no problem with a lithium metal deposition induced by a large overpotential because of high equilibrium potential of this material, 1.50V Vs. Lie/Li. However, the high potential of this material decreases the overall cell voltage leading to reduced energy density.
Cycling of a Graphite-CoO
2Cell
Electrolyte oxidation
4 .4 ---.. - - .. . .- .. .. .. ..--- ---... -... ..
3.9 Cobalt oxide
3.4 LiCo02-+Li++e-+Co0 2 140 mAh/g
ci 2.9 Electrolyte:
LiPF6 in Ethylene
carbonae/diethyl Solvent reduction- Passive film formation
S1.9 cabnt
1.4
0.9
0.4 Li++e-+C6-- LiC6 Graphite 372 mAh/g
-0.1 ~ -~-~
0 0.2 0.4 0.6 0.8 1 1.2
x in Lix C6 or y in Li10 .6 CoO2 Lithium deposition
Figure 1-4. Typical voltage profile at anode and cathode in lithium ion batteries[8].
1.7 Cathode materials in lithium ion batteries
1.7.1 Layered structure (LiMO2)
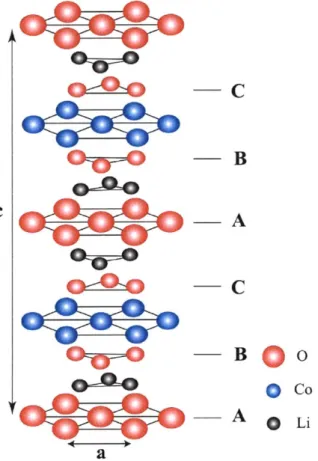
Typical layered structure is in Figure 1-5. It consists of close-packed oxygen arrangement and is stacked in ABCABC sequence. LiCoO2 with a layered structure is
the first Li-ion products marketed and still in use. Due to the high cost of cobalt and the structural stability at charged state (LixCoO2, x < 0.5), researchers are developing
new formulations, multi-cations layered oxides such as the combination of three layered compounds, LiCoO2, LiMnO2, and LiNiO2. Each transition metal in
multi-cations layered compounds can tune the specific properties of the cell such as the capacity, the structural and thermal stability, and rate capability. Two promising
compounds in layered compounds Li(Nii 3Mni/3CoI,3)02 (NMC)[9-1 1] and
Li(Nio.8Coo.15Alo.0 5)02 (NCA)[12]. The former shows high energy density with
reasonable thermal and structural stability and is attractive for portable devices. The latter performs quite well in terms of power density, energy density and longevity and is attractive for high power applications but high nickel contents in it tend to release oxygen[13, 14] leading to safety issues.
OW-- B
C
e o c --- _ ACO
O Co --_ A 0 Li aFigure 1-5. Schematic layered structure based on a-NaFeO2 structure. Lithium and
cobalt are occupied in octahedral site.
1.7.2 Spinel system (LiMn204)
LiMn204 has a spinel structure which has a three-dimensional framework and
shows fast ionic and electronic conductivity. Figure 1-6 shows the structure of LiMn2O4. This material is attractive cathode material in terms of its low cost,
environmental friendliness, high rate capability and excellent thermal safety. However, stoichiometric LiMn204 observes the degradation of performance[15] at
high temperature because of the dissolution of Mn2+ obtained from the
disproportionation reaction of Mn3+ (2Mn3+ 4 Mn + Mn2+) in the
electrolyte[16-18].
0
Figure 1-6. Crystal structure of spinel, LiMn204. Green circles are lithium ions and
violet octahedrons are MnO6.
Thus, LiMn2O4 is modified with the excess of lithium and doping with A13+[19] to
reduce the ratio of Mn3* to Mn** or coating with C030 4[16] to prevent the reaction
with the electrolyte on the surface resulting in good capacity retention even at high temperature. However, the decrease of Mn3+ can lead to reduced energy density. The other approach is the change of the electrolyte with additives because the acidic environment in the electrolyte induced by the impurity makes the dissolution worse [20].
1.7.3 LiMPO4 (M =Fe, Mn, Co, Ni)
LiMPO4, especially LiFePO4 has attracted a lot of attention as a cathode material
because of its thermal and structural stability, its inexpensive cost, and environmental friendliness. LiFePO4 is the topic of this thesis, so a detailed overview will be
discussed in chapter 2. Table 1-2 shows the comparison of three major cathode materials in lithium ion batteries.
Layered Structure Spinel Structure Olivine Structure
(R3m) (Fd3m) (Pnma)
Materials LiCoO2 LiMn204 LiFePO4
Practical Capacity 160 ~170 110~120
170
(mAh/g)
Average voltage ~ 4V ~ 4V ~ 3.5 V
Ionic conduction 2D-Channel 3D-Channel 1D-Channel
Electronic conductivity 2-3 10to s 10
0-(S-cm-')
1.8 Motivation and Thesis outline
The advent of high power applications such as power tools, hybrid electric vehicles (HEV), plug-in electric vehicles (PHEV), and electric vehicles (EV) changes the requirement of lithium ion batteries from high energy density to safety, high power capability, and inexpensive cost. LiFePO4 has received a lot of attention because it
meets the requirements of high power applications, except high power capability. The poor rate capability of LiFePO4 is believed to be from poor electronic conductivity.
Strategies to increase sluggish electrochemical performance are focusing on improving electron transport in the bulk through doping or at the surface of the material through making composite materials with carbon and metallic iron phosphides. These strategies substantially improve the electrochemical performance. Considering that LiFePO4 is a pure one dimensional lithium conductor, lithium transport is equally important for achieving high rate capability and should be improved. The strong anisotropic lithium diffusion seriously affects the transport of lithium in both the bulk and the surface. For example, the blocking 1-d lithium diffusion in the bulk fails to achieve high rate capability leading to poor
electrochemical performance. Furthermore, whereas LiFePO4 can in principle
exchange lithium ions with the electrolyte on all surface facets, lithium ions can only move into the bulk of the crystal in the one [010] direction. High rate capability in LiFePO4 is achieved by optimizing lithium transports in both the bulk and the surface.
The objective of this thesis is to experimentally develop a method to improve rate capability of LiFePO4 by improving the lithium transport of both the bulk and the
![Figure 1-1. Comparison of the different rechargeable batteries and gravimetric energy density[ 1].](https://thumb-eu.123doks.com/thumbv2/123doknet/14723287.571035/31.918.290.647.563.853/figure-comparison-different-rechargeable-batteries-gravimetric-energy-density.webp)
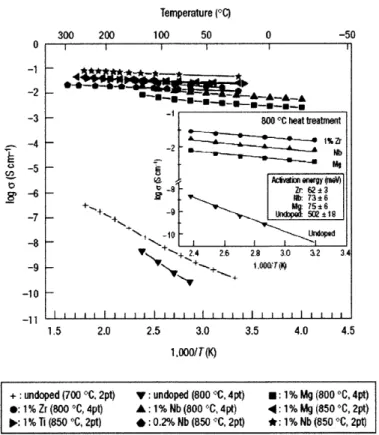
![Figure 2-4. Electronic conductivity[29] for LiFePO 4 /C and pure LiFePO 4 induced by carbon coating method.](https://thumb-eu.123doks.com/thumbv2/123doknet/14723287.571035/57.918.260.679.116.471/figure-electronic-conductivity-lifepo-lifepo-induced-carbon-coating.webp)
![Figure 2-11. Schematic diagram for Mosaic model from Andersson et al. [50].](https://thumb-eu.123doks.com/thumbv2/123doknet/14723287.571035/68.918.332.596.120.473/figure-schematic-diagram-mosaic-model-andersson-et-al.webp)