HAL Id: hal-00302314
https://hal.archives-ouvertes.fr/hal-00302314
Submitted on 28 Nov 2006HAL is a multi-disciplinary open access
archive for the deposit and dissemination of sci-entific research documents, whether they are pub-lished or not. The documents may come from teaching and research institutions in France or abroad, or from public or private research centers.
L’archive ouverte pluridisciplinaire HAL, est destinée au dépôt et à la diffusion de documents scientifiques de niveau recherche, publiés ou non, émanant des établissements d’enseignement et de recherche français ou étrangers, des laboratoires publics ou privés.
Is aerosol formation in cirrus clouds possible?
J. Kazil, E. R. Lovejoy, E. J. Jensen, D. R. Hanson
To cite this version:
J. Kazil, E. R. Lovejoy, E. J. Jensen, D. R. Hanson. Is aerosol formation in cirrus clouds possible?. Atmospheric Chemistry and Physics Discussions, European Geosciences Union, 2006, 6 (6), pp.12179-12197. �hal-00302314�
ACPD
6, 12179–12197, 2006 Aerosol formation in cirrus J. Kazil et al. Title Page Abstract Introduction Conclusions References Tables Figures ◭ ◮ ◭ ◮ Back CloseFull Screen / Esc
Printer-friendly Version
Interactive Discussion
EGU Atmos. Chem. Phys. Discuss., 6, 12179–12197, 2006
www.atmos-chem-phys-discuss.net/6/12179/2006/ © Author(s) 2006. This work is licensed
under a Creative Commons License.
Atmospheric Chemistry and Physics Discussions
Is aerosol formation in cirrus clouds
possible?
J. Kazil1, E. R. Lovejoy1, E. J. Jensen2, and D. R. Hanson3 1
NOAA Earth System Research Laboratory, Boulder, CO, USA
2
NASA Ames Research Center, Moffett Field, CA, USA
3
Augsburg College, Minneapolis, MN, USA
Received: 18 October 2006 – Accepted: 21 November 2006 – Published: 28 November 2006 Correspondence to: J. Kazil ([email protected])
ACPD
6, 12179–12197, 2006 Aerosol formation in cirrus J. Kazil et al. Title Page Abstract Introduction Conclusions References Tables Figures ◭ ◮ ◭ ◮ Back CloseFull Screen / Esc
Printer-friendly Version
Interactive Discussion
EGU
Abstract
The recent observation of ultrafine aerosol particles in cirrus clouds has raised the question whether aerosol formation within cirrus clouds is possible, and if so, what mechanisms are involved. We have developed an aerosol parcel model of neutral and charged H2SO4/H2O aerosol processes, including nucleation from the gas phase
5
and loss onto cirrus ice particles. Laboratory thermodynamic data for sulfuric acid uptake and loss by small neutral and charged clusters are used, allowing for a reliable description of both neutral and charged nucleation down to the very low temperatures occurring in the upper troposphere and lower stratosphere. The model implements a first order scheme for resolving the aerosol size distribution within its geometric size
10
sections, which efficiently suppresses numerical diffusion. We operate the model offline on trajectories generated with a detailed 1-D cirrus model which describes ice crystal nucleation, deposition growth, vertical advection of ice crystals and water vapor, and ice crystal sedimentation. In this paper we explore the possibility of aerosol formation within non-convective cirrus clouds and draw conclusions for aerosol formation in anvil
15
cirrus. We find that sulfate aerosol formation within cirrus clouds can proceed even at high ice surface area concentrations, and depends strongly on the size of the cirrus ice crystals and on the surface area concentration of preexisting aerosol particles.
1 Introduction
Aerosol formation from the gas phase requires sufficient condensable gas
concentra-20
tions to permit the formation of supercritical molecular clusters which grow faster than they decay. This nucleation process is more likely to occur when preexisting aerosol surface area concentrations are low, as preexisting aerosol is a sink for condensable gases and suppresses nucleation. Preexisting aerosol also removes freshly nucleated particles by coagulation. The observation of high ultrafine aerosol concentrations in
25
ACPD
6, 12179–12197, 2006 Aerosol formation in cirrus J. Kazil et al. Title Page Abstract Introduction Conclusions References Tables Figures ◭ ◮ ◭ ◮ Back CloseFull Screen / Esc
Printer-friendly Version
Interactive Discussion
EGU the cloud thus challenge conventional wisdom, as cirrus clouds typically exhibit large
surface area concentrations. It has therefore been suggested that the observed ultra-fine particles were artifacts of ice crystals shattering in the measurement device (Lee et al.,2004). On the other hand, the upper troposphere exhibits favorable conditions for aerosol formation, including low temperatures, and within cirrus clouds, high relative
5
humidities. Elevated water vapor concentrations within cirrus clouds could result in an enhanced production of the hydroxyl radical and consequently of gas phase sulfuric acid. Other processes potentially promoting aerosol formation in cirrus clouds include yet unidentified heterogeneous processes on ice surfaces producing aerosol precur-sors, and the homogeneous nucleation of hydrophobic organic molecules (Kulmala
10
et al.,2006).
Whether aerosol formation within cirrus clouds is possible, and if so, what mecha-nisms are involved is not a purely academic question: Visible cirrus cover ∼20–40% of the globe (Liou,1986;Wang et al., 1996; Wylie and Menzel,1999). At the same time the upper troposphere, where cirrus clouds are commonly found, is a potentially
15
important source of new particles supplying the troposphere and stratosphere with con-densation nuclei (Brock et al.,1995;Clarke et al.,1998;Eichkorn et al.,2002;Lee et al., 2003;Kazil et al.,2006). A role of cirrus in upper tropospheric aerosol formation could therefore have significant implications for tropospheric and stratospheric processes.
2 Model
20
We have developed an aerosol parcel model describing neutral and charged H2SO4/H2O aerosol, its formation from the gas phase, and its loss onto cirrus ice crystals. The present version of the model utilizes a new treatment of the neutral H2SO4/H2O cluster thermodynamic data. The hydrated H2SO4dimer (H2SO4)2(H2O)x and trimer (H2SO4)3(H2O)y formation thermodynamic data, averaged over the cluster
25
measure-ACPD
6, 12179–12197, 2006 Aerosol formation in cirrus J. Kazil et al. Title Page Abstract Introduction Conclusions References Tables Figures ◭ ◮ ◭ ◮ Back CloseFull Screen / Esc
Printer-friendly Version
Interactive Discussion
EGU ments byHanson and Lovejoy(2006). These fits read, with RH over water in %,
d S(kcal mol−1K−1) = −0.04
d H(kcal mol−1) = −18.32 − 4.55 · 10−3·RH (1) for the dimer formation and
d S(kcal mol−1K−1) = −0.045
5
d H(kcal mol−1
) = −21.41 − 2.63 · 10−2·RH (2)
for the trimer formation. For the uptake and loss of sulfuric acid and water by small charged clusters the model employs laboratory thermodynamic data measured by Froyd and Lovejoy(2003b). The thermodynamic data for large aerosol particles derive from H2SO4and H2O vapor pressures over bulk solutions calculated with the Aerosol
10
Inorganics Model (Carslaw et al.,1995), and from the liquid drop model. The thermo-dynamic data for intermediate size particles are a smooth interpolation of the data from these sources. An exponential form of the correction to the liquid drop model Gibbs free energy for neutral cluster as introduced by Lovejoy et al. (2004) is used. In the present case, the exponential parameters have been adjusted slightly to better match
15
the measured dimer and trimer data, and the correction reads 3e−(m+n)/5 kcal/mol for the addition of a sulfuric acid molecule to a (H2SO4)m−1(H2O)n and for the addition of a water molecule to a (H2SO4)m(H2O)n−1 cluster. The present neutral thermodynamic
data predict more stable small neutral clusters and more efficient neutral nucleation than the previous treatment (Lovejoy et al.,2004).
20
The rate coefficients for sulfuric acid uptake and loss by the aerosol particles, for the coagulation of the aerosol particles among themselves and with cirrus ice crystals, and for the recombination of the negatively charged aerosol with cations are averaged over the equilibrium H2O content probability distribution of the aerosol. This simplification holds well in the troposphere, where water is more abundant by orders of magnitude
25
than sulfuric acid, so that the clusters always have enough time to equilibrate with re-spect to water uptake/loss before colliding with a H2SO4 molecule. Details of the rate
ACPD
6, 12179–12197, 2006 Aerosol formation in cirrus J. Kazil et al. Title Page Abstract Introduction Conclusions References Tables Figures ◭ ◮ ◭ ◮ Back CloseFull Screen / Esc
Printer-friendly Version
Interactive Discussion
EGU coefficient calculations are given byLovejoy et al.(2004). A mass accommodation
co-efficient of 1 is assumed for the loss of gas phase sulfuric acid and aerosol particles onto cirrus ice crystals based on the work of Hanson (2005), and the corresponding rate coefficients are calculated with the expression ofFuchs(1964), which gives Brow-nian diffusion rate coefficients for loss onto particles much larger than the air mean free
5
path. In the rate coefficient calculation the cirrus particles are represented by spheres with the surface area and mass of hexagonal column ice crystals with an aspect ratio of 3.
The model implements a hybrid kinetic-sectional scheme: in the kinetic part, the model resolves the concentrations of the (H2SO4)i(H2O)j (i ) and
10
HSO−4(H2SO4)i−1(H2O)j−(i ) clusters individually withi ≤21. j (i ) and j
−
(i ) are the most
probable H2O contents of the clusters based on the the cluster water content proba-bility distribution in equilibrium. Fori>21 up to particle diameters of ∼1 µm the model
uses geometric bins. The size distribution within these bins is resolved with linear func-tions, which suppresses numerical diffusion better than a doubling of the bin number
15
at a negligible computational expense. Along a trajectory, the rate coefficients and most probable cluster H2O contents are recalculated whenever temperature or relative humidity change by more than 0.5 K or 2 percentage points, respectively, whichever occurs first. A reduction of these values has no effect on the conclusions of this work. The initial anion in the model is assumed to be NO−3(HNO3), the cation population is
20
represented by H3O+(H2O)4.
3 Input data
We operate the model offline on trajectories in the upper troposphere near 12.5 km, generated with a detailed 1-D cirrus model (Jensen and Pfister,2004) which describes ice crystal nucleation, deposition growth, vertical advection of ice crystals and water
25
vapor, and ice crystal sedimentation. In this work we focus on cirrus clouds that form in either a slow (−10−4K s−1) or a fast (−10−3K s−1) updraft, resulting in larger but less
ACPD
6, 12179–12197, 2006 Aerosol formation in cirrus J. Kazil et al. Title Page Abstract Introduction Conclusions References Tables Figures ◭ ◮ ◭ ◮ Back CloseFull Screen / Esc
Printer-friendly Version
Interactive Discussion
EGU numerous or smaller but more numerous ice particles, respectively: The largest ice
crystal concentration on the slow updraft trajectory is 0.012 cm−3, with a size distribu-tion peak near 60µm particle size, and 0.373 cm−3 on the fast trajectory, with a size distribution peak near 30µm particle size. The average ice surface area concentration
is considerably higher in the fast updraft cirrus with 407µm2cm−3, versus 28µm2cm−3
5
in the slow updraft cirrus. These surface area concentrations are calculated assuming that the cirrus ice crystals are hexagonal columns with an aspect ratio of 3, and the particle sizes are diameters of volume-equivalent spheres.
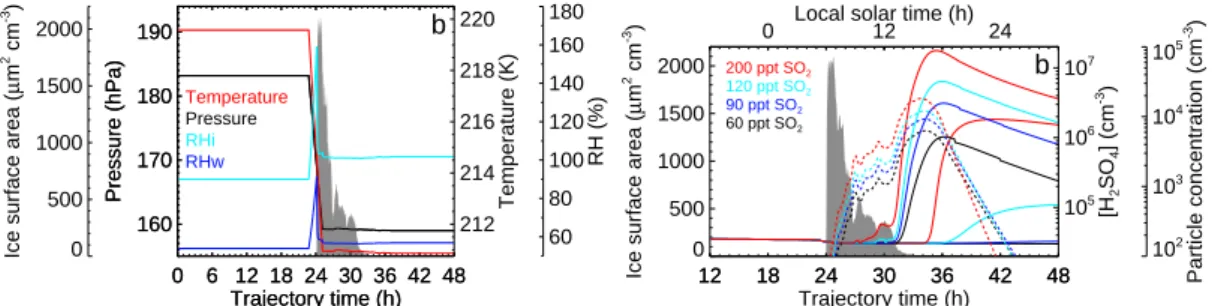
Figure 1 shows the evolution of pressure, temperature, RH, and ice surface area concentration along the two trajectories. The irregular structure of the slow updraft
cir-10
rus ice surface area time series (Fig.1a) is due to sedimentation of the cirrus particles from and across the considered air parcel. A similar but less prominent variability is seen in the fast updraft cirrus ice surface area time series (Fig.1b).
The cirrus considered in this work form in the absence of convective activity, and the chemical composition and aerosol properties along the trajectories need to be
15
specified accordingly. However, upper tropospheric chemical composition and aerosol properties exhibit a fair amount of variability due to transport of anthropogenic and vol-canic emissions (Thornton et al., 1996), and due to convection, which lifts boundary layer air and initiates aerosol formation aloft, most notably in the tropics (Clarke et al., 1998;Kazil et al.,2006). The specification of a typical upper tropospheric background
20
chemical and aerosol state is therefore not straightforward. Based on their systematic measurements of upper tropospheric aerosol concentrations,Minikin et al.(2003) give an average concentration of Aitken particles (with diameters>14 nm) of 770 cm−3 (at 273 K and 1000 hPa) at northern hemisphere mid-latitudes. This corresponds to 175 particles per cm3in the ambient conditions at the start of our trajectories. We neglect
25
the concentrations of ultrafine aerosol measured byMinikin et al.(2003), who attribute these particles to locally or regionally confined pollution events. Hagen et al. (1995) measured concentrations of aerosol with diameters >17 nm in the mid-latitude upper
ACPD
6, 12179–12197, 2006 Aerosol formation in cirrus J. Kazil et al. Title Page Abstract Introduction Conclusions References Tables Figures ◭ ◮ ◭ ◮ Back CloseFull Screen / Esc
Printer-friendly Version
Interactive Discussion
EGU clouds: One that can be well described with a single log-normal distribution function,
and the other being characterized by elevated concentrations of small particles, pos-sibly originating from a recent nucleation event. We therefore initialize our model with a preexisting log-normal aerosol size distribution with a geometric mean diameter of 62.5 nm and a geometric standard deviation of 1.45, in accord with the high altitude
5
measurements of Hagen et al. (1995). The total particle concentration of this initial size distribution is 175 cm−3, its surface area concentration 2.84µm2cm−3.
For the calculation of the H2SO4production rate, OH and SO2 concentrations need to be specified. We assume SO2 volume mixing ratios between 10 and 200 ppt, with a median near 40 ppt based on observations in the Pacific upper troposphere north
10
of 20◦ (Thornton et al.,1999). Upper tropospheric OH mixing ratios at northern mid-latitudes range up to 0.4 ppt (Jaegl ´e et al., 2000). We set the noon OH mixing ratio to 0.3 ppt, corresponding to a concentration of 1.7×106cm−3, and parameterize the OH diurnal cycle as a half sine centered around noon, with a day length of 12 h, while setting nighttime OH concentrations to zero. The production rate of sulfuric acid is then
15
calculated under the assumption that the reaction SO2+ OH is the rate-limiting step of the oxidation chain SO2→H2SO4(Lovejoy et al.,1996). We use solar maximum galac-tic cosmic ray ionization rates calculated with the code of O’Brien (2005) for 210◦E, 35◦N and for the ambient conditions along the trajectories.
4 Results
20
4.1 Daytime cirrus
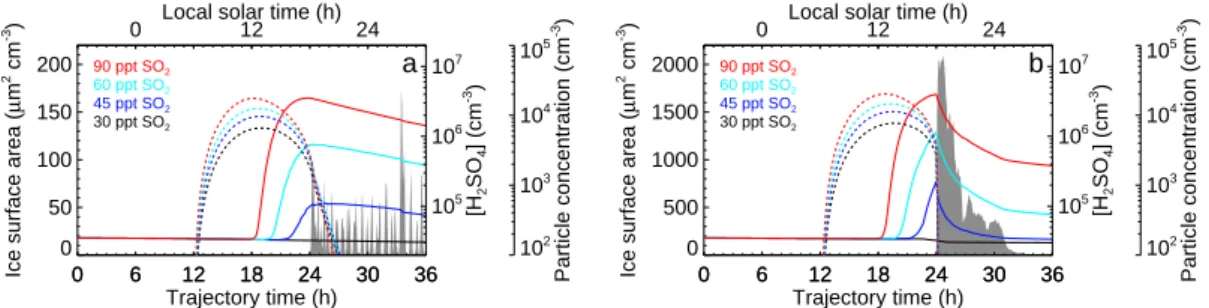
Figure 2 shows gas phase H2SO4 and aerosol concentrations calculated with our aerosol parcel model on the slow (Fig.1a) and on the fast (Fig.1b) updraft trajectory for different SO2 volume mixing ratios. The cirrus formation has been synchronized with sunrise in order to examine the effect of cirrus particles on in-cloud aerosol formation.
25
ACPD
6, 12179–12197, 2006 Aerosol formation in cirrus J. Kazil et al. Title Page Abstract Introduction Conclusions References Tables Figures ◭ ◮ ◭ ◮ Back CloseFull Screen / Esc
Printer-friendly Version
Interactive Discussion
EGU levels permitting aerosol nucleation at SO2mixing ratios as low as 15 ppt, yielding
sev-eral hundred supercritical particles per cm3. At 45 ppt SO2, many thousand supercrit-ical particles form per cm3 in the cloud, but only negligible concentrations of particles larger than 3 nm in diameter. These larger particles appear at 60 ppt SO2, and attain appreciable concentrations of several thousand per cm3within the cloud at 90 ppt SO2.
5
In the fast updraft cirrus the large surface area concentrations remove sulfuric acid quickly from the gas phase (Fig.2b). This rapid removal manifests most prominently as dents in the H2SO4concentration that are collocated with peaks in the surface area time series. Nucleation is strongly inhibited and supercritical aerosol concentrations remain low even at high SO2 mixing ratios until sedimentation of the ice crystals has
10
depleted the cloud. The dissipation of the cloud prompts an increase in H2SO4 con-centration and aerosol nucleation, followed by the formation of larger (>3 nm diameter)
particles.
4.2 Nighttime cirrus
Figure3shows gas phase H2SO4and aerosol concentrations on the slow (Fig.1a) and
15
fast (Fig.1b) updraft trajectories which have been shifted with respect to the diurnal cycle so that the cirrus clouds form at sunset, illustrating the effect of ice surface area on aerosol that formed prior to the cloud.
Aerosol particles exceeding 3 nm in diameter that formed in the course of the day endure the slow updraft cirrus cloud nearly unscathed (Fig. 3a), their slow decline is
20
mainly due to coagulation among themselves. Particle concentrations are reduced more distinctly in the fast updraft cirrus (Fig.3b), but a fair portion of the 3 nm particles survives the cloud phase. The fast updraft cirrus almost instantly removes all sulfuric acid from the gas phase, while the removal is more gradual in the slow updraft case.
A closer inspection of Fig. 3 reveals that the concentration of particles larger than
25
3 nm is slightly higher at the time of the cirrus formation on the fast updraft trajectory (Fig. 3b) compared with the slow updraft trajectory (Fig. 3a): While the SO2 mixing
ACPD
6, 12179–12197, 2006 Aerosol formation in cirrus J. Kazil et al. Title Page Abstract Introduction Conclusions References Tables Figures ◭ ◮ ◭ ◮ Back CloseFull Screen / Esc
Printer-friendly Version
Interactive Discussion
EGU ratios are held constant along the trajectories, the SO2concentrations decrease due to
the expansion of the air parcel in the updraft, which starts at 11:00 h (trajectory time) on the slow updraft trajectory (Fig.1a), but at 22:30 h (trajectory time) on the fast updraft trajectory. As a consequence the SO2 concentration is lower during daytime on the slow updraft trajectory, resulting in lower H2SO4production rates.
5
5 Discussion
The removal of condensable gases from the gas phase is diffusion limited for particles that are much larger than the mean free path length of air, which is typically <1 µm
in the troposphere. Hence cirrus ice crystals remove H2SO4 molecules from the gas phase less efficiently per unit surface area than smaller aerosol particles.
10
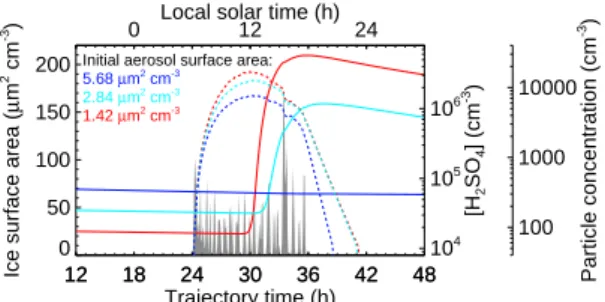
This is illustrated in Fig.4, which shows the effect of variations in preexisting aerosol surface area concentration on aerosol formation in the case of the slow updraft cir-rus. Three initial aerosol populations are compared, with surface area concentrations of 1.42, 2.84, and 5.68µm2cm−3, corresponding to H2SO4 condensational sinks of 7.5×10⁻⁵, 1.5×10⁻⁴, and 3×10⁻⁴s−1, respectively. A geometric mean diameter of
15
62.5 nm and a geometric standard deviation of 1.45, and a SO2 volume mixing ratio of 90 ppt is assumed in all three cases. A doubling of the preexisting aerosol surface area concentration to 5.68µm2cm−3 completely halts the formation of >3 nm
diam-eter particles, while a halving of the preexisting aerosol surface area concentration to 1.42µm2cm−3 markedly boosts the concentrations of these particles (Fig.4). The
20
strong dependence of particle formation on preexisting aerosol surface area concentra-tion is due to the comparably low average H2SO4condensational sink of 5.3×10
−5 s−1 of the cirrus ice particles. This diffusion limited removal of sulfuric acid from the gas phase by cirrus ice, together with the low temperatures in the upper troposphere ex-plains why aerosol formation can proceed in cirrus clouds.
25
Our study does not directly address anvil cirrus clouds with very large ice surface area concentrations, in which Lee et al. (2004) observed high numbers of ultrafine
ACPD
6, 12179–12197, 2006 Aerosol formation in cirrus J. Kazil et al. Title Page Abstract Introduction Conclusions References Tables Figures ◭ ◮ ◭ ◮ Back CloseFull Screen / Esc
Printer-friendly Version
Interactive Discussion
EGU particles: Anvil cirrus form in a highly dynamic environment associated with convection,
and cannot be easily compared with the cirrus in our simulations. Nonetheless, we can explore the conditions under which aerosol formation proceeds in the presence of very large ice surface area concentrations:
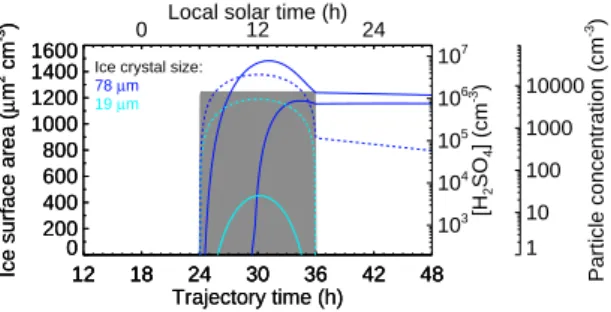
Figure5 shows results for two idealized cirrus clouds consisting of 19µm or 78 µm 5
ice crystals, with a surface area concentration of 1250µm2cm−3in both cases, and a zero preexisting aerosol surface area concentration. For 1 ppb SO2, the cloud with the smaller crystals completely suppresses the formation of>3 nm diameter aerosol, while
a massive nucleation event occurs in the cloud with the larger crystals, leading to the formation of>3 nm diameter particles at concentrations in the thousands per cm3. The
10
striking difference is due to the slower removal of sulfuric acid from the gas phase in the cloud with the larger ice crystals: The H2SO4condensational sink is 2.2×10
−4 s−1 in the case of the larger, and 8.7×10⁻⁴s−1in the case of the smaller ice crystals.
While not common, SO2 mixing ratios in the ppb range have been observed in the upper troposphere (Arnold et al.,1997). A process that could establish such high SO2
15
levels is the convective lifting of polluted boundary layer air which may contain SO2 at mixing ratios of many ppb (e.g.Hanke et al.,2003). This is a plausible scenario as anvil cirrus form due to strong convective updrafts, which are capable of lifting boundary layer air as high as into the stratosphere, even at mid-latitudes (Fischer et al.,2003). Boundary layer air may also contain aerosol precursor gases other than SO2. These
20
precursor gases need not necessarily nucleate, but could contribute to the condensa-tional growth of freshly nucleated sulfuric acid/water particles.
In the cases considered in our simulations, ionization rates amount to values around 30 cm−3s−1, but neutral nucleation dominates over charged nucleation by at least a factor of two. The charged nucleation rate may be underestimated in our model for
25
different reasons: The cation population is represented by a proton hydrate in our model. However, positive sulfuric acid/water clusters, while less potent to promote aerosol nucleation compared with their negative counterparts at temperatures of the lower troposphere (Froyd and Lovejoy,2003a), might grow to stable sizes in upper
tro-ACPD
6, 12179–12197, 2006 Aerosol formation in cirrus J. Kazil et al. Title Page Abstract Introduction Conclusions References Tables Figures ◭ ◮ ◭ ◮ Back CloseFull Screen / Esc
Printer-friendly Version
Interactive Discussion
EGU pospheric conditions and thus contribute to aerosol formation. Stable neutral aerosol
particles can also form from the recombination of subcritical positive and negative sul-furic acid/water clusters or other complex cations and anions.
6 Conclusions
The formation of sulfate aerosol from the gas phase in cirrus clouds is possible, and
5
facilitated by the relatively inefficient, diffusion limited removal of sulfuric acid from the gas phase by cirrus ice crystals, and by the low temperatures in the upper tro-posphere. Neutral nucleation dominates over charged nucleation in our simulations. In non-convective cirrus that form in slow updrafts and thus exhibit comparably low sur-face area concentrations, aerosol nucleation is possible at SO2mixing ratios as low as
10
15 ppt. Formation of larger (>3 nm diameter) aerosol particles within these clouds
re-quires SO2mixing ratios elevated within the range of values found in the northern mid-latitude upper troposphere. In cirrus with large area concentrations, such as formed by fast updrafts or due to convective activity, aerosol nucleation and growth are strongly inhibited, and require very high SO2levels to proceed. In the case of anvil cirrus, such
15
high SO2 concentrations could be established by transport of polluted boundary layer air into the upper troposphere, along with other aerosol precursor gases by the convec-tive updraft that is responsible for the formation of the cirrus cloud. Aerosol particles that nucleate and grow to larger sizes before the formation of a cirrus cloud can persist in considerable numbers within the cloud, even at high ice surface area concentrations.
20
The concentrations of aerosol precursor gases required for aerosol nucleation within cirrus depend not only on the cirrus ice surface area concentration, but strongly on the surface area concentration of preexisting aerosol, and on the size of the cirrus ice crystals. Comparably moderate variations in preexisting aerosol surface area or ice crystal sizes can make the difference between an absent and a vigorous aerosol
25
nucleation event.
ACPD
6, 12179–12197, 2006 Aerosol formation in cirrus J. Kazil et al. Title Page Abstract Introduction Conclusions References Tables Figures ◭ ◮ ◭ ◮ Back CloseFull Screen / Esc
Printer-friendly Version
Interactive Discussion
EGU cations and anions, aerosol precursor molecules other than H2SO4 and H2O, or for
processes such as heterogeneous chemistry on ice surfaces. While not a prerequisite, they could promote aerosol formation and growth within cirrus clouds with very high ice surface area concentrations, or when SO2and OH concentrations alone would not suffice.
5
Acknowledgements. We would like to thank D. M. Murphy (NOAA Earth System Research
Laboratory) for helpful discussions. This work is supported by the National Research Council and by the NOAA Climate and Global Change Program.
References
Arnold, F., Schneider, J., Gollinger, K., Schlager, H., Schulte, P., Hagen, D. E., Whitefield,
10
P. D., and Velthoven, P. v.: Observation of upper tropospheric sulfur dioxide- and acetone-pollution: Potential implications for hydroxyl radical and aerosol formation, Geophys. Res. Lett., 24, 57–60, doi:10.1029/96GL03693, 1997. 12188
Brock, C. A., Hamill, P., Wilson, J. C., Jonsson, H. H., and Chan, K. R.: Particle formation in the upper tropical troposphere: a source of nuclei for the stratospheric aerosol, Science, 270,
15
1650–1653, 1995. 12181
Carslaw, K. S., Clegg, S. L., and Brimblecombe, P.: A thermodynamic model of the system HCl-HNO3-H2SO4-H2O, including solubilities of HBr, from<200 K to 328 K, J. Phys. Chem.,
99, 11 557–11 574, 1995. 12182
Clarke, A. D., Varner, J. L., Eisele, F., Mauldin, R. L., Tanner, D., and Litchy, M.: Particle
20
production in the remote marine tropospere: Cloud outflow and subsidence during ACE 1, J. Geophys. Res., 103, 16 397–16 409, 1998.12181,12184
Eichkorn, S., Wilhelm, S., Aufmhoff, H., Wohlfrom, K. H., and Arnold, F.: Cosmic ray-induced aerosol-formation: First observational evidence from aircraft-based ion mass spectrometer measurements in the upper troposphere, Geophys. Res. Lett., 29(14), 1698, doi:10.1029/
25
2002GL015044, 2002.12181
Fischer, H., de Reus, M., Traub, M., Williams, J., Lelieveld, J., de Gouw, J., Warneke, C., Schlager, H., Minikin, A., Scheele, R., and Siegmund, P.: Deep convective injection of boundary layer air into the lowermost stratosphere at midlatitudes, Atmos. Chem. Phys., 3, 739–745, 2003. 12188
ACPD
6, 12179–12197, 2006 Aerosol formation in cirrus J. Kazil et al. Title Page Abstract Introduction Conclusions References Tables Figures ◭ ◮ ◭ ◮ Back CloseFull Screen / Esc
Printer-friendly Version
Interactive Discussion
EGU
Froyd, K. D. and Lovejoy, E. R.: Experimental Thermodynamics of Cluster Ions Composed of H2SO4and H2O. 1. Positive Ions, J. Phys. Chem. A, 107, 9800–9811, 2003a. 12188
Froyd, K. D. and Lovejoy, E. R.: Experimental Thermodynamics of Cluster Ions Composed of H2SO4and H2O. 2. Measurements and ab Initio Structures of Negative Ions, J. Phys. Chem. A, 107, 9812–9824, 2003b. 12182
5
Fuchs, N. A.: The Mechanics of Aerosols, Macmillan, 1964.12183
Hagen, D. E., Podzimek, J., and Trueblood, M. B.: Upper-tropospheric aerosol sampled during project FIRE IFO II, J. Atmos. Sci., 52, 4196–4209, 1995. 12184,12185
Hanke, M., Umann, B., Uecker, J., Arnold, F., and Bunz, H.: Atmospheric measurements of gas-phase HNO3 and SO2using chemical ionization mass spectrometry during the MINATROC
10
field campaign 2000 on Monte Cimone, Atmos. Chem. Phys., 3, 417–436, 2003. 12188
Hanson, D. R.: Mass accommodation of H2SO4and CH3SO3H on water-sulfuric acid solutions from 6% to 97% RH, J. Phys. Chem. A, 109, 6919–6927, doi:10.1021/jp0510443, 2005.
12183
Hanson, D. R. and Lovejoy, E. R.: Measurement of the thermodynamics of the hydrated dimer
15
and trimer of sulfuric acid, J. Phys. Chem. A, 110, 9525–9528, doi:10.1021/jp062844w, 2006.
12182
Jaegl ´e, L., Jacob, D. J., Brune, W. H., Faloona, I., Tan, D., Heikes, B. G., Kondo, Y., Sachse, G. W., Anderson, B., Gregory, G. L., Singh, H. B., Pueschel, R., Ferry, G., Blake, D. R., and Shetter, R. E.: Photochemistry of HOxin the upper troposphere at northern midlatitudes, J.
20
Geophys. Res., 105, 3877–3892, doi:10.1029/1999JD901016, 2000. 12185
Jensen, E. and Pfister, L.: Transport and freeze-drying in the tropical tropopause layer, J. Geophys. Res., 109, D02207, doi:10.1029/2003JD004022, 2004.12183,12193
Kazil, J., Lovejoy, E. R., Barth, M. C., and O’Brien, K.: Aerosol nucleation over oceans and the role of galactic cosmic rays, Atmos. Chem. Phys., 6, 4905–4924, 2006.12181,12184
25
Kulmala, M., Reissell, A., Sipil ¨a, M., Bonn, B., Ruuskanen, T. M., Lehtinen, K. E. J., Kerminen, V.-M., and Str ¨om, J.: Deep convective clouds as aerosol production engines: Role of insol-uble organics, J. Geophys. Res. (Atmos.), 111, 17202, doi:10.1029/2005JD006963, 2006.
12181
Lee, S.-H., Reeves, J. M., Wilson, J. C., Hunton, D. E., Viggiano, A. A., Miller, T. M., Ballenthin,
30
J. O., and Lait, L. R.: Particle Formation by Ion Nucleation in the Upper Troposphere and Lower Stratosphere, Science, 301, 1886–1889, 2003. 12181
ACPD
6, 12179–12197, 2006 Aerosol formation in cirrus J. Kazil et al. Title Page Abstract Introduction Conclusions References Tables Figures ◭ ◮ ◭ ◮ Back CloseFull Screen / Esc
Printer-friendly Version
Interactive Discussion
EGU
Kok, G., Anderson, B., Lawson, P., Baker, B., Strawa, A., Pittman, J. V., Reeves, J. M., and Bui, T. P.: New particle formation observed in the tropical/subtropical cirrus clouds, J. Geophys. Res., 109, 20209, doi:10.1029/2004JD005033, 2004. 12180,12181,12187
Liou, K.-N.: Influence of Cirrus Clouds on Weather and Climate Processes: A Global Perspec-tive, Mon. Weather Rev., 114, 1167–1199, doi:10.1175/1520-0493, 1986.12181
5
Lovejoy, E. R., Hanson, D. R., and Huey, L. G.: Kinetics and products of the gas-phase reaction of SO3with water, J. Phys. Chem., 100, 19 911–19 916, doi:10.1021/jp962414d, 1996.12185
Lovejoy, E. R., Curtius, J., and Froyd, K. D.: Atmospheric ion-induced nucleation of sulfuric acid and water, J. Geophys. Res., 109, D08204, doi:10.1029/2003JD004460, 2004. 12182,
12183
10
Minikin, A., Petzold, A., Str ¨om, J., Krejci, R., Seifert, M., van Velthoven, P., Schlager, H., and Schumann, U.: Aircraft observations of the upper tropospheric fine particle aerosol in the Northern and Southern Hemispheres at midlatitudes, Geophys. Res. Lett., 30, 1503, doi:10.1029/2002GL016458, 2003. 12184
O’Brien, K.: The theory of cosmic-ray and high-energy solar-particle transport in the
atmo-15
sphere, in: The natural radiation environment VII, edited by: McLaughlin, J. P., Simopoulos, E. S., and Steinh ¨ausler, F., Elsevier, seventh International Symposium on the Natural Radia-tion Environment, Rhodes, Greece, 20–24 May, 2002, 2005. 12185
Thornton, D. C., Bandy, A. R., Blomquist, B. W., Davis, D. D., and Talbot, R. W.: Sulfur diox-ide as a source of condensation nuclei in the upper troposphere of the Pacific Ocean, J.
20
Geophys. Res., 101, 1883–1890, 1996. 12184
Thornton, D. C., Bandy, A. R., Blomquist, B. W., Driedger, A. R., and Wade, T. P.: Sulfur dioxide distribution over the Pacific Ocean 1991-1996, J. Geophys. Res., 104, 5845–5854,
1999. 12185
Wang, P.-H., Minnis, P., McCormick, M. P., Kent, G. S., and Skeens, K. M.: A 6-year climatology
25
of cloud occurrence frequency from Stratospheric Aerosol and Gas Experiment II observa-tions (1985–1990), J. Geophys. Res., 101, 29 407–29 430, doi:10.1029/96JD01780, 1996.
12181
Wylie, D. P. and Menzel, W. P.: Eight Years of High Cloud Statistics Using HIRS., J. Climate, 12, 170–184, 1999.12181
ACPD
6, 12179–12197, 2006 Aerosol formation in cirrus J. Kazil et al. Title Page Abstract Introduction Conclusions References Tables Figures ◭ ◮ ◭ ◮ Back CloseFull Screen / Esc
Printer-friendly Version Interactive Discussion EGU 0 6 12 18 24 30 36 42 48 Trajectory time (h) 160 170 180 190 Pressure (hPa) 0 6 12 18 24 30 36 42 48 Trajectory time (h) 160 170 180 190 Pressure (hPa) 0 50 100 150 200
Ice surface area (
µ m 2 cm -3) 212 214 216 218 220 Temperature (K) 60 80 100 120 140 160 180 RH (%) a 0 6 12 18 24 30 36 42 48 Trajectory time (h) 160 170 180 190 Pressure (hPa) 0 6 12 18 24 30 36 42 48 Trajectory time (h) 160 170 180 190 Pressure (hPa) 0 500 1000 1500 2000
Ice surface area (
µ m 2 cm -3) 212 214 216 218 220 Temperature (K) 60 80 100 120 140 160 180 RH (%) RHw RHi Pressure Temperature b
Fig. 1. Ambient conditions and cirrus ice surface area concentrations (gray areas) along the slow (a) and fast (b) updraft trajectories, generated with a 1-D cirrus model (Jensen and Pfister,
ACPD
6, 12179–12197, 2006 Aerosol formation in cirrus J. Kazil et al. Title Page Abstract Introduction Conclusions References Tables Figures ◭ ◮ ◭ ◮ Back CloseFull Screen / Esc
Printer-friendly Version Interactive Discussion EGU 0 6 12 18 24 30 36 42 48 Trajectory time (h) 160 170 180 190 Pressure (hPa) 0 6 12 18 24 30 36 42 48 Trajectory time (h) 160 170 180 190 Pressure (hPa) 0 500 1000 1500 2000
Ice surface area (
µ m 2 cm -3) 212 214 216 218 220 Temperature (K) 60 80 100 120 140 160 180 RH (%) RHw RHi Pressure Temperature b 12 18 24 30 36 42 48 Trajectory time (h) 0 500 1000 1500 2000
Ice surface area (
µ m 2 cm -3) 12 18 24 30 36 42 48 105 106 107 [H 2 SO 4 ] (cm -3) 102 103 104 105 Particle concentration (cm -3)
0 Local solar time (h)12 24
60 ppt SO2
90 ppt SO2 120 ppt SO2
200 ppt SO2 b
Fig. 2. Daytime slow (a) and fast (b) updraft cirrus; the cirrus ice surface area concentration is denoted by gray areas. Broken lines represent the H2SO4concentration, thin solid lines the concentration of supercritical aerosol particles, thick solid lines the concentration of aerosol particles with diameters>3 nm.
ACPD
6, 12179–12197, 2006 Aerosol formation in cirrus J. Kazil et al. Title Page Abstract Introduction Conclusions References Tables Figures ◭ ◮ ◭ ◮ Back CloseFull Screen / Esc
Printer-friendly Version Interactive Discussion EGU 0 6 12 18 24 30 36 Trajectory time (h) 0 50 100 150 200
Ice surface area (
µ m 2 cm -3) 0 6 12 18 24 30 36 105 106 107 [H 2 SO 4 ] (cm -3) 102 103 104 105 Particle concentration (cm -3)
0 Local solar time (h)12 24
30 ppt SO2 45 ppt SO2 60 ppt SO2 90 ppt SO2 a 0 6 12 18 24 30 36 Trajectory time (h) 0 500 1000 1500 2000
Ice surface area (
µ m 2 cm -3) 0 6 12 18 24 30 36 105 106 107 [H 2 SO 4 ] (cm -3) 102 103 104 105 Particle concentration (cm -3)
0 Local solar time (h)12 24
30 ppt SO2
45 ppt SO2 60 ppt SO2
90 ppt SO2 b
Fig. 3. Nighttime slow (a) and fast (b) updraft cirrus; the cirrus ice surface area concentration is denoted by gray areas. Broken lines represent the H2SO4concentration, thick solid lines the concentration of particles with diameters>3 nm.
ACPD
6, 12179–12197, 2006 Aerosol formation in cirrus J. Kazil et al. Title Page Abstract Introduction Conclusions References Tables Figures ◭ ◮ ◭ ◮ Back CloseFull Screen / Esc
Printer-friendly Version Interactive Discussion EGU 12 18 24 30 36 42 48 Trajectory time (h) 0 50 100 150 200
Ice surface area (
µ m 2 cm -3) 12 18 24 30 36 42 48 104 105 106 [H 2 SO 4 ] (cm -3) 100 1000 10000 Particle concentration (cm -3)
0 Local solar time (h)12 24
1.42 µm2 cm-3
2.84 µm2 cm-3
5.68 µm2 cm-3
Initial aerosol surface area:
Fig. 4. Effect of preexisting aerosol surface area concentration on >3 nm aerosol particle for-mation in the slow updraft cirrus. Cirrus ice surface area concentration is denoted by gray areas. Broken lines represent the H2SO4concentration, thick solid lines the concentration of particles with diameters>3 nm.
ACPD
6, 12179–12197, 2006 Aerosol formation in cirrus J. Kazil et al. Title Page Abstract Introduction Conclusions References Tables Figures ◭ ◮ ◭ ◮ Back CloseFull Screen / Esc
Printer-friendly Version Interactive Discussion EGU 12 18 24 30 36 42 48 Trajectory time (h) 0 200 400 600 800 1000 1200 1400 1600
Ice surface area (
µ m 2 cm -3) 12 18 24 30 36 42 48 Trajectory time (h) 0 200 400 600 800 1000 1200 1400 1600
Ice surface area (
µ m 2 cm -3) 12 18 24 30 36 42 48 103 104 105 106 107 [H 2 SO 4 ] (cm -3) 1 10 100 1000 10000 Particle concentration (cm -3)
0 Local solar time (h)12 24
19 µm
78 µm
Ice crystal size:
Fig. 5. Aerosol formation in two idealized cirrus clouds with an ice surface area concentra-tion of 1250µm2cm−3(gray area), at constant conditions of 170 hPa, 210 K, and 150% relative humidity over ice. The first cloud consists of 19µm, the second of 78 µm ice crystals. The
day length is 12 h, the noon OH volume mixing ratio 0.3 ppt, and the SO2volume mixing ratio 1 ppb in both cases. Preexisting aerosol surface area concentration has been set to zero. Bro-ken lines represent the H2SO4concentration, thin solid lines the concentration of supercritical aerosol particles, thick solid lines the concentration of aerosol particles with diameters>3 nm.
Nucleation is negligible in the presence of the smaller, but vigorous in the presence of the larger ice crystals. In the latter case,>3 nm diameter aerosol particles are produced in vast numbers.