HAL Id: hal-02486495
https://hal.archives-ouvertes.fr/hal-02486495
Submitted on 15 Mar 2020HAL is a multi-disciplinary open access archive for the deposit and dissemination of sci-entific research documents, whether they are pub-lished or not. The documents may come from teaching and research institutions in France or abroad, or from public or private research centers.
L’archive ouverte pluridisciplinaire HAL, est destinée au dépôt et à la diffusion de documents scientifiques de niveau recherche, publiés ou non, émanant des établissements d’enseignement et de recherche français ou étrangers, des laboratoires publics ou privés.
Carbon heterogeneities in austenite during Quenching &
Partitioning (Q&P) process revealed by in situ High
Energy X-Ray Diffraction (HEXRD) experiments
Sébastien Y.P. Allain, Steve Gaudez, Guillaume Geandier, Frédéric Danoix,
Michel Soler, Mohamed Gouné
To cite this version:
Sébastien Y.P. Allain, Steve Gaudez, Guillaume Geandier, Frédéric Danoix, Michel Soler, et al.. Carbon heterogeneities in austenite during Quenching & Partitioning (Q&P) process revealed by in situ High Energy X-Ray Diffraction (HEXRD) experiments. Scripta Materialia, Elsevier, 2020, 181, pp.108-114. �10.1016/j.scriptamat.2020.02.022�. �hal-02486495�
Carbon heterogeneities in austenite during Quenching & Partitioning (Q&P)
process revealed by in situ High Energy X-Ray Diffraction (HEXRD)
experiments
Sébastien ALLAIN1, Steve GAUDEZ1, Guillaume GEANDIER1, Frédéric DANOIX2,
Michel SOLER3, Mohamed GOUNE4
1 Institut Jean Lamour, UMR CNRS-Université de Lorraine 7198, 54000 Nancy, France
2 Normandie Université , UNIROUEN, INSA Rouen, CNRS, Groupe de Physique des Matériaux, 76000 Rouen, France
3 Maizières Automotive Products, Arcelormittal Maizières Research SA, 57283 Maizières les Metz, France 4 Institut de Chimie de la Matière Condensée de Bordeaux, UPR CNRS 9048, 33608 Pessac, France
Corresponding author: sebastien.allain@univ-lorraine.fr; Tel.: +33-670-608-831
Graphical abstract
Keywords
steel; martensite; austenite; partitioning; X-Ray diffraction
Abstract
Based on the evolution of the positions and intensities of the diffraction peaks, high energy X-ray diffraction (HEXRD) is recognized as the ultimate method to follow quantitatively in situ phase transformations in steels. However, the possible asymmetricity of diffraction peaks is seldom considered, and is known to bear information. A procedure for quantifying their skewness is proposed. In the case of a third generation high strength steel obtained by quench and partitioning
(Q&P), the skewness is shown to be due to carbon heterogeneities at austenite/martensite interfaces developed at nanoscale, in agreement with prior post mortem atom probe tomography (APT) investigations.
Main text
High Energy X-Ray diffraction (HEXRD) experiments conducted on synchrotron beamlines offer opportunities to go deeper in the understanding of Q&P steels. Such in situ experiments allow not only following the complex phase transformation processes and their interactions taking place during manufacturing [1–9] but also investigating the phase behaviors during mechanical tests on final products [10,11].
HEXRD was used to track transformation kinetics of the martensitic and bainitic transformations [3,5–7] and also, even if more difficult, the carbide precipitation [8] occurring during the Q&P process. By giving access to the lattice parameter of phases, it permits at the same time to determine both the mean carbon enrichment and the intense second-order internal stresses in austenite during the partitioning step [7]. Since in situ HEXRD experiments allow deconvoluting unambiguously these chemical and mechanical contributions, it is thus the sole reliable method to follow carbon enrichment in austenite during a Q&P process. All these metallurgical parameters have been obtained by determining the mean position of diffraction peaks and their relative integral breaths as a function of time and temperature. However, to our best knowledge, the time resolved evolutions of the width and the shape of the diffraction peaks of austenite along a Q&P thermal treatment have not been studied in details so far, despite they comprise an important source of information about phase states. By analyzing such peaks during in situ experiments, Guo et al. [12] and Rementeria et al. [13] have revealed that the austenite films and blocks produced during bainitic transformations show different carbon enrichments.
The present study is dedicated to the thorough analysis of the diffraction peaks of austenite of a Q&P steel during an in situ HEXRD experiment on a synchrotron beamline (Petra III P07, DESY, Hambourg). The experiment consists in applying a selected Q&P thermal schedule on a sample placed in a dilatometer. The sample is illuminated by a monochromatic X-Ray beam (400 µm x 400 µm, 100 keV). Resulting diffracted Debye-Scherrer rings are recorded in transmission thanks to a 2D plate detector placed about 1m behind the sample (Perkin-Elmer XRD 1621 Flat Panel detector). The fast acquisition rate (up to 10Hz) enabled by the set-up and the brilliance of the
synchrotron source permits to study microstructural evolutions during the fast Q&P treatments. 2D diffraction patterns are then integrated circularly to produce 1D diffractograms using a non-commercial software (Fit2D) (http://www.esrf.eu/computing/scientific/FIT2D/). A Rietveld refinement procedure using Fullprof software (https://www.ill.eu/sites/fullprof/) [14] has then been applied to determine the evolution of the phase fraction and their lattice parameters all along the treatment.
In the present paper, a single Q&P treatment is analyzed for a model alloy Fe-0.3C-2.5Mn-1.5Si (wt.%). This schedule comprises first a full austenitic annealing at 900°C, a quench down to the Quench Temperature (QT) at 200°C (maintained during 5s) and a partitioning step at the Partitioning Temperature (PT) at 400°C during 200 s. The cooling and heating rates used are 50 and 30°C/s respectively. This treatment has been chosen to minimize the fraction of carbide free bainite appearing during the partitioning step down to 3%. A 10Hz acquisition rate has been used for the first 100s of treatment and a 0.3Hz rate for the rest of the cycle. All the details about the proposed experiments and the post-treatment procedures have already been given in [5,7]. However, in these preceding papers, the shape and asymmetries of the diffraction peaks have never been discussed. In this paper, the origin of the asymmetries of austenite diffraction peaks will be analyzed at the light of the carbon heterogeneities in austenite as observed by Atom Probe Tomography [9].
The Rietveld refinement procedure consists in approaching an experimental integrated diffractogram by theoretical functions reproducing each diffraction peaks. This method provides a direct determination of the phase fractions. It includes the mean description of the width of the peaks. Fullprof software uses the theory of Caglioti et al. [14–17] which links the FWHM (Full Width at Half Maximum) β of a peak at a given diffraction Bragg’s angle θ to three parameters (U, V and W). These parameters are calibrated during the refinement to obtain the best adjustment of all the peaks of a phase at the same time. β is calculated as follows:
β (θ )=
√
Utan ² (θ)+Vtan (θ)+W (1)Caglioti's formula is often used to model the instrumental functions, but it is here used to describe the FWHM in an average sense [15]. In parallel to the determination of phase fractions, the refinement procedure thus grants access to the FWHM of each peak all along the thermal treatment. In the following, the FWHM corresponds to the raw measurements without any instrumental correction, as it can be considered as constant (no change in the instrument
configuration and in the source parameters). As explained in [16], the same formalism can be used for both instrumental and structural contributions to broadening.
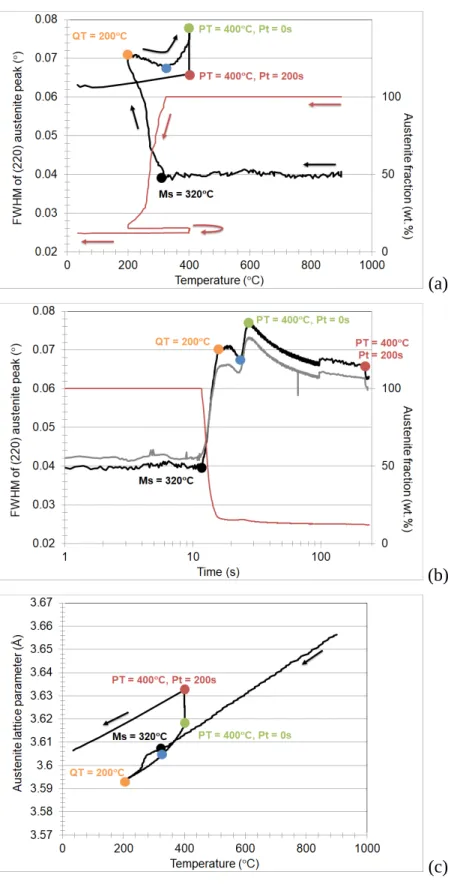
Figure 1 (a) and (b) show the evolution of the mean FWHM of the austenite (220) diffraction peak and the fraction of austenite as a function of the temperature and time respectively. For the sake of comparison, Figure 1 (c) shows the concomitant evolution of austenite lattice parameter as a function of time obtained by the Rietveld procedure [7]. The absolute precision of the phase fraction measurement is estimated around 1% and the relative precision of the lattice parameter measurement is 10-4. The (220) peak was chosen to conduct the analysis as it the first peak of
austenite sufficiently far from the martensite peaks to avoid any overlap in the diffractogram.
The measurements start from the end of the austenitic soaking at 900°C. The FWHM is calculated using U, V and W parameters according to equation 1 (black line). It accounts for the mean widening of all diffraction peaks and is thus more representative than a local measurement on a single peak. For the sake of comparison, the direct measurement of the width of the sole austenite (220) diffraction peak is represented in Figure 1(b) (grey curve).These latter values are obtained by fitting the desired peak with two half gaussian functions (method described hereafter). These two values of FWHM must only be compared qualitatively as they have been obtained using two different refinement methods (Pseudo-Voigt functions with a polynomial background and Gaussian functions with a local linear background). The mean values provided by the Rietveld method on the whole spectrum and the direct measurement on a single peak show however very similar evolution meaning that the observations on the (220) peaks are relevant for all the diffraction peaks of austenite.
At the soaking temperature (900°C), the alloy is supposed to be fully austenitic and fully relaxed. As a alloy has been homogenized before hot-rolling, the chemical composition was thought be homogeneous. The steel remains fully austenitic down to the Ms temperature (320°C). During this cooling sequence, the FWHM remains constant as no plastic event (no microstrain) is supposed to occur (cf. Figure 1(a)). It means in particular that the result is insensitive to the overall displacement due to temperature (intrinsic widening of peak shoulders due to the temperature). During this stage, the austenite lattice parameter decreases almost linearly due the pure thermal expansion (cf. Figure 1(c)).
Between Ms and QT, the martensitic transformation proceeds. The austenite lattice continue decreasing but a deviation from a linear behavior is observed (cf. Figure 1(c)). Indeed, as the transformation occurs with a large volume change and is displacive, large internal compressive stresses in austenite [7] are generated but also large plastic microstrains, which are revealed by a sharp increase in the FWHM of the austenitic peaks (cf. Figure 1(a)). This latter increase must originate from plasticity mechanisms as the chemical composition of austenite does not evolve during the martensitic transformation. At QT, all the remaining islands of austenite show an homogeneous composition in carbon, equal to the nominal composition of the alloy.
Once QT is reached, the fraction of austenite remains almost constant for the rest of the treatment, ca. 15% (limited bainitic transformation, no final martensitic transformation, as shown in Figure 1(a)). During reheating between QT and PT, the austenite lattice parameter first increases linearly according to the expected thermal expansion. At about 270°C, a deviation is observed and the increase continues during the isothermal step. These last evolutions were attributed to the carbon enrichment in austenite due to partitioning [7]. The evolution of the FWHM above QT is more unexpected. The FWHM first decreases slightly up to about 320°C and increases rapidly up to 400°C (cf. Figure 1(a) and (b)). The slight decrease can be easily explained by a recovery process [18,19] or by a relaxation of internal stresses, but the increase cannot be interpreted by a mechanism involving structural defects. Indeed, during this stage, the fraction of austenite remains constant and only two metallurgical mechanisms are active: the carbon diffusion from martensite to austenite (explaining the increase in the lattice austenite parameter) and the precipitation of transition carbides in martensite. These latter mechanisms were both shown to start in the studied steel at about 270°C during reheating [6–8]. However, none of them is known to lead evidently to an increase in the width of the austenite diffraction peaks. Once PT is reached, the width of peaks decreases progressively with time (cf. Figure 1 (b)). The small jump observed at 100s must be attributed to the change in acquisition rate which slightly alters the treatment of the signal background. During the final cooling, the austenite lattice parameter decreases in accordance with the thermal expansions and the FHWM remains almost constant, as during the primary cooling between 900°C and Ms. This is consistent with the absence of final martensitic transformation. To investigate the origin of this up-and-down evolution, the austenite (220) diffraction peaks (intensity vs. diffraction angle) corresponding to four critical times (colored dots in Figure 1) have been plotted in Figure 2(a).
Between the quench and the end of the partitioning step, the lattice parameter of austenite is shown to increase due to the carbon enrichment in austenite [6]. As a consequence, the studied diffraction peak is progressively shifted to the low diffraction angles. The total estimated mean enrichment is +0.7% (about +0.3% already at T = 320°C). During the partitioning step, a very low fraction of bainite also forms at the expense of austenite [7]. This transformation partly explains the decrease in the relative height of the austenite diffraction peak during the partitioning step. To be able to compare the peaks despite these metallurgical evolutions, they have been plotted as a function of a reduced diffraction angle (diffraction angle minus the angle at peak maximum) in Figure 2(b). By doing so, all the peaks are centered around the zero value. They all show a symmetrical gaussian shape, except for the peak measured at the beginning of the partitioning step (green curve). The left side of the peak is more extended than its right side, revealing a negative skew. This dissymmetric extension to the low angle values causes an apparent widening of the peak.
(a)
(b)
(c)
Figure 1: FWHM of the (220) diffraction peak of austenite (black and grey lines) and the fraction of austenite (red line) as a function of the temperature (a) and time (b) respectively. The black continuous curve corresponds to the mean value calculated with equation (1) and the grey curve to the direct measurement on the sole (220) peak. (c) Evolution of the austenite lattice parameter deduced from the Rietveld analysis. The colored dots correspond to the conditions studied in details in subsequent Figures 2. The arrows indicate the progression of the treatment in Figures a and c.
(a)
(b)
(c)
Figure 2: (a) Austenite (220) diffraction peaks (intensity vs. diffraction angle) corresponding to four critical times. The critical times are located by colored dots in Figure 1 (orange = state at QT, blue = state at 320°C corresponding to the local minimum of the FWHM, green = state at the beginning of the partitioning step, red = state at the end of the partitioning step) (b) Same peaks plotted as a function of a reduced diffraction angle to center all the peaks. (c) Skewness of the (220) austenitic diffraction peak as a function of the time. The austenite fraction has been redrawn for the sake of readability.
In order to verify if this result could explain the observed up-and-down evolution in the apparent FWHM, the degree of asymmetry of the peaks has been measured all along the studied thermal treatment by adjusting two half Gaussian functions to describe both sides of the studied peak independently. Gaussian functions have been used instead of Pseudo-Voigt, Lorentzian or Pearson VII functions since they provide the best balance between degrees of freedom and quality of the adjustment on the experimental data (cf. Figure 3 for more details). Their maximum values are the same and are centered on the same angles but they could show different widths. The method thus permits to measure their respective left and right widths at half maximum. The background signal has been approximated by an affine function. The skewness of the (220) austenitic peak has been evaluated as the relative difference between both right and left widths. Figure 2(c) shows its evolution with time. During the whole treatment, the studied peak shows always a slight negative skewness, but absolute values lower than 0.05 are not considered as significant. Indeed, when the acquisition rate switches after 100s, it induces a slight jump which remains of this order of magnitude. On the contrary, a significant evolution of the skewness is observed at T = 320°C meaning that the (220) austenitic diffraction peak becomes obviously asymmetric above this temperature. The skewness reaches a maximum at 400°C and then drops progressively. The value reached is -0.20 meaning that the left side FWHM of the peak is 20% larger than its right side. It thus permits to conclude that the evolution of the FHWM above QT is essentially due to the evolution of the asymmetry of the peaks.
To explain the origin of the peak asymmetry, the existence of temperature gradient inside the studied volume has been ruled out. In the dilatometer, a temperature gradient is present along the sample length, but the beam section is only 400µmx400µm and is focused at the very center of the sample. As a consequence, the absolute gradient in temperature in the analyzed volume is surely limited. The larger temperature gradient are expected during the cooling sequence, during which no skewness is observed.
As previously mentioned, the metallurgical mechanisms supposed to occur during the heating stage are the partitioning of carbon and the precipitation of carbides in martensite [7,20,21]. As the precipitation process only affects martensite, and not austenite, it is reasonable to assume that the asymmetry of the austenite (220) diffraction peak observed at PT is due to an heterogenous carbon enrichment in austenite, rather than to the carbide precipitation. Accounting for the nature of Q&P microstructures, the heterogeneities in carbon distribution in austenite can be considered at two different scales:
The heterogeneities could first correspond to different populations of retained austenite islands, enriched in different ways. During carbide-free bainitic treatments, [12,13] have determined, using HEXRD, that blocky austenite islands and intra-lath austenite films show respectively low and high carbon contents. The differences in the carbon contents between the two kinds of islands remain until the end of the thermal treatment. These two kinds of austenite have also been observed by Xiong et al. [10] in a Q&P steel, but after an intercritical annealing.
Other authors [4,20] have also predicted and observed that a nanoscale transitory layer of carbon-enriched austenite at the martensite/austenite interface would form at the beginning of the partitioning step. These layers have been observed experimentally by APT in the investigated steel after interrupted thermal cycles [9]. A strong carbon profile is established in the austenite that results mainly from carbon diffusion from martensite to austenite while the martensite/austenite interfaces is immobile. At the beginning of the partitioning, two distinct regions can be identified in austenite based on their different carbon contents. An enriched carbon region compared to the mean composition of austenite which extends over several nanometers from the martensite/austenite interface to the austenite and a more depleted carbon region in austenite. It is as if we have two austenite of different carbon contents inside a single austenite island.
In the present case, the peak asymmetry appears when partitioning process starts, and vanishes after 200s. As a consequence, it is reasonable to think that the observed asymmetry has to be attributed to the presence of carbon-enriched austenite at the martensite/austenite interface inside austenite islands at nanoscale. These enriched carbon layers are to be found at the martensite/austenite interface, thus inside most of austenite islands. This assumption is sustained by the fact that the microstructure at QT is essentially fibrous and already fragmented by the martensitic transformation (85% martensitic) [4,8,22] without coarse austenitic domains, contrary to the case in carbide-free bainitic steels. As shown by [16], the line broadening and its anisotropy reveals in cubic phases the shape of the composition distribution inside the diffracting phase. The source of anisotropy appearing from the composition gradient in non-cubic lattices and due to the lattice it-self must be excluded from the analysis.
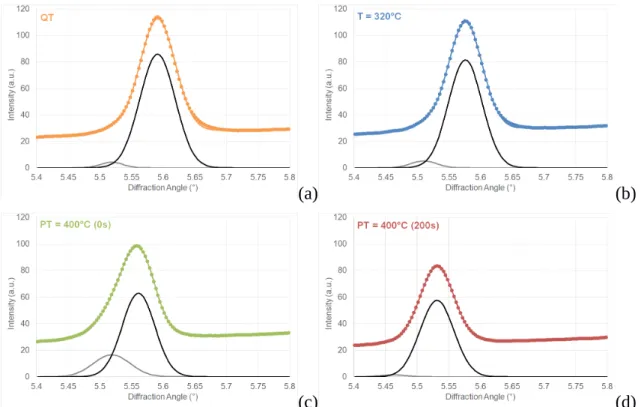
In order to investigate the possible extent of the carbon distribution in austenite and compare it to the available experimental measurements by APT, the diffraction peaks presented in Figure 2(a) have been modeled individually by two symmetric gaussian curves using a least-square methods. The main gaussian contribution is assumed to correspond to the austenite with the bulk composition, whereas the minor gaussian contribution would represent the carbon-enriched austenite. The background signal has been again approximated by an affine function. Figure 3 shows the results of the refinement procedure for each curve plotted in Figure 2(a). The symbols correspond to the experimental values, the colored continuous line to the best calibration (the sum of the background function and the two gaussian functions) and the black and grey continuous curves correspond to the minor and major gaussian contributions respectively. In all cases, the simulated curves describe with an excellent agreement the experimental results, especially on the left side of the peak. Despite possible continuous carbon gradients within retained austenite [9], this model, based on to two gaussian contributions, is sufficient to describe the observed skewness of the diffraction peaks.
The peaks at QT, T = 320°C and at the end of partitioning step are well described by the sole major gaussian curve. The relative integral breath of the minor contributions is less than 6% of the major ones (skewness lower than 0.05). On the contrary, the shape of the peak at the beginning of the partitioning step (green curve) can only been explained by the presence of a significant fraction of carbon rich austenite (20% of the integral breath of the main contribution). The position of this secondary peak corresponds to an austenite with a mean carbon enrichment of 0.83wt.% as compared to the mean bulk value (0.6wt.%) reported at this stage by [7]. As a consequence, the enriched austenite shows a carbon content of about 1.43wt.% (6.4at.%). When applying the same adjustment procedure on (200), (220) and (311) austenite peaks that are also highly asymmetric, the deduced enrichment is slightly higher (1.78wt.%). The value determined by the procedure can thus depend on the crystallographic orientations and must only be considered qualitatively.
(a) (b)
(c) (d)
Figure 3: (220) diffraction peaks of austenite corresponding to the four critical times identified in Figure 2. (a) at QT, (b) at 320°C corresponding to the local minimum of the FWHM (c) at the beginning of the partitioning step, (d) at the end of the partitioning step. The symbols correspond to the experimental values, the colored continuous lines to the double symmetric gaussian model and the black and grey continuous curves correspond to the minor and major gaussian contributions respectively.
The table 1 shows the mean carbon compositions measured in austenite and the carbon compositions measured at martensite/austenite by APT of two samples (one tip of each), after respectively 0 and 200s of partitioning at PT [9]. The values found by HEXRD in [7] and thanks to the present analysis are also reported. There is thus a very good agreement between both technics which appear as very complementary to study Q&P steels.
Table 1: Comparisons between the mean/max carbon compositions measured by APT [9] and HEXRD (this paper) on two samples, after 0s and 200s of partitioning respectively. The direct uncertainties on given HEXRD values for mean enrichments are estimated around +/- 0.03 wt.% and the one relative to atom probe measurements around +/- 0.22 wt.%.
APT measurements ([9]) HEXRD (this paper) Mean carbon content measured in austenite Carbon content measured at martensite/austenite interface (in austenite)
Mean carbon content in austenite Carbon content in carbon-rich austenite (minor peak) PT = 400°C (t = 0s) 0.7 wt.% 1.25 wt % 0.6 wt.% ([7]) 1.43 wt.% PT = 400°C (t = 200 s) 1.1 wt.% Homogeneous distribution 0.95 wt.% ([7]) Negligible peak
The comparison in Table 1 was conducted only on two representative ATP tips [9]. In parallel, we have analysed several tips by APT at (PT=400°C, t=0s) and (PT=400°C, t=200°C) and for different values of QT. For the longest time, the carbon gradients are very lightly marked, if not non-existent. In that case, the mean carbon composition measured in austenite exhibits a small dispersion. For the shortest times, both the mean carbon and the carbon gradients in austenite can be more marked depending on the interface analysed. This behaviour would come mainly from the natural dispersion existing in the microstructure. Indeed, both the carbon diffusion length and the carbon gradient is expected to depend on the local size of austenite. In any case, the comparison between APT (which is local) and HEXRD (which is global) can only be qualitative.
In conclusion, the observed increase in FWHM of the (220) austenite peak obtained after Rietveld refinement is due to the change in the peak asymmetries. The peak asymmetries can be explained by the heterogeneous distribution of carbon in austenite islands at martensite/austenite interface at nanoscale. For the studied steel (Fe-0.3C-2.5Mn-1.5Si wt.%) and selected Q&P conditions (QT=200°C, PT=400°C), the heterogeneities appear during the short heating stage during which carbon partitioning mechanism is already active. They are at their maximum when reaching the partitioning temperature, and vanish after 200s. At the end of the partitioning step, the carbon appears homogenously distributed in austenite.
Acknowledgements
This work was supported by the French State through the project “CAPNANO” referenced by ANR-14-CE07-0029 and also through the program “Investment in the future” operated by the National Research Agency (ANR) and referenced by ANR-11-LABX-0008-01 (LabEx DAMAS). The synchrotron experiments were realized in December 2016, under the P160 grant at DESY PETRA P-07 in Hamburg, which is fully acknowledged. The authors want to thank Jean-Christophe Hell for his support during the experiments. The authors would like also to thank MATERALIA cluster (Region Grand Est) for their support.
References
[1] J. Epp, T. Hirsch, C. Curfs, Metall. Mater. Trans. A Phys. Metall. Mater. Sci. 43 (2012) 2210–2217.
[2] T.D. Bigg, D. V. Edmonds, E.S. Eardley, J. Alloys Compd. 577 (2013) 695–698.
[3] P. Huyghe, M. Caruso, J.L. Collet, S. Dépinoy, S. Godet, Mater. Sci. Eng. A 743 (2019) 175–184.
[4] M. Gouné, F. Danoix, S. Allain, O. Bouaziz, M. Goune, F. Danoix, S. Allain, O. Bouaziz, Scr. Mater. 68 (2013) 1004–1007.
[5] S.Y.P. Allain, G. Geandier, J.-C.J.-C. Hell, M. Soler, F.F. Danoix, M. Gouné, Metals (Basel). 7 (2017) 232.
[6] S.Y.P. Allain, G. Geandier, J.C.C. Hell, M. Soler, F. Danoix, M. Gouné, Scr. Mater. 131 (2017) 15–18.
[7] S.Y.P. Allain, S. Gaudez, G. Geandier, J.C. Hell, M. Gouné, F. Danoix, M. Soler, S. Aoued, A. Poulon-Quintin, Mater. Sci. Eng. A 710 (2018) 245–250.
[8] S. Allain, S. Aoued, A. Quintin-Poulon, M. Gouné, F.F. Danoix, J.-C. Hell, M. Bouzat, M. Soler, G. Geandier, M. Goune, F.F. Danoix, J.-C. Hell, M. Soler, G. Geandier, Materials (Basel). 11 (2018) 1087.
[9] M. Gouné, S. Aoued, F. Danoix, G. Geandier, A. Poulon-Quintin, J.C. Hell, M. Soler, S.Y.P. Allain, M. Goune, S. Aoued, F. Danoix, G. Geandier, A. Poulon-Quintin, J.C. Hell, M. Soler, Scr. Mater. 162 (2019) 181–184.
[10] X.C. Xiong, B. Chen, M.X. Huang, J.F. Wang, L. Wang, Scr. Mater. 68 (2013) 321–324. [11] X.H. Hu, X. Sun, L.G. Hector, Y. Ren, Acta Mater. 132 (2017) 230–244.
[12] L. Guo, H.K.D.H. Bhadeshia, H. Roelofs, M.I. Lembke, Mater. Sci. Technol. (United Kingdom) 33 (2017) 2147–2156.
[13] R. Rementeria, J.A. Jimenez, S.Y.P. Allain, G. Geandier, J.D. Poplawsky, W. Guo, E. Urones-Garrote, C. Garcia-Mateo, F.G. Caballero, Acta Mater. 133 (2017) 333–345.
[14] J. Rodríguez-Carvajal, Phys. B Phys. Condens. Matter 192 (1993) 55–69. [15] G. Caglioti, A. Paoletti, F.P. Ricci, Nucl. Instruments 3 (1958) 223–228. [16] A. Leineweber, E.J. Mittemeijer, J. Appl. Crystallogr. 37 (2004) 123–135.
[17] S. Das Bakshi, D. Sinha, S. Ghosh Chowdhury, Mater. Charact. 142 (2018) 144–153.
[18] W. Horvath, W. Prantl, H. Stroißnigg, E.A. Werner, Mater. Sci. Eng. A 256 (1998) 227– 236.
[19] O. Bouaziz, S. Allain, C.P.P. Scott, P. Cugy, D. Barbier, High Manganese Austenitic Twinning Induced Plasticity Steels: A Review of the Microstructure Properties Relationships, Elsevier Ltd, 2011.
[20] M.J. Santofimia, L. Zhao, J. Sietsma, Scr. Mater. 59 (2008) 159–162.
[21] F. HajyAkbary, J. Sietsma, G. Miyamoto, T. Furuhara, M.J. Santofimia, Acta Mater. 104 (2016) 72–83.

![Table 1: Comparisons between the mean/max carbon compositions measured by APT [9] and HEXRD (this paper) on two samples, after 0s and 200s of partitioning respectively](https://thumb-eu.123doks.com/thumbv2/123doknet/14439242.516611/14.892.83.772.208.487/table-comparisons-carbon-compositions-measured-samples-partitioning-respectively.webp)
