© International Epidemiological Association 1985 Printed in Great Britain
A Computer Simulation of the EPI
Survey Strategy
STANLEY LEMESHOW*. ALEXANDRE G TSERKOVNYI**.
JAMES LEONARD TULLOCHt, JOHN E DOWD*, STEVEN K LWANGA* AND JACOBUS KEJA§
Lemeshow S (Division of Public Health, School of Health Sciences, University of Massachusetts, Amherst MA 01003, USA), Tserkovnyi A G, Tulloch J L, Dowd J E, Lwanga S K and Keja J. A computer simulation of the EPI survey strategy. Internationa/Journal of Epidemiology 1985, 14: 473-481.
A Monte Carlo simulation study was designed to evaluate the sample survey technique currently used by the Expanded Programme on Immunization (EPI) of the World Health Organization. Of particular interest was how the EPI strategy compared to a more traditional sampling strategy with respect to bias and variability of estimates. It was also of interest to investigate whether the estimates of population vaccination coverage were accurate to within 10 percentage points of the actual levels. It was found that within particular clusters, the EPI method was particularly sensitive to pocketing of vaccinated individuals, but the more traditional method gave more accurate and less variable results under a variety of conditions. However, the stated goal of the EPI, of being able to produce population estimates accurate to within 10 percentage points of the true levels in the population, was satisfied in the artificially created populations studied.
The Expanded Programme on Immunization (EPI) of the World Health Organization continually faces the problem of documenting disease-specific morbidity, mortality and immunization coverage rates in develop-ing countries. Since this information is not readily available to local health managers, EPI has worked to develop a method which could obtain accurate information quickly and cheaply and, in addition, could be implemented in a relatively standardized manner from one country to another.
The sampling scheme used by EPI may be charac-terized as a probability proportionate to size (PPS) cluster sample. Contrary to classical statistical theory, however, and because of logistic and managerial con-straints in field operations, the EPI strategy is to select only the first household within a cluster at random. This household (HH) is visited to determine if any children in the target age group live there and, if so, to collect the required information. If no child of the right age lives in the first HH visited, the interviewer
• Division of Public Health, School of Health Sciences, University of Massachusetts, Amherst, MA 01003, USA.
** Division of Information Systems Support, World Health Organiza-tion, 1211 Geneva, Switzerland.
+ Diarrhoeal Diseases Control Program, World Health Organization, 1211 Geneva, Switzerland.
* Epidemiology and Statistical Methodology Unit, World Health Organization, 1211 Geneva, Switzerland.
§ Expanded Programme on Immunization, World Health Organiza-tion, 1211 Geneva, Switzerland.
proceeds to the 'physically closest' HH. This process continues until seven children are identified within a cluster. Details of the EPI sampling procedure have been presented elsewhere.1"3
This paper describes the results of a Monte Carlo simulation study which evaluated the EPI survey methodology in three ways:
(1) By assessing its ability to achieve the stated objective of producing estimates of population vaccination coverage accurate to within 10 percentage points of the actual level;
(2) By examining its performance relative to a classical PPS sampling strategy with respect to bias and variability of estimates of true immunization coverage; (3) By identifying those factors which may produce high bias and variability at the individual cluster level. THE SIMULATION DESIGN
Thirty artificially constructed population clusters were established. Each cluster had a specific combination of population density, household distribution pattern, immunization rate, and immunization pattern. Population Density
Each cluster had 600 HH; one in every seven HH contained a child in the target age group. Population density within the cluster was controlled by using matrices into which the HH were placed. Four density types were defined, ranging from 'low' representing sparsely populated areas (9.4 HH/100 cells) to 'very
474 INTERNATIONAL JOURNAL OF EPIDEMIOLOGY
high' representing highly urbanized areas (66.7 HH/ 100 cells).
Household Distribution Pattern
Four basic HH distribution patterns were adopted. In the first, HH were distributed at random. In the second, cells in the matrix close to an assumed central road or stream had a higher probability of containing a HH than those furthest away. In the third, HH were concentrated around a single focus (such as a church, town hall, or market). The fourth pattern reflected a community with two central foci. Probabilities of HH placement were created for each of the four density types.
Placement of Children
One out of every seven HH contained a child. This placement was done randomly.
Level of Coverage
The proportion of children within a particular cluster specified to be vaccinated was fixed at one of five levels: 10%, 30%, 50%, 70%, or 90%.
Identification of Vaccinated Children
One of four possible strategies was used to determine which of the children in a cluster were vaccinated. In the first, vaccinated children were identified at random among all children in a particular cluster at the specified level of coverage. The second strategy estab-lished a single 'pocket of vaccination' by randomly identifying a HH containing a child, vaccinating that child, and then, using that HH as a focus, all children identified around it were designated to be vaccinated. This process continued until the required number of vaccinated children was achieved. The third strategy established two pockets of vaccination. The fourth strategy established five pockets of vaccination, each containing 20% of the total number of children specified to be vaccinated.
DESIGN OF THE SIMULATION
Random Number Generation
Uniform [0,1) random numbers were used to construct clusters with specific combinations of parameters, and to simulate the two sampling strategies. The random number generator used is based on the algorithm described by Lewis et al,A and the required seeds were
drawn from the PL/1 TIME function.
Creation of the Clusters
Once the particular parameters of the cluster were specified, there were known probabilities associated
with each of the cells in the matrix with respect to the existence of a HH and a child. Starting with the upper left-hand cell of the matrix, a random number was generated and compared with the corresponding probability of a HH. If the number generated was less than the probability of a HH in the particular cell, a HH was placed. If the HH was placed, a second random number was generated in order to determine whether it contained a child. If this random number was less than 0.1428 (corresponding to 1/7 probability of a child irrespective of the population density), a child was placed. This process was repeated for every cell in the matrix. Following HH and child placement, vaccinated children were identified in accordance with the specified immunization pattern and level of coverage. If the vaccination pattern was to be uniform, a random number was generated for each cell contain-ing a child. If this number was less than the specified coverage rate for that cluster, the child was identified as 'vaccinated'. For clusters with vaccination pockets, a random coordinate of the matrix was generated. If this cell contained a child, that child was vaccinated and the cell became the focus of a 'pocket of vaccination'. If that cell did not contain a child, new random co-ordinates were generated until a child was found. This process of forming the pockets of vaccination was repeated until the specified number of pockets was created.
Household Visitation—the EPIand SRS Algorithms
To simulate the process of identifying the 'physically closest' HH as in the EPI methodology, a cell with a HH was randomly selected in the matrix. This HH became the starting point for HH visits. If the HH did not contain a child, the eight cells surrounding the focal cell were searched for a HH, proceeding counter-clock-wise beginning with the cell in the lower right-hand corner. If no HH existed in these cells, the radius was increased and searched in the same manner. The process was terminated when the first HH was detected. If a child was present, vaccination status was recorded; otherwise, the next closest HH was sought using the algorithm described above, until seven children were identified and their vaccination status recorded. In contrast, the SRS strategy used seven randomly selected starting points in each cluster, and nearest HH were visited until a single child's vaccina-tion status was recorded.
The Simulation Process
Once a cluster was established with its particular placement of HH, vaccinated and unvaccinated children, 500 independent samples of seven children
each were selected using the EPI sampling strategy and 500 additional independent samples were selected using the SRS strategy. Each sample resulted in an estimate of the proportion of children actually vaccinated in the entire cluster. Let E(PEJ) denote the average of the 500 estimated proportions resulting from the EPI strategy used in the i-th cluster, and let 6(PSJ) denote the corres-ponding average with the SRS method. The following outcome measures were computed for the i-th cluster:
BIAS (PEi) = {E(PEi) - Pi} and BIAS (PSi) = {E(Psi) - Pi}
VAR (PEi) =
500
E
500
JJ - E(PEi))2/5O0 and
VAR (PSi) = E (Psij - E(PSi))2/5O0
500
MSE (PEi) = E (PEij - Pi)2/500 and MSE (PSi)
500
= E (Psij - Pi)V500
proportion using samples selected with SRS was estimated as:
30 Ps = E Psi/30
These estimates were produced for each of the 500 replications of the process and overall comparative statistics were calculated as follows:
BIASE = {E(PE) - P} and BIASS = (E(PS) - P}
500
VARE = E (P;E - E(PE))2/500 and VARS
500
= E
- E(PS))2/5OO500
MSEE = E (PjE - P)2/500 and MSES =
500
E (Pjs - P)2/5OO
Also computed was the absolute relative bias, defined as
ARB (PEi) = | BIAS (PEi)| /Pj and ARB (PSi) = | BIAS (PSi)| /Pi
where P; is the actual proportion of children vaccinated in the i-th cluster. (Note that because a random process was employed in the creation of the clusters, the actual level of vaccination attained was not precisely equal to the level specified, although differences were typically small.)
In order to simulate programme applications of these sampling methods, five populations of 30 clusters were constructed, the parameters of which were chosen to reflect actual population characteristics. The pro-portion of vaccinated children in the population was estimated using the EPI results as follows:
30
PE =
where PEJ is the estimated proportion in the i-th cluster using the EPI methodology. Similarly, the estimated
Note that MSEE = BIASE2 + VARE and MSES = BIASS2 + VARS.
It should be emphasized that the term 'bias' is a statistical concept used to compare, in a very specific manner, estimators produced from two sampling designs. It is not used as in epidemiological research (ie, any circumstance which results in obscuring or artificially creating an observed risk factor/disease association).
Limitations
As with any computer simulation, there were basic limitations which could influence the interpretation of the results. First, while an attempt was made to reflect such population characteristics as density, placement of households, and location and proportion of children vaccinated, it was not possible to incorporate many important, dynamic but unmeasurable qualities which characterize real populations. Second, in actual field operations, non-sampling errors due to inadequate coverage, non-response and interviewer bias are usually considerable. No attempt was made to address these basic problems. Third, simplifications necessary for the simulation could be viewed as exaggerations of reality.
476 INTERNATIONAL JOURNAL OF EPIDEMIOLOGY
For example, pocketing of vaccinated children was exaggerated in that there was 100% coverage within a pocket and 0% coverage elsewhere. Such extremes would be rare in real populations. Also, the chosen cluster size of 600 HH is larger than many typical villages where EPI surveys might be conducted. Fourth, the algorithms used for simulating the movement from house to house in both survey strategies were based on an orderly arrangement of rows and columns within a grid. This clearly does not reflect actual conditions encountered in the field. Finally, the simulations were quite expensive to perform, with each run of 500 replications within each set of 30 clusters costing approximately $100. There-fore, not all combinations of cluster characteristics were used.
RESULTS
Evaluation Within Five Artificial Populations
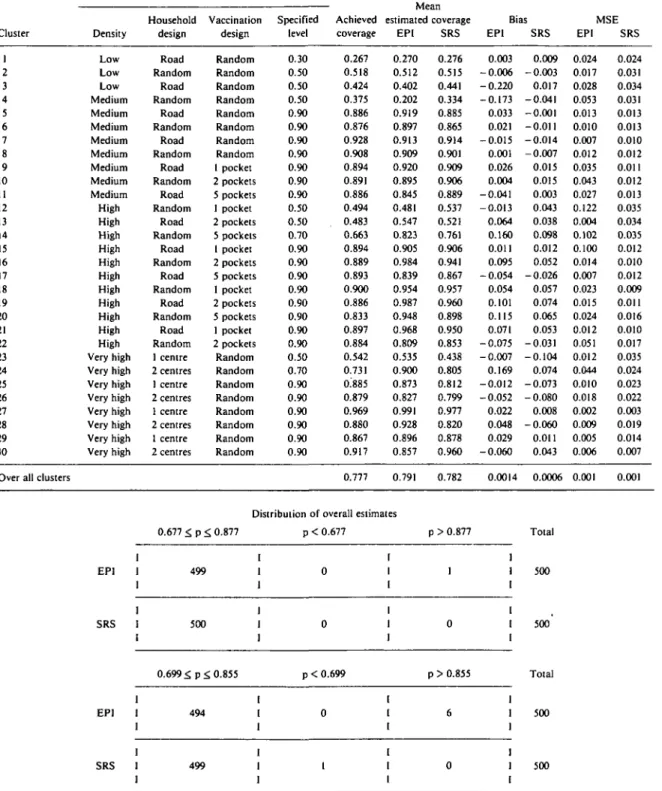
Table 1 presents results for the first of five artificially created populations from which repeated samples were taken carried out in order to evaluate the performance of the EPI and SRS methodologies. Columns 2 through 5 of this table describe the population density and distribution, and the vaccination pattern and coverage for each of the 30 clusters. The performance of the EPI methodology relative to its stated aim of estimation within 10 percentage points is summarized in the data at the bottom of the table. Performance relative to SRS can also be determined from these data and from the 'over all clusters' line in the table. Bias and variability at the cluster level are presented in the last four columns of the body of the table.
The population described in Table 1 was designed to represent a predominantly urban area with high vaccination coverage. Population density, HH distribution, HH pattern, and level of vaccination were varied among the 30 clusters, as seen in columns 2 through 5. As can be seen in column 5, the proportion of vaccinated children was designed to be quite high in the various clusters and, as seen in column 6, the actual proportion vaccinated was close to the planned level in most instances. The planned overall vaccination rate was 79%, but a rate of 77.7% was actually attained. The average of the 500 estimates of the proportions of children vaccinated in each cluster is presented in columns 7 and 8 for the two sampling strategies. Columns 9 and 10 present the bias for both strategies, and columns 11 and 12 present the mean square error (MSE). In addition, the overall proportion vaccinated in the population was estimated from the data collected from all 30 clusters. This was done 500 times for each of the sampling strategies and the mean estimated
proportion, the bias and the MSE are presented in the row labelled 'over all clusters'.
From the data at the bottom of Table 1, it can be seen that only one (0.2%) of the 500 EPI estimates of the overall vaccination coverage differed from the true level (P) by more than 10 percentage points. None of the 500 SRS estimates differed from the true level to this extent. Using a more stringent requirement that the estimated levels fall within 10% of P, it is seen that six (1.2%) of the EPI samples produced excessive values while one (0.2%) SRS sample underestimated P. Comparing the overall EPI and SRS estimates of P reveals that while the former was somewhat more biased, the two methods produced equivalent MSE. With respect to results at the cluster level, the EPI methodology produced estimates with greater bias than the SRS methodology in 20 of the 30 clusters. The magnitude of the differences in the bias and MSE between the methods was typically small.
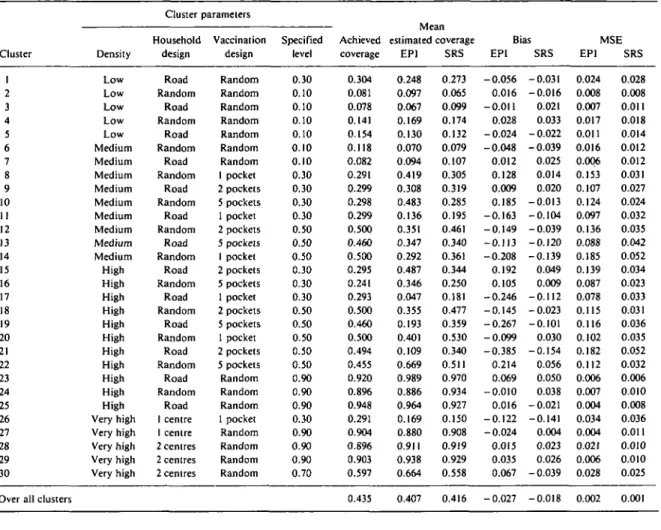
A mixed (urban/rural) population with a planned overall vaccination coverage of 46% and pocketing of vaccination in 16 of the 30 clusters was also used in the simulation. Results are presented in Table 2. EPI estimates of total coverage exceeded the 10 percentage point limit in 18 (3.6%) samples, while SRS produced no estimates with this degree of bias. The narrower limits (P ± 0.10(P)) were exceeded 219 (43.8%) and 117 (23.4%) times with the EPI and SRS methods, respec-tively. The extreme values were typically under-estimates. Overall bias and MSE were higher with the EPI method. At the cluster level, the SRS method produced lower bias in 20 clusters. In the clusters with pocketing of vaccination, the EPI method typically had considerably higher bias and MSE.
The three additional populations constructed repre-sented:
(a) a population with both urban and rural clusters and a planned overall vaccination coverage of 65%;
(b) a predominantly rural population with the same planned overall vaccination coverage (65%) as in (a);
(c) a largely rural population with low planned overall vaccination coverage (17%).
The findings using these three populations closely paralleled those shown in Table 2 and results are not presented here. Clearly, numerous other populations could have been constructed and examined.
Evaluation of the Basic Factors
An analysis of variance (ANOVA) was designed with the following factors and levels:
Factor
Density
Levels
TABLE 1 Cluster parameters, coverage level achieved, mean estimated coverage, bias and mean squared error for EPl versus SRS estimates for
vaccination coverage for each of 30 clusters and over all clusters for a predominantly urban area with planned 79% overall coverage.
Cluster 1 2 3 4 5 6 7 8 9 10 11 12 13 14 15 16 17 18 19 20 21 22 23 24 25 26 27 28 29 30
Over all clusters
Density Low Low Low Medium Medium Medium Medium Medium Medium Medium Medium High High High High High High High High High High High Very high Very high Very high Very high Very high Very high Very high Very high Cluster Household design Road Random Road Random Road Random Road Random Road Random Road Random Road Random Road Random Road Random Road Random Road Random 1 centre 2 centres 1 centre 2 centres 1 centre 2 centres 1 centre 2 centres parameters Vaccination design Random Random Random Random Random Random Random Random 1 pocket 2 pockets 5 pockets 1 pocket 2 pockets 5 pockets 1 pocket 2 pockets 5 pockets 1 pocket 2 pockets 5 pockets 1 pocket 2 pockets Random Random Random Random Random Random Random Random Specified level 0.30 0.50 0.50 0.50 0.90 0.90 0.90 0.90 0.90 0.90 0.90 0.50 0.50 0.70 0.90 0.90 0.90 0.90 0.90 0.90 0.90 0.90 0.50 0.70 0.90 0.90 0.90 0.90 0.90 0.90 Achieved coverage 0.267 0.518 0.424 0.375 0.886 0.876 0.928 0.908 0.894 0.891 0.886 0.494 0.483 0.663 0.894 0.889 0.893 0.900 0.886 0.833 0.897 0.884 0.542 0.731 0.885 0.879 0.969 0.880 0.867 0.917 0.777 estimated coverage EPl 0.270 0.512 0.402 0.202 0.919 0.897 0.913 0.909 0.920 0.895 0.845 0.481 0.547 0.823 0.905 0.984 0.839 0.954 0.987 0.948 0.968 0.809 0.535 0.900 0.873 0.827 0.991 0.928 0.896 0.857 0.791 SRS 0.276 0.515 0.441 0.334 0.885 0.865 0.914 0.901 0.909 0.906 0.889 0.537 0.521 0.761 0.906 0.941 0.867 0.957 0.960 0.898 0.950 0.853 0.438 0.805 0.812 0.799 0.977 0.820 0.878 0.960 0.782 Bias EPl 0.003 -0.006 -0.220 -0.173 0.033 0.021 -0.015 0.001 0.026 0.004 -0.041 - 0 . 0 1 3 0.064 0.160 0.011 0.095 -0.054 0.054 0.101 0.115 0.071 -0.075 -0.007 0.169 -0.012 -0.052 0.022 0.048 0.029 -0.060 0.0014 SRS 0.009 -0.003 0.017 -0.041 -0.001 -0.011 -0.014 -0.007 0.015 0.015 0.003 0.043 0.038 0.098 0.012 0.052 -0.026 0.057 0.074 0.065 0.053 -0.031 -0.104 0.074 -0.073 -0.080 0.008 - 0 . 0 6 0 0.011 0.043 0.0006 MSE EPl 0.024 0.017 0.028 0.053 0.013 0.010 0.007 0.012 0.035 0.043 0.027 0.122 0.004 0.102 0.100 0.014 0.007 0.023 0.015 0.024 0.012 0.051 0.012 0.044 0.010 0.018 0.002 0.009 0.005 0.006 0.001 SRS 0.024 0.031 0.034 0.031 0.013 0.013 0.010 0.012 0.011 0.012 0.013 0.035 0.034 0.035 0.012 0.010 0.012 0.009 0.011 0.016 0.010 0.017 0.035 0.024 0.023 0.022 0.003 0.019 0.014 0.007 0.001
Distribution of overall estimates
0.677 ^ p <. 0.877 p < 0.677 p > 0.877 EPl SRS I 499 1 500 0 0 1 1 1 I 1 0 I I 0.699 £ p £ 0.855 p < 0.699 p > 0.855 EPl SRS 1 1 494 I 499 0 1 I I I I I 1 6 I 0 1 1 Total 500 500 Total 500 500
478 INTERNATIONAL JOURNAL OF EPIDEMIOLOGY
TABLE 2 Cluster parameters, coverage level achieved, mean estimated coverage, bias and mean squared error for EPl versus SRS estimates for
vaccination coverage for each of 30 clusters and over all clusters for a mixed (urban/rural) area with planned 46% overall coverage.
Cluster 1 2 3 4 5 6 7 8 9 10 11 12 13 14 15 16 17 18 19 20 21 22 23 24 25 26 27 28 29 30
Over all clusters
Density Low Low Low Low Low Medium Medium Medium Medium Medium Medium Medium Medium Medium High High High High High High High High High High High Very high Very high Very high Very high Very high Cluster Household design Road Random Road Random Road Random Road Random Road Random Road Random Road Random Road Random Road Random Road Random Road Random Road Random Road 1 centre 1 centre 2 centres 2 centres 2 centres parameters Vaccination design Random Random Random Random Random Random Random 1 pocket 2 pockets 5 pockets 1 pocket 2 pockets 5 pockets 1 pocket 2 pockets 5 pockets 1 pocket 2 pockets 5 pockets 1 pocket 2 pockets 5 pockets Random Random Random 1 pocket Random Random Random Random Specified level 0.30 0.10 0.10 0.10 0.10 0.10 0.10 0.30 0.30 0.30 0.30 0.50 0.50 0.50 0.30 0.30 0.30 0.50 0.50 0.50 0.50 0.50 0.90 0.90 0.90 0.30 0.90 0.90 0.90 0.70 Achieved coverage 0.304 0.081 0.078 0.141 0.154 0.118 0.082 0.291 0.299 0.298 0.299 0.500 0.460 0.500 0.295 0.241 0.293 0.500 0.460 0.500 0.494 0.455 0.920 0.896 0.948 0.291 0.904 0.896 0.903 0.597 0.435 1VI Call estimated coverage EPl 0.248 0.097 0.067 0.169 0.130 0.070 0.094 0.419 0.308 0.483 0.136 0.351 0.347 0.292 0.487 0.346 0.047 0.355 0.193 0.401 0.109 0.669 0.989 0.886 0.964 0.169 0.880 0.911 0.938 0.664 0.407 SRS 0.273 0.065 0.099 0.174 0.132 0.079 0.107 0.305 0.319 0.285 0.195 0.461 0.340 0.361 0.344 0.250 0.181 0.477 0.359 0.530 0.340 0.511 0.970 0.934 0.927 0.150 0.908 0.919 0.929 0.558 0.416 Bias EPl -0.056 0.016 -0.011 0.028 -0.024 -0.048 0.012 0.128 0.009 0.185 -0.163 - 0 . 1 4 9 - 0 . 1 1 3 -0.208 0.192 0.105 -0.246 -0.145 -0.267 - 0 . 0 9 9 -0.385 0.214 0.069 -0.010 0.016 -0.122 -0.024 0.015 0.035 0.067 -0.027 SRS -0.031 -0.016 0.021 0.033 -0.022 - 0 . 0 3 9 0.025 0.014 0.020 -0.013 -0.104 -0.039 -0.120 -0.139 0.049 0.009 -0.112 -0.023 -0.101 0.030 -0.154 0.056 0.050 0.038 -0.021 -0.141 0.004 0.023 0.026 -0.039 -0.018 MSE EPl 0.024 0.008 0.007 0.017 0.011 0.016 0.006 0.153 0.107 0.124 0.097 0.136 0.088 0.185 0.139 0.087 0.078 0.115 0.116 0.102 0.182 0.112 0.006 0.007 0.004 0.034 0.004 0.021 0.006 0.028 0.002 SRS 0.028 0.008 0.011 0.018 0.014 0.012 0.012 0.031 0.027 0.024 0.032 0.035 0.042 0.052 0.034 0.023 0.033 0.031 0.036 0.035 0.052 0.032 0.006 0.010 0.008 0.036 0.011 0.010 0.010 0.025 0.001
Distribution of overall estimates
EPl SRS EPl SRS 0.335 < p ^ 0.535 482 500 0.392 < p < 0.479 281 383 p < 0.335 17 0 p < 0.392 199 114 p > 0.535 1 i 0 I I p > 0.479 20 1 1 1 3 1 1 Total 500 500 Total 500 500
Household Design Vaccination Design Vaccination Level Method
Road, One Centre, Random Random, One Pocket 30%, 50%, 70% EPI, SRS
Note that while all available factors are included in this ANOVA, the number of levels used is less than the total number available and described earlier in this paper. This was done to limit the expense of the necessary simulations. With the above levels, there were 108 unique combinations of factors and two replications were performed for each such combination. Each replication involved sampling 500 times from a cluster defined by the unique combination of factor levels and computing one of the outcome variables (ie, absolute relative bias or mean square error). Each of the main effects and many of the interactions were significant with respect to absolute relative bias. Higher density clusters demonstrated higher absolute relative bias. Also, while EPI resulted in higher absolute relative bias than did SRS, the trend of increasing absolute relative bias with increasing density which was noted with EPI was not noted with SRS. This resulted in a significant method-by-density interaction. There was a tendency for absolute relative bias to decrease with increasing coverage with both the EPI and SRS methods. As a result, a significant interaction was not observed. There was a very strong main effect due to vaccination design, with pocketing of vaccinated children demonstrating much higher absolute relative bias than random assign-ment of vaccinated children. The vaccination design by method interaction was also highly significant. This was due to the fact that both the SRS and EPI methods had comparable bias with random vaccination designs, but the EPI method had much greater bias when there was pocketing of vaccination. Examination of the interaction between pocketing and method at different levels of density showed that the tendency for absolute relative bias to be much higher with the EPI method than with the SRS method, when pocketing exists, holds within each of the three density types considered. Comparable results were observed using MSE as the dependent variable in the ANOVA. Highly significant main effects due to vaccination design, level of coverage, and method were noted. Much higher MSE was observed with the EPI method than with the SRS method and pocketing of vaccinated children resulted in higher MSE than with randomly placed vaccinated children. The only striking interaction was the one between vaccination design and method. When vaccinated children were randomly placed, there was little difference between the methods; however, when pocketing existed, the EPI method demonstrated
strikingly higher MSE. The difference between the two methods in the face of pocketing was particularly large in low density clusters. Irrespective of density, there was little difference between the methods if vaccinated children were distributed at random.
DISCUSSION
The stated aim of the EPI survey methodology is to produce estimates of vaccination coverage accurate to within 10 percentage points of the true level in the population with 95% confidence. Based on the results from the five simulated populations, there is no evidence to suggest that this aim is not being achieved. Even when more stringent requirements of precision were specified, the EPI method rarely overestimated the actual population proportion (ie, the estimated proportion was rarely greater than (P ± 0.10(P)). Clearly, for programme management purposes, a survey methodology with a high risk of significant overestimation would not be acceptable.
The comparison of the EPI and the more classical SRS strategies demonstrated that the SRS method was superior to the EPI method with respect to bias and MSE, as well as the proportion of times the estimates fell outside of a defined range. Feasibility permitting, the SRS strategy would be the optimal choice; however, operational constraints often override statistical con-siderations and lead to the selection of the EPI methodology for surveys of vaccination coverage. Given the stated objectives of the EPI survey, this would appear to be a reasonable choice.
The analysis of variance clearly demonstrated that pocketing of vaccinated children in a cluster was closely associated with high bias and variability at the cluster level when the EPI strategy was employed. It should be emphasized that, in any cluster sampling technique, it is inappropriate to produce estimates for individual clusters. Clearly, users of EPI survey results should not succumb to the temptation of using data from indi-vidual clusters to draw conclusions concerning levels of coverage in localized areas. This risk would be mini-mized if names of the particular clusters selected were omitted in the presentation of results.
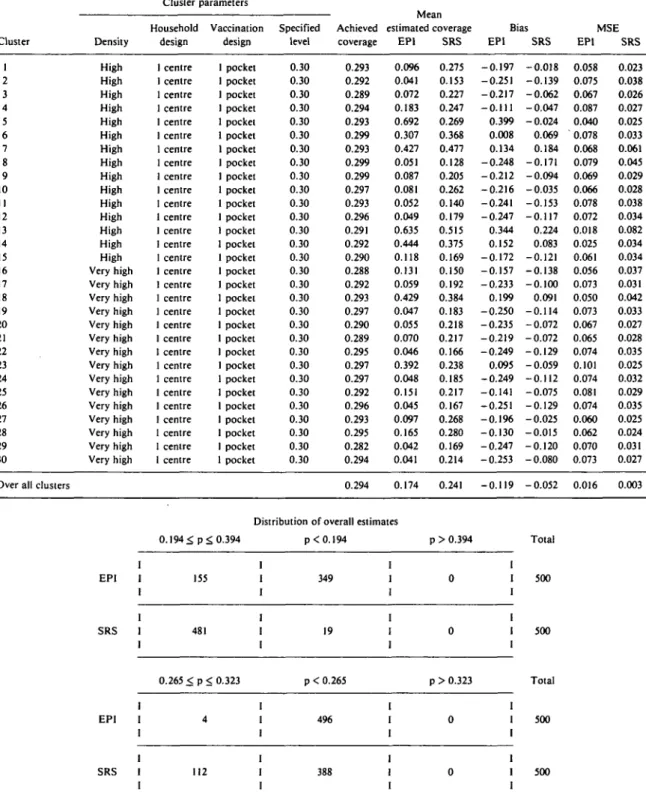
The reader should not assume that the EPI methodology will always satisfy its stated objective with respect to accuracy. To demonstrate this, a 'worst-case' population was constructed which combined high population density, low vaccination coverage and pocketing of vaccination in all clusters. Table 3 presents the results for this population in a format similar to that used in Tables 1 and 2. Use of the EPI method resulted in estimates of acceptable precision (± 10 percentage points) in only 155 (31%) of the 500
480 INTERNATIONAL JOURNAL OF EPIDEMIOLOGY
TABLE 3 Cluster parameters, coverage level achieved, mean estimated coverage, bias and mean squared error for EPI versus SRS estimates for vaccination coverage for each of 30 clusters and over all clusters for a worst case population having a planned 30% overall coverage.
Cluster 1 2 3 4 5 6 7 8 9 10 II 12 13 14 15 16 17 18 19 20 21 22 23 24 25 26 27 28 29 30
Over all clusters
Density High High High High High High High High High High High High High High High Very high Very high Very high Very high Very high Very high Very high Very high Very high Very high Very high Very high Very high Very high Very high Cluster Household design centre centre centre centre centre centre centre centre centre centre centre centre centre centre centre centre centre centre centre centre centre centre centre centre centre centre centre centre centre centre parameters Vaccination design pocket pocket pocket pocket pocket pocket pocket pocket pocket pocket pocket pocket pocket pocket pocket pocket pocket pocket pocket pocket pocket pocket pocket pocket pocket pocket pocket pocket pocket pocket Specified level 0.30 0.30 0.30 0.30 0.30 0.30 0.30 0.30 0.30 0.30 0.30 0.30 0.30 0.30 0.30 0.30 0.30 0.30 0.30 0.30 0.30 0.30 0.30 0.30 0.30 0.30 0.30 0.30 0.30 0.30 Achieved coverage 0.293 0.292 0.289 0.294 0.293 0.299 0.293 0.299 0.299 0.297 0.293 0.296 0.291 0.292 0.290 0.288 0.292 0.293 0.297 0.290 0.289 0.295 0.297 0.297 0.292 0.296 0.293 0.295 0.282 0.294 0.294 iviean estimated coverage EPI 0.096 0.041 0.072 0.183 0.692 0.307 0.427 0.051 0.087 0.081 0.052 0.049 0.635 0.444 0.118 0.131 0.059 0.429 0.047 0.055 0.070 0.046 0.392 0.048 0.151 0.045 0.097 0.165 0.042 0.041 0.174 SRS 0.275 0.153 0.227 0.247 0.269 0.368 0.477 0.128 0.205 0.262 0.140 0.179 0.515 0.375 0.169 0.150 0.192 0.384 0.183 0.218 0.217 0.166 0.238 0.185 0.217 0.167 0.268 0.280 0.169 0.214 0.241 Bias EPI -0.197 -0.251 -0.217 - 0.111 0.399 0.008 0.134 -0.248 - 0 . 2 1 2 -0.216 -0.241 -0.247 0.344 0.152 -0.172 -0.157 -0.233 0.199 -0.250 -0.235 -0.219 -0.249 0.095 -0.249 -0.141 -0.251 -0.196 -0.130 -0.247 -0.253 -0.119 SRS -0.018 -0.139 -0.062 -0.047 -0.024 0.069 0.184 -0.171 -0.094 -0.035 -0.153 -0.117 0.224 0.083 -0.121 -0.138 -0.100 0.091 -0.114 -0.072 -0.072 -0.129 -0.059 -0.112 -0.075 -0.129 -0.025 -0.015 -0.120 -0.080 - 0.052 MSE EPI 0.058 0.075 0.067 0.087 0.040 0.078 0.068 0.079 0.069 0.066 0.078 0.072 0.018 0.025 0.061 0.056 0.073 0.050 0.073 0.067 0.065 0.074 0.101 0.074 0.081 0.074 0.060 0.062 0.070 0.073 0.016 SRS 0.023 0.038 0.026 0.027 0.025 0.033 0.061 0.045 0.029 0.028 0.038 0.034 0.082 0.034 0.034 0.037 0.031 0.042 0.033 0.027 0.028 0.035 0.025 0.032 0.029 0.035 0.025 0.024 0.031 0.027 0.003
Distribution of overall estimates
EPI SRS EPI SRS 0.194^ p<. 0.394 I I 155 1 I 1 481 I 0.265 < p < 0.323 I 4 1 112 I I I I I 1 I I I p < 0.194 349 19 p < 0.265 496 388 p > 0.394 0 I 0 1 p > 0.323 I 0 I 1 I 0 I I Total 500 500 Total 500 500
replications as compared with 481 (96.2%) of the SRS estimates. For both methods, all extreme results were underestimates. Under the more stringent accuracy requirements, neither method would be acceptable. It is not surprising that in this worst-case situation, the EPI estimates were significantly more biased and variable than were the SRS estimates. It should be stressed that it is extremely unlikely that any real population would parallel the one represented by this artificial situation. This study would appear to provide reassuring evidence to users of EPI surveys, that it is possible to estimate the true level of vaccination coverage to within 10 percentage points in typical populations. It also sets forth a warning to those users who might make inferences about vaccination coverage in individual
clusters or groups of clusters. Such disaggregation of the survey data is inadvisable.
REFERENCES
1 Henderson R H, Sundaresan T. Cluster sampling to assess immuniza-tion coverage: a review of experience with a simplified sampling method. Bull WHO 1982; 60: 253-60.
2 World Health Organization Expanded Programme on
Immuniza-tion. Training manual for mid-level managers: evaluate vaccination coverage.
3 Lemeshow S, Robinson D. Surveys to measure programme coverage and impact: a review of the methodology used by the Expanded Progamme on Immunization. World Health Stal Q 1985; 38: 65-75.
4 Lewis P A W , Goodman A F, Miller J M. A pseudo random number generator for the System 360. IBM Systems Journal 1969; 8: 136-46.