HAL Id: hal-00296239
https://hal.archives-ouvertes.fr/hal-00296239
Submitted on 25 May 2007
HAL is a multi-disciplinary open access
archive for the deposit and dissemination of
sci-entific research documents, whether they are
pub-lished or not. The documents may come from
teaching and research institutions in France or
abroad, or from public or private research centers.
L’archive ouverte pluridisciplinaire HAL, est
destinée au dépôt et à la diffusion de documents
scientifiques de niveau recherche, publiés ou non,
émanant des établissements d’enseignement et de
recherche français ou étrangers, des laboratoires
publics ou privés.
Effective UV surface albedo of seasonally snow-covered
lands
A. Tanskanen, T. Manninen
To cite this version:
A. Tanskanen, T. Manninen. Effective UV surface albedo of seasonally snow-covered lands.
At-mospheric Chemistry and Physics, European Geosciences Union, 2007, 7 (10), pp.2759-2764.
�hal-00296239�
www.atmos-chem-phys.net/7/2759/2007/ © Author(s) 2007. This work is licensed under a Creative Commons License.
Chemistry
and Physics
Effective UV surface albedo of seasonally snow-covered lands
A. Tanskanen and T. Manninen
Finnish Meteorological Institute, Helsinki, Finland
Received: 12 January 2007 – Published in Atmos. Chem. Phys. Discuss.: 23 February 2007 Revised: 10 May 2007 – Accepted: 16 May 2007 – Published: 25 May 2007
Abstract. At ultraviolet wavelengths the albedo of most nat-ural surfaces is small with the striking exception of snow and ice. Therefore, snow cover is a major challenge for various applications based on radiative transfer modelling. The aim of this work was to determine the characteristic effective UV range surface albedo of various land cover types when cov-ered by snow. First we selected 1 by 1 degree sample regions that met three criteria: the sample region contained domi-nantly subpixels of only one land cover type according to the 8 km global land cover classification product from the Uni-versity of Maryland; the average slope of the sample region was less than 2 degrees according to the USGS’s HYDRO1K slope data; the sample region had snow cover in March ac-cording to the NSIDC Northern Hemisphere weekly snow cover data. Next we generated 1 by 1 degree gridded 360 nm surface albedo data from the Nimbus-7 TOMS Lambertian equivalent reflectivity data, and used them to construct char-acteristic effective surface albedo distributions for each land cover type. The resulting distributions showed that each land cover type experiences a characteristic range of surface albedo values when covered by snow. The result is explained by the vegetation that extends upward beyond the snow cover and masks the bright snow covered surface.
1 Introduction
Surface albedo at ultraviolet (UV) wavelengths is an essential parameter for various applications based on radiative trans-fer modelling. For example the satellite retrieval algorithms for estimation of the amount of tropospheric trace gases, aerosols or surface UV irradiance are very sensitive to errors in the assumed surface albedo (Martin et al., 2002; Veefkind et al., 2000; Krotkov et al., 2001). Moreover, Laepple et al. (2005) have shown that the UV range surface albedo data
Correspondence to: A. Tanskanen
(aapo.tanskanen@fmi.fi)
used with a chemistry transport model can greatly influence the resulting photochemical reaction rates.
The measured UV albedo values of most natural sur-faces are smaller than 10% (Feister et al., 1995; McKen-zie et al., 1996), but for fresh pure snow UV albedos near unity have been reported (Grenfell et al., 1994; Wuttke et al., 2006). Vast regions experience seasonal snow: in the Northern Hemisphere nearly half of the land surface is sea-sonally covered by snow (Frei and Robinson, 1999). Al-though the albedo of snow depends on the snow grain size, both of which tend to increase as the snow ages (Wiscombe and Warren, 1980; Wuttke et al., 2006), at UV wavelengths the observed decrease in the snow albedo with age is domi-nantly caused by absorbing contaminants, such as desert dust and carbon soot (Wiscombe and Warren, 1980; Warren and Wiscombe, 1980; Ch´yleck et al., 1983).
In mid-latitudes vegetation often extends upward beyond the snow cover reducing the effective albedo of snow cov-ered terrain. The processes related to the surface albedo tran-sitions of a vegetated region are often intricate. Falling snow may first accumulate on the forest canopy and may later be shaken to the ground by wind. In high latitude forests frost, snow and ice stick to trees and pile up forming crown snow-load that does not fall off until spring. Melting of snow is a gradual transition from completely snow covered land to snow-free land, and usually it involves patchy snow cover patterns, ie. part of the ground is snow-free, while there is still some snow left in the shades. Obviously, the effective surface albedo decreases gradually during the transition, and furthermore, the surface albedo of the heterogeneous region depends strongly on the solar zenith angle as well as on the viewing angle. Arola et al. (2003) established a model for the effective surface albedo as a function of snow depth. The model involves a saturation level of the surface albedo, that is reached when low vegetation is completely covered by snow. The saturation level of the surface albedo is a characteristic property of the land cover type.
2760 A. Tanskanen and T. Manninen: Effective UV surface albedo of seasonally snow-covered lands Three-dimensional radiative transfer models have been
used to study the effect of the heterogeneous surface albedo on surface UV irradiance (Ricchiazzi and Gautier, 1998; Deg¨unther et al., 1998; Lenoble, 2000; Kylling and Mayer, 2001; Ricchiazzi et al., 2002). The model results imply that the surface UV irradiance may be influenced by changes in surface albedo as far as tens of kilometers from the point of interest. In mountainous regions topography adds a further complexity to radiative transfer modelling (Lenoble et al., 2004). In order to be able to use 1-D radiative transfer mod-els in the case of heterogeneous surface albedo distribution various methods have been developed for estimation of the
effective albedo (Deg¨unther et al., 1998; Kylling et al., 2000;
Weihs et al., 2001; Schmucki et al., 2001; Smolskaia et al., 2003). These efforts have mainly focussed on cases that con-sist of snow covered and snow free regions that are typical of mountainous or coastal regions. However, these methods can be generalized for determination of an effective albedo of the terrain consisting of various land cover types.
In general, the reflection of light from the surface is de-scribed by its bidirectional reflectance distribution. However, it is often assumed that the surface is a Lambertian reflector which scatters light isotropically. This assumption leads to a simple formulation of the radiative transfer equation and enables determination of the Lambertian Equivalent Reflec-tivity (LER) from
LER = R − R0 T + (R − R0)Sb
(1) where R is the measured top-of-the-atmosphere reflectance,
R0 corresponds to the purely atmospheric part of the re-flectance, T is the fraction of the radiation that reaches the surface and reflects into the direction of the satellite, and Sbis the spherical albedo of the atmosphere for illumination from below.
LER determined from the top-of-the-atmosphere UV
radi-ance measured by satellite instruments can be considered as an estimate of the effective surface albedo in the case the sky is clear of clouds and aerosols. Various sets of surface UV albedo climatologies have been constructed using LER data (Herman and Celarier, 1997; Koelemeijer et al., 2003). Her-man and Celarier (1997) identified six surface scene types, but they made no attempt to make a distinction between snow/ice and clouds. Koelemeijer et al. (2003) calculated spatial averages and standard deviations for a few surface types of the Matthews land usage database (Matthews, 1983), but they did not try to characterize the surface albedo of snow covered land cover types. The objective of this work was to determine the characteristic effective UV surface albedo of various land cover types when covered by snow. In order to determine the characteristic saturation level of the surface albedo we chose to study the surface albedo data in March, when the amount of snow is still considerable, the amount of deposited contaminants is small, and there is sufficient
amount of light for solar backscatter measurements at high latitudes.
2 Materials and methods
2.1 Lambert equivalent reflectivity data from the TOMS measurements
Total Ozone Mapping Spectrometer (TOMS) is series of NASA’s satellite instruments that measure the solar UV ra-diation scattered from the Earth and its atmosphere at six wavelength bands. Moreover, the TOMS instruments mea-sure the extraterrestrial solar radiance in the same six chan-nels. The field of view of the Nimbus-7/TOMS instrument is some 50 by 50 km in the nadir direction, increasing to 150 by 200 km in the extreme off-nadir position (Eck et al., 1987). In this work we used the Nimbus-7/TOMS V8 Level 2 LER at 360 nm data obtained from NASA Goddard Space Flight Center. The Nimbus-7/TOMS measurements cover the time period from late 1978 to early 1993. In order to enable tem-poral analysis of the LER behaviour the original LER data was gridded into 1 by 1 degree regular grid, and by convert-ing the daily grids into time-series of 360 nm LER data for each pixel of the grid. The gridding was done by selecting the LER value with the smallest zolar zenith angle to repre-sent the LER of each grid cell.
2.2 Construction of the surface albedo time series
Surface albedo time-series were constructed by applying the moving time-window (MTW) technique (Tanskanen et al., 2003) to the time-series of the gridded 360 nm LER data. The MTW technique is based on the assumption that the Lam-bertian equivalent reflectivity values within a certain time-window around the day of interest form a sample of the re-flectance distribution. In general, the low values of the dis-tribution correspond to the clear sky case. Therefore, an esti-mate of the surface albedo can be obtained by fitting a linear function to the lower tail of the cumulative reflectivity dis-tribution. At very high values of surface albedo (Rs>0.7) clouds can no longer be distiguished from the bright surface, and the results given by the MTW technique become uncer-tain.
The surface albedo data constructed using the MTW tech-nique differs somewhat from the widely used surface albedo climatologies (Herman and Celarier, 1997; Koelemeijer et al., 2003). The most significant differences are found at high latitudes during the snow cover transition periods: the MTW surface albedo is usually several percents larger than the cli-matological values. This is because the climatologies essen-tially represent the all time lowest surface albedo for a spe-cific month and location, while in reality snow cover and sur-face albedo vary interannually. Because the LER data exists only for the sunlit portion of the Earth, the surface albedo data is not available for polar regions during the polar night.
The error in the surface albedo time series derived from the
LER time series originates from the error in the radiometric
calibration of the satellite instrument as well as from resid-ual cloud contamination (Koelemeijer et al., 2003). The use of the surface albedo data constructed using the MTW tech-nique is not a prerequisite for obtaining the results presented in this paper; the correlation between the land cover type and the surface albedo during snow cover period can be found also in the climatological surface albedo data.
2.3 Land cover type data
The information on land cover type (LCT) was obtained from the 8 km global land cover classification product (DeFries et al., 1998) from the University of Maryland. The land cover product is based on the Pathfinder AVHRR data (1981– 1994). The global land cover classification was carried out using in addition to the normalized difference vegetation in-dex (NDVI) the invidual AVHRR red, infrared and thermal band data. Additionally, 156 high resolution scenes with known cover types were used for training of the classifica-tion algorithm. The product gives land cover type using 13 classes of land cover types listed in Table 1. Additionally, land cover type number 0 denotes water. Not all the land cover types coexist with seasonal snow.
2.4 Slope data
The HYDRO1K slope data (Verdin et al., 1996) were used to exclude sample regions with too much topographical varia-tion. HYDRO1k is a geographic database developed at the U.S. Geological Survey’s Center for Earth Resources Obser-vation and Science (EROS) to provide comprehensive and consistent global coverage of topographically derived data sets, including streams, drainage basins and ancillary layers derived from the USGS 30 arc-second digital elevation model of the world (GTOPO30). The slope data layer describes the maximum change in the elevations between each cell and its eight neighbors. The slope is expressed in integer degrees of slope between 0 and 90. The HYDRO1K slope data sets for North America, Europe and Asia were used to calculate the average slope of the Northern Hemisphere of the grid cells of the 1 by 1 degree regular grid that was used for exclusion of the sample regions with average slope larger than 2 degrees. 2.5 Snow cover data
The snow cover information was extracted from the North-ern Hemisphere EASE-Grid Weekly Snow Cover and Sea Ice Extent Version 2 product (Armstrong and Brodzik, 2002) from the National Snow and Ice Data Center (NSIDC). Snow cover extent data of this product is based on the dig-ital NOAA-NESDIS Weekly Northern Hemisphere Snow Charts, revised by D. Robinson (Rutgers University) and re-gridded to the EASE-Grid. The original NOAA-NESDIS
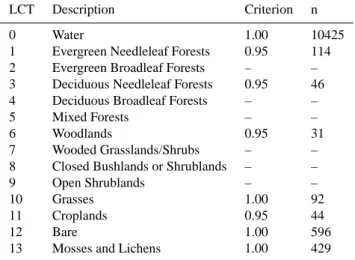
Table 1. Land Cover Types, the criterion for land cover type
domi-nance, and the number of the found test regions with average slope less than 2 degrees.
LCT Description Criterion n 0 Water 1.00 10425 1 Evergreen Needleleaf Forests 0.95 114 2 Evergreen Broadleaf Forests – – 3 Deciduous Needleleaf Forests 0.95 46 4 Deciduous Broadleaf Forests – – 5 Mixed Forests – – 6 Woodlands 0.95 31 7 Wooded Grasslands/Shrubs – – 8 Closed Bushlands or Shrublands – – 9 Open Shrublands – – 10 Grasses 1.00 92 11 Croplands 0.95 44
12 Bare 1.00 596
13 Mosses and Lichens 1.00 429
weekly snow charts are derived from the manual interpre-tation of AVHRR, GOES, and other visible-band satellite data. Sea ice extent is regridded to EASE-Grid from the NSIDC polar stereographic sea ice concentration grids de-rived from Scanning Multi-channel Microwave Radiometer (SMMR) and Special Sensor Microwave Imager (SSM/I) passive microwave brightness temperature data. The spatial resolution of the data is 25 km, the temporal coverage is from October 1966 to June 2001 for snow cover data, and from November 1978 to June 2001 for sea ice extent data.
2.6 Identification of the homogeneous test regions
In order to determine the characteristic effective surface albedo of the various land cover types with snow cover, sev-eral test regions of 1 by 1 degree with as homogeneous land cover as possible were identified. This was done by first de-termining the dominant land cover type of each 1 by 1 degree grid cell in the Northern Hemisphere, and then by selecting the regions with the largest dominance ratio. Furthermore, HYDRO1K slope data were used to exclude regions whose average slope was larger than 2 degrees. For common mid-and high-latitude lmid-and cover types it was easy to find com-pletely homogeneous regions, but for rare land cover types adjusted dominance criterion of 95% dominance was used. In Table 1 are shown the landcover types, the applied domi-nance criterion and the number of the acceptable test regions found. In addition to the water regions there were seven land cover types, for which we were able to find sufficient num-ber of representative test regions. In Fig. 1 are shown the selected test regions for these seven land cover types.
2762 A. Tanskanen and T. Manninen: Effective UV surface albedo of seasonally snow-covered lands
1 Evergreen Needleleaf 3 Deciduous Needleleaf 6 Woodlands 10 Grasses 11 Croplands 12 Bare 13 Mosses and Lichens
Fig. 1. The identified 1 by 1 degree test regions with homogeneous land cover and average slope less than 2%. The test region is sampled
only if it has a snow cover in March.
2.7 Characteristic surface albedo distributions
As the 1 by 1 degree test regions had been selected, the sur-face albedo data of March were collected for the seven land cover types. The surface albedo data were obtained from the
LER data using the MTW technique. Additionally, it was
re-quired that the test region was covered by snow according to the NSIDC snow cover data. Thus, distributions of the char-acteristic surface albedo values for each land cover type were obtained. Because the amount of snow is still considerable in March, the obtained surface albedo distributions were as-sumed to correspond to the saturation level of the effective surface albedo. Statistical methods were applied to the dis-tributions to obtain further information on the characteristic effective surface albedo of the different land cover types.
3 Results
In Figs. 2 and 3 are shown the effective surface albedo dis-tributions of the seven different land cover types in March. There are several physical factors that can explain the wide spread of the effective surface albedo values: the vegetation density or snow depth may vary between test regions of the same land cover type, and there may be errors in the surface albedo, land cover type or snow cover data. It should also be noted that the LER approach neglects the fact that the sur-face albedo is a function of both the solar zenith angle and the viewing angle. Despite the theoretical limitations clas-sification of the LER based surface albedo data according to the land cover type showed that vegetation affects the sur-face albedo and that the effective UV sursur-face albedo of snow covered land is largely determined by the land cover type.
According to the obtained distributions the effective sur-face albedo of the three forest land cover types (Ever-green Needlelead Forests, Deciduous Needleleaf Forests, and Woodlands) were significantly lower than that of pure snow. This can be explained by masking of the bright snow cover by dark vegetation. Figure 2 shows that the evergreen needle-leaf forest is the most efficient forest type to mask the bright snow surface, because the crown of the evergeen needleleaf forest transmits less light than those of the other forest types. Masking is significant also in deciduous needleleaf forests
as well as in woodlands, while the effective albedo of the grasses land cover type is of the same level as that of snow. Apparently, grasses are usually not tall enough to mask the snow cover in March. Figure 3 shows that the effective sur-face albedo of the two minimal vegetation land cover types (Bare, and Mosses and Lichens) were very high, which is nat-ural because there is no vegetation to mask the snow cover. The distribution of the effective surface albedo obtained for the croplands land cover type showed unexpected features: the distribution consisted of a wide range of values and there was a peak at low values below 10%. There are several possi-ble explanations for the unexpected behaviour of the surface albedo of snow covered croplands. Firstly, it should be noted that croplands land cover class includes a wide range of sub-classes, which are all subject to anthropogenic manipulation. Secondly, because most of the croplands are found at lower latitudes, snow cover is less likely and the few selected ho-mogeneous test sites may represent only a subset of the land cover type. Thirdly, the algorithms used for determination of the snow cover as well as surface albedo produce occasion-ally faulty data mainly due to cloud cover, which prevents from drawing strong conclusions. Additionally, at lower lati-tudes the contamination of snow by soot and dust may affect the surface albedo.
The obtained effective UV surface albedo distributions were further analyzed by calculating the average as well as the 10% and 90% percentiles of the distributions. The dis-tribution statistics are presented in Table 2. Robinson and Kukla (1984) have carried out somewhat analogous study using data of the visible part of the solar spectrum. They found that the broadband albedo of the snow covered for-est increases as the latitude increases, and emphasized the role of canopy masking on the effective albedo in conifer-ous forests. Additionally, Davidson et al. (2004) studied the effect of sampling resolution on broadband surface albedo in Canadian boreal forest using bith in-situ pyranometer and GOES-8 satellite data. They found a clear correlation be-tween the land-cover type and clear-sky albedo of the sea-sonally snow covered boreal forest. Our results are in line with these previous findings.
0 20 40 60 80 100
Frequency
Surface Albedo (%) 1: Evergreen Needleleaf Forests
3: Deciduous Needleleaf Forests 6: Woodlands 10: Grasses
Fig. 2. Effective surface albedo distributions of the land cover types
1, 3, 6, and 10 when covered by snow.
0 20 40 60 80 100
Frequency
Surface Albedo (%)
11: Croplands
12: Bare 13: Mosses and Lichens
Fig. 3. Effective surface albedo distributions of the land cover types
11, 12, and 13 when covered by snow.
4 Conclusions
The 360 nm surface albedo data derived from the Lamber-tian equivalent reflectivity data were used together with land cover type, topography and the snow cover data to determine the characteristic effective UV surface albedo of various land cover types when covered by snow. The results imply that the vegetation that extends upward beyond the snow cover has a significant effect on the effective surface albedo by masking the bright snow covered surface. The obtained characteristic values for each land cover type can be used to improve the performance of various satellite retrieval algorithms as well as atmospheric models that involve photochemistry. The new satellite instruments (e.g. MODIS or OMI) provide spectral data with high spatial resolution, and offer further possi-bilites for improved knowledge on global surface albedo at UV wavelengths.
Table 2. The statistics of the effective surface albedo distributions
of the snow-covered lands. <Rs> is the average surface albedo,
P10and P90are the 10% and 90% percentiles of the surface albedo
distribution, respectively.
LCT Description < Rs > P10 P90
1 Evergreen Needleleaf Forests 27.8 13.9 41.7 3 Deciduous Needleleaf Forests 40.6 30.4 50.7 6 Woodlands 55.8 47.0 67.7 10 Grasses 72.0 45.5 80.8 11 Croplands 37.6 4.8 56.6 12 Bare 83.6 73.5 87.5 13 Mosses and Lichens 82.9 72.5 88.6
Acknowledgements. The author is grateful to NASA, University
of Maryland, USGS and NSIDC for provision of well documented data.
Edited by: A. Hofzumahaus
References
Armstrong, R. L., and Brodzik, M. J.: Northern Hemisphere EASE-Grid weekly snow cover and sea ice extent version 2, Boulder, CO, USA: National Snow and Ice Data Center, http://nsidc.org/ data/docs/daac/nsidc0046 nh ease snow seaice.gd.html, 2002. Arola, A., Kaurola, J., Koskinen, L., Tanskanen, A., Tikkanen, T.,
and Taalas, P.: A new approach to estimating the albedo for snow-covered surfaces in the satellite UV method, J. Geophys. Res., 108(D17), 4531, doi:10.1029/2003JD003492, 2003. Ch´yleck, P., Ramaswamy, V., and Srivastava, V.: Albedo of
soot-contaminated snow, J. Geophys. Res., 88, 10 837–10 843, 1983. Davidson, A. and Wang, S.; The effects of sampling resolution on
the surface albedos of dominant land cover types in the North American boreal region, Rem. Sens. Environ., 93, 211–224, 2004.
DeFries, R. S., Hansen, M., Townshend, J. R. G., and Sohlberg, R.: Global land cover classifications at 8km spatial resolution: the use of training data derived from Landsat imagery in decision tree classifiers, Int. J. Rem. Sens., 19(16), 3141–3168, 1998. Deg¨unther, Meerk¨otter, M., R., Albold, A., and Seckmeyer, G.:
Case study on the influence of inhomogeneous surface albedo on UV irradiance, Geophys. Res. Lett., 25, 3587–3590, 1998. Eck, T. F., Bhartia, P. K., Hwang, P. H., and Stowe, L. L.:
Reflec-tivity of Earth’s surface and clouds in ultraviolet from satellite observations, J. Geophys. Res., 92, 4287–4296, 1987.
Feister, U. and Grewe, R.: Spectral albedo measurements in the UV and visible region over different types of surfaces, Photochem. Photobiol., 62, 736–744, 1995.
Frei, A. and Robinson, D. A.: Northern Hemisphere snow extent: regional variablity 1972–1994, Int. J. Climatol., 19, 1535–1560, 1999.
Grenfell, T. C., Warren, S. G., and Mullen, P. C.: Reflection of solar radiation by the Antarctic snow surface at ultraviolet,
vis-2764 A. Tanskanen and T. Manninen: Effective UV surface albedo of seasonally snow-covered lands
ible, and near-infrared wavelengths, J. Geophys. Res., 99(D9), 18 669–18 684, 1994.
Herman, J. R. and Celarier, E. A.: Earth surface reflectivity clima-tology at 340–380 nm from TOMS data, J. Geophys. Res., 102, 28 003–28 011, 1997.
Koelemeijer, R. B. A., de Haan, J. F., and Stammes, P.: A database of spectral surface reflectivity in the range 335–772 nm de-rived from 5.5 years of GOME observations, J. Geophys. Res., 108(D2), 4070, doi:10.1029/2002JD002429, 2003.
Krotkov, N. A., Bhartia, P. K., Herman, J. R., Ahmad, Z., and Fi-oletov, V.: Satellite estimation of spectral surface UV irradiance 2: Effect of horizontally homogeneous clouds and snow, J. Geo-phys. Res., 106, 11 743–11 759, 2001.
Kylling, A., Person, T., Mayer, B., and Svenoe, T.: Determination of an effective spectral surface albedo from ground-based global and direct UV irradiance measurements, J. Geophys. Res., 105, 4949–4959, 2000.
Kylling, A. and Mayer, B.; Ultraviolet radiation in partly snow covered terrain: observations and three-dimensional simulations, Geophys. Res. Lett., 28, 3365–3368, 2001.
Laepple, T., Schultz, M. G. Lamarque, J. F., Madronich, S., Shet-ter, R. E., Lefer, B. L., and Atlas, E.: Improved albedo for-mulation for chemistry transport models based on satellite ob-servations and assimilated snow data and its impact on tro-pospheric photochemistry, J. Geophys. Res., 110, D11308, doi:10.1029/2004JD005463, 2005.
Lenoble, J.: Modeling of the influence of snow reflectance on ultra-violet irradiance for cloudless sky, Appl. Opt., 37, 2441–2447, 1998.
Lenoble, J.: Influence of the environment reflectance on the ultra-violer zenith radiance for cloudless sky, Appl. Opt., 39, 4247– 4254, 2000.
Lenoble, J., Kylling, A., and Smolskaia, I.: Impact of snow cover and topography on ultraviolet irradiance at the Alpine station of Briancon, J. Geophys. Res., 109, D16209, doi:10.1029/2004JD004523, 2004.
Martin, R. V., Chance, K., Jacob, D. J., Kurosu, T. P., Spurr, R. J. D., Bucsela, E., Gleason, J. F., Palmer, P. I., Bey, I., Fiore, A. M., Li, Q., Yantosca, R. M., and Koelemeijer, R. B. A.: An improved retrieval of tropospheric nitrogen dioxide from GOME, J. Geophys. Res., 107(D20), 4437, doi:10.1029/2001JD001027, 2002.
Matthews, E.: Global vegetation and land use: New high resolution databases for climate studies, J. Clim. Appl. Meteorol., 22, 474– 487, 1983.
McKenzie, R. L., Kotkamp, M., and Ireland, W.: Upwelling UV spectral irradiances and surface albedo measurements at Lauder, New Zealand, Geophys. Res. Lett., 23, 1757–1760, 1996.
Ricchiazzi, P. and Gautier, C.: Investigation on the effect of surface heterogeneity and topography on the radiation environment of Palmer station, Antarctica, with a hybrid 3-D radiative transfer model, J. Geophys. Res., 103, 6161–6176, 1998.
Ricchiazzi, P., Payton, A., Gautier, C.: A test of three-dimensional radiative transfer simulation using the radiance signatures and contrasts at a high latitude coastal site, J. Geophys. Res., 107, AAC 9-1–9-15, 2002.
Robinson, D. A. and Kukla, G.: Maximum surface albedo of sea-sonally snow-covered lands in the Northern Hemisphere, J. Clim. Appl. Meteorol., 24, 402–411, 1984.
Schmucki, D., Voigt, S., Philipona, R., Fr¨ohlich, C., Lenoble, J., Ohmura, A., and Wehrli, C.: Effective albedo derived from UV measurements in the Swiss Alps, J. Geophys. Res., 106, 5369– 5383, 2001.
Smolskaia, I., Masserot, D., Lenoble, J., Brogniez, C., and de La Casiniere, A.: Retrieval of the ultraviolet effective snow albedo during 1998 winter campaign in the French Alps, Appl. Opt., 42, 1583–1587, 2003.
Tanskanen, A., Arola, A., and Kujanp¨a¨a, J.: Use of the moving time-window technique to determine surface albedo from the TOMS reflectivity data, in: Proc. of SPIE Vol. 4896 Ultravio-let ground- and space-based measurements, models, and effects II, edited by: Gao, W., Herman, J. R., Shi, G., Shibasaki, K., and Slusser, J. R., 239–250, 2003.
Veefkind, J. P., de Leeuw, G., Stammes, P., and Koelemeijer, R. B. A.: Regional distributions of aerosols over land derived from ATSR-2 and GOME, Rem. Sens. Environ., 74, 377–386, 2000. Verdin, K. L. and Greenlee, S. K.: Development of continental scale
digital elevation models and extraction of hydrographic features. in: Proceedings, Third International Conference/Workshop on Integrating GIS and Environmental Modeling, Santa Fe, New Mexico, 21–26 January 1996, National Center for Geographic Information and Analysis, Santa Barbara, California, 1996. Warren, S. G. and Wiscombe, W. J.: A model for the spectral albedo
of snow. II: Snow containing atmospheric aerosols, J. Atmos. Sci., 37, 2734–2745, 1980.
Weihs, P., Lenoble, J., Blumthaler, M., Martin, T., Seckmeyer, G., Philipona, R., De la Casiniere, A., Sergent, C., Gr¨obner, J., Cabot, T., Masserot, D., Pichler, T., Pougatch, E., Rengarajan, G., Schmucki, D., and Simic, S.: Modeling the effect of an inho-mogeneous surface albedo on incident UV radiation in mountain-ous terrain: determination of an effective surface albedo, Geo-phys. Res. Lett., 28, 3111–3114, 2001.
Wiscombe, W. J. and Warren, S. G.: A model for the spectral albedo of snow. I: Pure snow, J. Atmos. Sci., 37, 2712–2733, 1980. Wuttke, S., Seckmeyer, G., and K¨onig-Langlo, G.: Measurements
of spectral albedo at Neumayer, Antarctica, Ann. Geophys., 24, 7–21, 2006,
http://www.ann-geophys.net/24/7/2006/.