Publisher’s version / Version de l'éditeur:
Proceedings of the 8th International Conference on Offshore Mechanics and
Arctic Engineering, 4, pp. 269-274, 1989-03-23
READ THESE TERMS AND CONDITIONS CAREFULLY BEFORE USING THIS WEBSITE. https://nrc-publications.canada.ca/eng/copyright
Vous avez des questions? Nous pouvons vous aider. Pour communiquer directement avec un auteur, consultez la première page de la revue dans laquelle son article a été publié afin de trouver ses coordonnées. Si vous n’arrivez pas à les repérer, communiquez avec nous à [email protected].
Questions? Contact the NRC Publications Archive team at
[email protected]. If you wish to email the authors directly, please see the first page of the publication for their contact information.
NRC Publications Archive
Archives des publications du CNRC
This publication could be one of several versions: author’s original, accepted manuscript or the publisher’s version. / La version de cette publication peut être l’une des suivantes : la version prépublication de l’auteur, la version acceptée du manuscrit ou la version de l’éditeur.
Access and use of this website and the material on it are subject to the Terms and Conditions set forth at
Model tests of load transmission through grounded ice rubble
Timco, G. W.; Sayed, M.; Frederking, Robert M (Bob)
https://publications-cnrc.canada.ca/fra/droits
L’accès à ce site Web et l’utilisation de son contenu sont assujettis aux conditions présentées dans le site
LISEZ CES CONDITIONS ATTENTIVEMENT AVANT D’UTILISER CE SITE WEB.
NRC Publications Record / Notice d'Archives des publications de CNRC:
https://nrc-publications.canada.ca/eng/view/object/?id=374146c4-273d-40fd-9b63-2ee84a99a43f
https://publications-cnrc.canada.ca/fra/voir/objet/?id=374146c4-273d-40fd-9b63-2ee84a99a43f
National
Research
Conseil
national
Id1
,n,,anacia
S e r
de
recherches Canada
I
THI
Institute for
lnstitut de
N21d
Researchin
recherche en
n
0 .1 6
04
Construction
construction
c .
2
BLDG
I
Model Tests of Load Transmission Through
Grounded Ice Rubble
by G.W. Timco, M. Sayed and R.M.W. Frederking
Reprinted from
Proceedings Eighth International Conference on
Offshore Mechanics and Arctic Engineering
The Hague, March 19-23, 1989
Volume IV, p. 269
-
274
(I RC Paper No. 1604)
N R C
-
CISTIL I B R A R Y
On a men6 une drie d'essais modi5les &in d'Ctudier la repartition des charges dans un
champ de fragments a n d s au sol nouvellement fom6.
Lors
des essais, m e section de
structure arctique
B
paroi verticale a ktd construite sur m e terrasse submergk.
La
structure
et la terrasse ont 6t6 &ui@es en appareils de mesure indkpendants de fagon
B
ce que puisse
Stre d6terminCe la &partition des charges entre la terrasse et la structure, dans le champ de
fragments. Les rksultats de ces essais sont importants pour la d6finition des charges de
calcul des structures arctiques construites sur les terrasses submergks.
The American Society of
Mechanical Engineers
Reprinted From
Eighth International Conference on Offshore
Mechanics and Arctic Engineering-Vol. 1V
Editors: N. K. Sinha, D. S. Sodhi, and J. S. Chung
Book No. 10285D- 1989
MODEL TESTS OF LOAD TRANSMISSION THROUGH
GROUNDED ICE RUBBLE
G. W. Timco, M. Sayed, and R. M. W. Frederking
National
Research
Council of Canada Ottawa, Ontario, CanadaABSTRACT A detailed review of load transmission
A model test series has been performed to look at the load distribution through newly-formed grounded ice rubble. In the tests, a section of a vertical-sided Arctic structure was built above a submerged berm. Both the structure and berm were instrumented independently of one another so that the load apportioning throu~h the rubble to the berm and
through grounded rubble was recently given by Sayed (1988). It suffices to mention here the field observations of Kry (1977), Frederking and Wright (1982), Croasdale (1985), and Sayed et al. (1986). An experimental study was also reported by Wards (1984), but because of differences in geometries, test set-up, etc., a direct comparison of results is not possible.
. .
structure could- be determined. The results have 2.0 EXPERIMENTAL important implications in the design loads of Arctic
structures built on submerged berms. The tests were conducted in the ice tank in
the Hydraulics Laboratory of the National Research
1.0 INTRODUCTION Council of Canada (NRC) in Ottawa. The tank is 21 m
When an ice sheet pushes against an Arctic structure, the ice usually breaks into small pieces locally in the region in front of the structure. This broken ice can accumulate, and in sufficient concentration can "ground" around the structure. This is particularly important for Arctic structures which are built on submerged berm foundations. This broken ice, or rubble, will act as a buffer between the intact ice sheet and the structure. Any further loading of the structure by the ice must be transmitted through the rubble. If the rubble is grounded on the berm, part of the load will be transmitted to the structure, and part to the berm. Because of many obvious difficulties in measuring this apportioning in the field, very little is known in this area (Sayed 1988). This, in spite of its importance in determining design loads on both the structure and the berm. In laboratory testing, many of the difficulties inherent in field work can be overcome. and some useful information can be obtained. In this paper, the test results of a study to measure load apportioning is presented. For this test program, the ice rubble is newly-formed, i.e. there is no re- consolidation of the rubble through refreezing. The results are compared to the rigid body/friction model - of grounded ice rubble.
Presented at the Eighth International Conference on Offshore Mechanics and Arctic Engineering
The Hague
-
March 19-23, 1989long by 7 m wide by 1.2 m deep. An 8-toAne carriage spans the width of the tank and provides a means of moving a structure relative to the ice at a uniform rate. The tank is housed in a large cold chamber and refrigerated model ice is used. In this test series, EG/AD/S model ice (Timco, 1986) was used. This model ice is grown from an aqueous solution containing three chemicals
-
ethylene glycol (EG), aliphatic detergent(AD) and sugar (S) and it well represents the mechanical properties of sea ice on a reduced scale.
The test arrangement to instrument fully the berm and structure independently of one another was challenging. This was even more so because the instrumentation was not waterproof nor submersible, so all of it had to be mounted above the water. Since it was necessary to measure relatively small changes in the load (sometimes with a large offset load), it was clear that the whole test frame must be very rigid, but light, so as to maintain a high natural frequency. Various schemes for this were contemplated. The test arrangement shown in Figures 1 and 2 was used. For measurement three separate six-component dynamometers and two tension/compression load cells were used.
influence the test results. To measure this, it was necessary to know the total applied horizontal load. Thus, a wooden "boom" was frozen into the ice sheet at the end of the tank. It was connected to two separate load cells ( # 4 and #5, Figure 2 ) and the ice was completely cleared behind it and along the side walls of the tank. By doing this, the sum of these two load cells gave the "far field" horizontal load at any time.
-
-1," -1Figure 1 : Side view of the experimental arrangement
' / / ',,
/
,'
,',,T~,,,~ Figure 3 : Photograph showing the experimental/ / , arrangement
Figure 2 : Plan view of the experimental arrangement Dynamometer #1 and #2 were of 2 kN capacity. They were each mounted on the bottom of separate b,rackets which were in turn mounted to the front face of the main carriage. From each of these dynamometers, a plywood-covered steel load-frame was mounted in the vertical plane. Each of these "backboards" formed one- half of the structure.
Between the brackets supporting dynamometers #1 and # 2 , another bracket was mounted to support a larger 8 IcN capacity dynamometer ( # 3 ) . From this dynamometer, a strong steel-tube "arm" ran behind the structure and supported the underwater berm. The latter was a steel frame to which plywood was bolted. A steel grid could be added to the berm to increase its roughness. Thus, using this arrangement, the total loads on both the structure and berm could be determined independently of one another. A photograph of the experimental arrangement is shown in Figure 3.
In order to gain more insight into the rubble building process, it was decided to conduct the majority of the tests using a two dimensional arrangement. For this, plexiglass sides were mounted on both sides of the structure/berm as shown in Figure
2. This allowed the use of a video camera to record the whole rubble-building process. Although the plexiglass was mounted to the carriage independent of both the structure and the berm, there was concern that there would be side-wall friction on the plexiglass which may
Once this whole arrangement was in place, the carriage was driven along the whole length of the tank at a constant speed (v) of 2 cm/s. The output from all of the instrumentation was sampled at a rate of 10 Hz, digitized and stored on magnetic disc for later analysis.
The sign convention shown in Figure 4 was adopted for the test. The positive direction for the horizontal load was in the direction of motion of the ice. The positive direction for the vertical load was in the upward direction.
Figure 4 : Schematic showing the sign convention used in the tests.
3.0 MEASUREMENTS
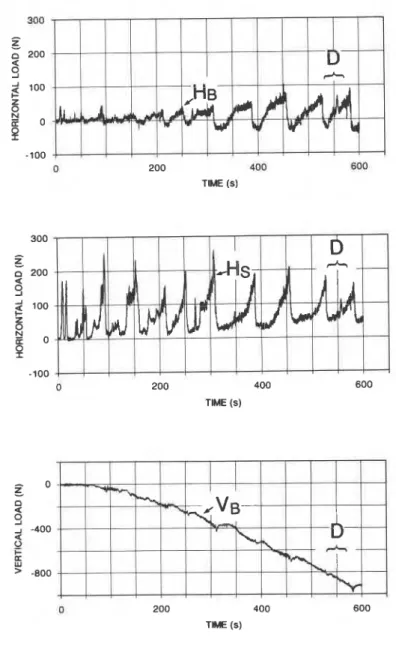
Tests were conducted using ice sheets of several thicknesses and strengths. Water depth andberm surface friction were varied as well. Thus, load apportioning was measured for a range of rubble geometries, berm friction, sail height, keel depth, and magnitude of ice force. The full test results are too lengthy to present here, but they may be found in Timco et a1 (1988). A summary of the test parameters discussed here is given in Table 1. A typical output of a test run which is presented in Figure 5 , shows the time records of the horizontal force on the berm HB, the horizontal force on the structure Hs and the vertical force on the berm VB. Note that since the carriage speed was constant, the abscissa of Figure 5 also represents the horizontally moved distance of the ice sheet with respect to the structure. Other force components and moments on the berm, the structure and the sidewalls were also measured but are not presented here since they do not directly influence the subsequent analysis. It suffices to mentionhere that the sidewall friction was always negligible.
T A B L E 1 TEST SET-UP
TEST ICE ICE WATER BERM
# STRENGTHTHICKNESS DEPTH SURFACE (kPa) (cm) (cm) 1 13 3.3 21 wire mesh 2 3 7 3.3 22 wood 4 10 3.3 2 1 wood 7 3 3 3.2 10 wood 10 41 3.1 22 wire mesh 11 37 3.2 22 wire mesh
As illustrated in Figure 5 , each test run consisted of several loading events. Loading starts when the floating ice sheet contacts the grounded rubble pileup. The ice sheet would then break in bending (upwards or downwards), buckling or it would slide over the pileup until it eventually broke through crushing or flexure. When the ice sheet failed, the load applied to the pileup was usually released abruptly. A typical development of a pileup profile is presented in Figure 6.
Although the applied force drops to zero, residual forces were often measured at the end of each loading event. Those forces were apparently exerted on the berm and the structure as the bulk rubble reacted to release of the pressure. Therefore, offsets for force measurements were chosen for each event according to the zero-load values recorded prior to floating ice contact.
200 400 600 TIME (s)
Figure 5 : Load time series for one full test run showing the horizontal force on the berm HB and structure Hs, and the vertical force on the berm VB. Loading event D is used in subsequent analysis in this paper
Figure 6 : Schematic showing the geometry of the rubble formation as a function of time for test #1 (time indicated in seconds)
4.0 LOAD APPORTIONING
Measured forces are used to calculate load apportioning (7) values given by
I
where HT is the total horizontal forceThe deformation of a grounded bulk rubble under floating ice forces appears to be very complex. There are no theories currently available that adequately describes the processes o f force transfer to the benn and structure. It may be intuitively expected, however, that load apportioning depends on a number of variables as follows:
where
L
is the rubbla pileup length, d is the keel depth, and p is the rubbleberm friction coefficient.A simple rnathod for estimating an upper limit for grounding resistance assumes that the rubble behaves 8s
a rigid block on a flat surface. The horizontal foree on the berm would be equal to the vertical force multiplied by a friction coefficient.
The friction coefficient p is usually assumed to be equal to tan 95, where
4
is the angle of internal friction of bulk rubble.The values of force apportioning q were calculated for each loading event. A typical plot of q versus time is shown in Figure 7. For chis same loading event, the ratio of horizontal to vertical loads on the berm is shown as a function of time in Figure 8.
The values of q always decreased with time, as the total force HT increased. It is expected that very small forces
y
would be entirely resisted by the berm, and therefore would be initially equal to I. Calculations were not performed for very small forces because of the inaccuracies of dividing by smallI
numbers. loading event progressed. The values of The value of reached a minimum as 0 represent the berm resistance for a given pileup geometry, horizontal force, and vertical force. It should be noted that the vertical force on the berm VB usually underwent some fluctuations during each loading event (as can be seen from Figure 5c).I
The ratio of horizontal to vertical forcesI
on the berm, which may be taken as a frictionI
coefficient, increasedwith time (Figure 8). This shows that the frictional resistance of the berm becomes1
gradually "mobilized" as the applied horizontal force increases. This result contradicts the simple assumtion of constant frictional resistance (equation 4) which is frequently used in the rigid body analysis of thfsI problem. The maximum values of the friction ratio p
!
(HB/V,) were of the order of 0.1 to 0.2. These values are considerably less than the often used values of friction of 0.47 (tan 25") to 1.4 (tan 55O).5.0 ANALYSIS AND DISCUSSION
Results from numerous loading events can be combined by considering that berm resistance (or q) should increase with increasing vertical load on the
Figure 7 : Time record of the force apportioning r)
-
HB/HT for loading event D in test #1 (Figure 5).
0.04
0
10
20
30
TIME
(s)
Figure 8 : Time record for the ratio of the vertical to horizontal forces on the berm (VB/HT) for loading event D in test #1 (Figure 5).
berm V,. Therefore, as an aid in analysis the values of VB were normalized with respect to the total horizontal force HT. The values of load apportioning are plotted versus VB/HT in Figure 9, for one loading event (event D, Figure 5). For small values of H, , the values of q were high (close to 1) and VB/HT approached infinity. As HT increased, however, both r) and VB/HT
decreased. The scatter in Figure 9, which is typical of most cases, is caused by fluctuations of measured forces.
Smooth curves, fitting results similar to those presented in Figure 9, are used to facilitate comparison of different loading cases. Results from tests conducted using a rough berm with L/d
-
4.5 are shown in Figure 10a. The curves marked A, B, C,.. .
indicate successive loading events during the same test run. The value of q clearly increases with successive loading events in each test, probably because the rubble pileup becomes more compact and increases in sail length (Figure 6). It is difficult, however, to accurately
measure the pileup length or to estimate rubble porosities during a test. The results presented in Figure 10a correspond to tests with ice sheets with three different flexural strengths varying from 13 kPa to 41 kPa (Table 1). The results show the range of possible values of I] but there is no strong trend of the
influence of the ice strength in these tests.
Figure 9 : Force apportioning I] versus the vertical to horizontal force ratio (VB/HT) for
loading event D in test #1 (Figure 5).
Apportioningvalues fromtests conductedusing a smooth wooden berm, and for L/d
-
4.5 and 9, are presented in Figure lob. Comparison of Figures 10a and lob shows that the rough berm gave higher values of I]than the smooth berm (for L/d
-
4.5). Although the results in Figure lob show that I] is somewhat larger with higher values of L/d, the data is insufficient to determine a relationship between I] and L/d.The simple method of the rigid body analogy can be used to give an estimate of grounding resistance (equation 4) to compare with the present results. For H T < HB*, all of the horizontal force is resisted by the berm, such that:
HT
<
HB* , I] = 1 (5a) For larger forces (HT>HB*), the load apportioning would be given byThe line representing equation (5) clearly gives much higher values for r] than the test results shown in
Figures 10a and lob.
t
-
EOUATION (5)-
-
-
--$
-
(a)
ROUGH BERM
I I t
-
EQUATION (5) WITH9
=25O-
-
-
(b)
SMOOTH BERM
I IFigure 10: Force apportioning I] versus vertical to horizontal force ratio (VB/HT) for (a) rough berm, L/d
-
4.5 and (b) smooth berm, L/d =The presentation of the data in the form shown in Figures 9 and 10 provides a new and useful perspective into the load apportioning problem. Complete information in this area could be used to calibrate analytical models, to provide insight into the load apportioning in field situations, and to aid in optimizing the design of a protective rubble field. The present tests provide some insight into this problem. Consider, for example, a typical situation of an actual rubble field in order to predict the range of values of
(V,/
4 ) .
At the start of a loading event at the edgeof the rubble, HT is small so (VB/HT) is high and the
load is transferred to the berm (7
-
1). Since V,remains essentially constant, the ratio (VB
/
HT)decreases as the force HT increases and a larger portion of the load is transfered to the structure. It should
be noted, however, that the value of (VB
/
HT) islimited to a minimum value which corresponds to the maximum possible ice driving force HT. For an average sail height of 7 m, keel depth of 15 m and rubble length of 100 m, VB would be approximately 3 MN/m. The minimum
value of (VB
/
HT) is limited by the floating force HT.Assuming a maximum ice driving force HT
-
1 MN/m(Croasdale 1986) the minimum (VB / HT) would be
approximately 3. Therefore, the present range of values
of (VB
/
HT) appears to be in agreement with expectedfull scale values. Based on the present test results,
a value of (VB / HT) of 3 , corresponds to load
apportioning ratios ranging from 0.3 to 0.5 (Figure
10a). This means that between 50% to 70% of the ice
force is transmitted to the structure. Note that the
rigid body/friction approach (equation (5)) greatly
overestimates berm resistance and gives 7 = 1 (i.e. all
of the ice force is resisted by the berm). The reader
is cautioned, however, that in actual field situations,
a large rubble field would be more complex than that
presented here. Many factors such as rubble
consolidation (refreezing), bermslope, irregular rubble
geometries and discontinuities in the rubble may influence the load transfer.
6.0 CONCLUSIONS
The experiments conducted in a model ice basin measured grounded rubble resistance to applied loads. Apportioning of floating ice forces between the berm and the structure was determined. The results show that very small horizontal forces exerted by floating ice are resisted primarily by the berm. As the applied force increases, it progressively exceeds the resistance of the berm and the load increases on the structure. The observed behaviour is at variance with that predictedby the r i g i d b o d y / f r i c t i o n m o d e l . The process of load transfer to the berm is much more complex.
The ratio of the horizontal force acting on
the berm to the total horizontal force (t)) was found to
decrease with decreasing ratio of the vertical force on the berm to the total horizontal force. Berm resistance
(or the ratio t)) also increased with increasing ratio
of pileup length to keel depth, and for larger berm surface friction. Estimates of the upper limit obtained
using the rigid body analogy (equation 4) were always
higher than the measurements.
The behaviour of rubble fields in nature can be more complex than the problems examined in the
present tests. Consolidation (or freezing) of bulk
rubble which occurs in the field may influence force apportioning. This aspect is currently being studied at NRC. The uncertainty regarding rubble properties in the field at various stages of consolidation makes
extrapolation of the results difficult. The present conclusions are suitable for predicting the general trends that may arise in the field and to corroborate calculation methods.
7.0 ACKNOWLEDGEMENTS
The authors would like to thank E.R. Funke
and L. Guertin for designing the test frame. Technical
assistance throughout this test program was provided by
R. Bowen, B. Cooke and M. Andrews. This project was
partially funded through the Panel on Energy Research and Development (PERD 6.2) through Public Works Canada (PWC) and the Canadian Oil and Gas Lands Adminstration (COGLA).
8.0 LIST OF SYMBOLS
horizontal force on the berm
limiting horizontal force on the berm (from
equation 4)
horizontal force on the structure
total horizontal force (- HB
+
Hs)vertical force on the berm
force apportioning (= H, / HT)
rubbleberm coefficient of friction angle of internal friction of bulk rubble 9.0 REFERENCES
Croasdale, K.R. 1985. "Ice investigations at a Beaufort
Sea caisson". A report by K.R. Croasdale
Associates Ltd., for the National Research Council of Canada and U.S. Department of the Interior Croasdale, K.R. 1986. "Arctic pack ice forces research
project 1986". by K.R. Croasdale and Assoc. Ltd,
and Arctec Canada. Report prepared for the
Government of Canada.
Kry, P.R. 1977. "Ice rubble fields in the vicinity of artificial islands". Proceedings of the Fourth International Conference on Port and Ocean Engineering under Arctic Conditions (POAC), St.
John's, Newfoundland, September, 1977, Vol. 2, p.
200-211.
Sayed, M. 1988. "Transmission of loads through grounded
ice rubble". Proceedings of the International Association for Hydraulic Research 9th Symposium
on Ice, Sapporo, Japan, August 23-27, Vol 2, pp.
692-707.
Sayed, M., Frederking, R.M.W. , and Croasdale, K.R. 1986.
"Ice stress measurements in a rubble field
surrounding a caisson-retained island". Ice
Technology, Proc
.
of the lst InternationalConference, Cambridge, Mass.. p. 255-262.
Timco, G. W. , 1986 "EG/AD/S : A new type of model ice for
refrigerated towing tanks" Cold Regions Sci. and Tech. 12, 175-195.
Timco, G.W., Sayed, M., Frederking, R. and Funke, E.R., 1988, "Tests Results of Load Transmission Through Ice Rubble", NRC/DME Laboratory Memorandum, LM-
HY-026, Ottawa, Ontario
Wards, R.D., 1984. "Ice rubble model tests 1980/81". Arctic Petroleum Operators Association Project No.177-1, available from Pallister Resource Management Ltd., 105-4116 64th Ave., S.E., Calgary, Alberta, Canada.


![Figure 10: Force apportioning I] versus vertical to horizontal force ratio (VB/HT) for (a) rough berm, L/d - 4.5 and (b) smooth berm, L/d =](https://thumb-eu.123doks.com/thumbv2/123doknet/14270892.490380/8.879.74.393.216.629/figure-force-apportioning-versus-vertical-horizontal-force-smooth.webp)
