Building Archetype Calibration for Effective
Urban Building Energy Modeling
by
Carlos Cerezo Davila
Master of Design Studies (Sustainable Design) Harvard University, 2013
Professional Bachelor and Master in Architecture Universidad de Sevilla, 2010
Submitted to the Department of Architecture
In Partial Fulfillment of the Requirements for the Degree of
Doctor of Philosophy in Architecture: Building Technology
at theMassachusetts Institute of Technology
June 2017Signature of Author:
0 2017 Massachusetts Institute of Technology. All rights reserved.
X1 Certified by: Accepted by:
A'
Signature redacted
Department of Architecture May 5, 2017ignature redacted
/
Signature
redacted
MASSACHUSETTS INSTITUTE OF TECHNOLOGYJUN 2
2
2017
&I Christoph F. Reinhart Associate Professor of Building Technology Thesis SupervisorChi Sheila Kennedy
Thesis Committee
Prof. Christoph Reinhart Associate Professor of Building Technology Department of Architecture, MIT Committee Chair
Prof. Roy Welsch Professor of Statistics and Engineering Systems Sloan School of Management, MIT Committee Member
Prof. Paul Ruyssevelt Professor of Energy and Building Performance University College London Committee Member
Building Archetype Calibration for Effective Urban
Building Energy Modeling
by Carlos Cerezo Davila
Submitted to the Department of Architecture on May 5, 2017
in Partial Fulfillment of the Requirements for the Degree of Doctor of Philosophy in Architecture: Building Technology
Abstract
In response to the current environmental challenges, city governments worldwide are developing action plans to both reduce GHG emissions and increase the resilience of their built environment. Given the relevance of energy use in buildings, such plans introduce a variety of efficiency and supply planning strategies ranging from the scale of buildings, to full districts. Their implementation requires information about current building energy demands, and how these demands, and the city's energy ecosystem at large, may change as a result of a specific urban intervention. Unfortunately, metered data is not available at a sufficient level of detail, and cities face an "information gap" between the aggregate scale of their emission targets, and the scale of implementation of energy strategies. To close it, municipalities and other interested stakeholders require modeling tools that provide accurate spatially and temporally defined energy demands by building. Urban Building Energy Models (UBEMs) have been proposed in research as a bottom-up, physics based, urban modeling technique, to estimate energy demands by building for current conditions and future scenarios. Given the large number of data inputs required in their generation, UBEMs have relied on their characterization through "building archetypes". Yet, in the absence of detailed building and energy data, this process has remained somewhat arbitrary, relying on deterministic assumptions and the subjective judgement of the modeler. The resulting simplification can potentially lead to predictions that misrepresent urban demands and misinform decision makers.
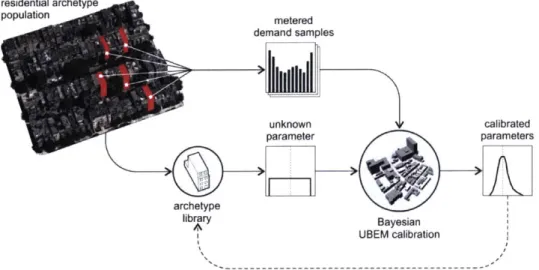
In order to address these limitations and enable the large scale application of UBEMs, this dissertation introduces a set of modeling and calibration techniques. First, in order to demonstrate the feasibility of citywide municipal UBEMs, an 80,000 buildings model is generated and simulated for the city of Boston, based exclusively on currently available and maintained municipal datasets. An automated modeling workflow and a new library file format for archetypes are developed for that purpose, and current limitations of municipal datasets and practices are identified. To improve the reliability of UBEMs in reproducing metered demands, a new calibration approach is proposed, which applies principles of Bayesian statistics to reduce the uncertainty in archetype parameters defined stochastically based on a sample of metered buildings. The method is demonstrated and validated in the model of a residential district in Kuwait with 323 annually metered buildings, showing errors below 5% in the mean and 15% in the variance when compared with the measured EUI distribution. The accuracy of the resulting UBEM when reproducing EUI distributions is also compared with typical deterministic approaches, resulting in an error improvement of 30-40%. The method is expanded for its application when monthly energy data is available, and applied for the calibration of a sample including 2,662 residential buildings in Cambridge, MA. Finally, the relevance of calibrated archetype-based UBEMs in urban decisions is discussed from the perspectives of policy makers, energy providers, urban designers and real estate owners in two application cases in neighborhoods of Kuwait City and Boston.
Thesis Supervisor: Christoph F. Reinhart
Acknowledgements
First and foremost, I wish to thank my advisor Professor Christoph Reinhart. I have had the immense pleasure to work with him both in my Masters at Harvard and my PhD at MIT, and through these six years he has become not only an advisor, but also a mentor and a friend. Since the very beginning of this academic journey he has been supportive of my work and incredibly generous with his time. Everything I know now about scientific research and about how to bring an intellectual vision to life I owe to him. I am deeply thankful and hope to continue our collaboration and engaging conversations over coffee in the future. I would also like to thank the members of my dissertation committee. Prof. Welsch's advice regarding statistical methods was instrumental for this dissertation. Prof. Ruyssevelt's vision for the concept of energy epidemiology inspired some key ideas behind it, and I deeply appreciate their help.
I am extremely grateful for the Raab family's support, and honored to have been selected by the
Department of Architecture at MIT as the recipient of their scholarship: the Raab Family Education Fund Award. Beyond that, my research work was funded by the Kuwaiti Foundation for the Advancement of Science (KFAS), and the Massachusetts Clean Energy Center (MassCEC), to which I am immensely thankful. I sincerely enjoyed these years at MIT, and I am very grateful to the institute's community and to the Building Technology Program in particular. BT is the most complete department that an architecture school could ask for, and its faculty, staff and students have been a close support group for me during my doctorate. Prof. John Ochsendorf has supported me always, offering his advice and inspirational attitude, and reminding me to aspire to "change the world". Professors Norford, Glicksman and Fernandez have often offered critical and wise comments, and Prof. Caitlin Mueller has become an example for the professor I would like to become. Finally, I wish to thank Kathleen Ross for taking care of me in every way and making BT run smoothly, Renee Caso for her administrative help in navigating the system, and Phil Thompson for being there day and night, ready to help. From my time at the University of Sevilla, I also want to thank Professors Juanjo Sendra and Ricardo Alario who sparked in me the hunger for learning better and more about architecture, and coming to the United States.
During my time at MIT I have met great friends whose support I also need to acknowledge. All energy modeling developed in this work would have not been possible without the previous research contributions by my colleagues and friends Timur Dogan and Cody Rose, with whom I now hope to embark into further professional adventures. My research in modeling Boston, presented in chapter 3, would have not been possible without the help of Jamie Bemis and Travis Patrick. Similarly, the effective modeling of Kuwaiti neighborhoods in chapter 4 benefited immensely from the local knowledge of Saud Alkhaled, Adil AlMumin and Ali Hajiah. I want to very especially thank Julia Sokol whose collaboration was instrumental for the Cambridge study in chapter 5, and whose bright insights inspired some of the key ideas behind this work. I would also like to thank all current and previous members of the Sustainable Design Lab at MIT (and previously at Harvard): Alstan, Holly, Debashree, Krista, Jeff, Manos, Irmak, Nathaniel, Aiko, Shreshth, Ali, Jamie and Alpha. It was a great fortune working along your side, and I cherish the remarkable memories we share. Very special thanks to Tarek Rakha for his generosity and advice, and to Diego Ibarra for many great conversations. I am also grateful to all my friends at BT and
GSD: Arta, Tom, Ale, Alonso, Bruno, Catherine, Nathan, Madeleine and Arfa. Very especial thanks as
well to David Blum, friend and inspiration, and best desk neighbor one can ask for.
On a personal level, I want to thank all my Cambridge friends, and very especially Amaia Puras, Ana Garcia and Javier Ors, who have become my family on this side on the Atlantic. And most importantly I want to thank my beloved Irene Figueroa, partner in crime and life companion. I am grateful for all we share together and for your unparalleled love. Last, I am eternally grateful for the lifelong unconditional love and support of my mother Carolina, my father Jose Luis and my sister Carolina, who from Spain, push me every day to become better, and to whom I ultimately dedicate this work.
Table of Contents
1 Introduction...13
1.1 The problem of m odeling urban building energy use ... 15
1.2 Research hypotheses ... 17
1.3 D issertation overview ... 18
2 U rban scale building energy m odeling ... 19
2.1 Top-down vs bottom -up building stock m odeling ... 20
2.2 Overview of Building Energy M odeling (BEM )... 21
2.3 U rban Building Energy M odeling (UBEM ) ... 23
2.3.1 D ata input processing... 23
2.3.2 Archetype m odeling...26
2.3.3 Therm al sim ulation m ethods and tools ... 30
2.3.4 M odel accuracy and validation... 33
2.4 Conclusions... 34
2.5 Sum m ary ... 35
3 Feasibility and lim itations of citywide UBEM ... 37
3.1 Introduction... 38
3.2 M ethodology ... 39
3.2.1 D ata availability and m odel characterization... 39
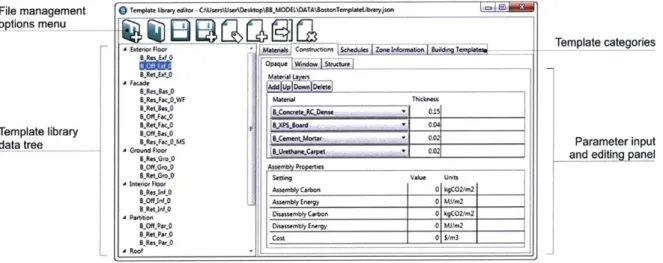
3.2.2 N ew text file form at for archetype tem plates ... 46
3.2.3 A Toolset for UBEM generation... 49
3.2.4 M odel Sim ulation and Processing ... 51
3.3 Results...51
3.3.1 U BEM data processing ... 51
3.3.2 Results comparison to CBECS/RBECS and zip code total energy use ... 54
3.3.3 Spatial and hourly load profiles... 54
3.3.5 Effort level and data lim itations... 57
3.4 D iscussion ... 58
3.4.1 M odel feasibility and energy data... 59
3.4.2 Barriers for im plem entation... 60
4 Bayesian approach for U BEM archetype calibration...63
4.1 Introduction...64
4.1.1 Stochastic archetype param eters and occupant behavior... 64
4.1.2 Energy m odel calibration in BEM and UBEM ... 65
4.2 M ethodology ... 67
4.2.1 A Bayesian approach to archetype calibration... 67
4.2.2 Kuw aiti case study ... 71
4.2.3 Archetype characterization ... 74
4.2.4 UBEM sim ulation and sam pling w orkflow ... 78
4.2.5 Com parison and validation of characterization m ethods ... 79
4.3 Results... 80
4.3.1 Bayesian calibration results ... 80
4.3.2 Com parison of A rea 8 results by characterization case ... 81
4.3.3 V alidation of the m ethod in A rea 9/1 ... 83
4.4 D iscussion ... 85
4.4.1 Selection of stochastic archetype param eters ... 85
4.4.2 Archetype sam pling for validation... 86
4.4.3 Energy data resolution and accessibility ... 87
4.5 Sum m ary ... 88
5 A rchetype calibration to m onthly energy data... 89
5.1 Introduction... 90
5.2 M ethodology ... 91
5.2.1 Cam bridge case study...91
5.2.2 M odeling iterations for m onthly analysis ... 94
5.2.4 A rchetype classification and characterization ... 95
5.2.5 M onthly calibration m ethodology... 97
5.2.6 M odel sim ulation and evaluation... 99
5.3 Results... 100
5.3.1 Analysis of available energy data ... 100
5.3.2 Effect of energy data availability on parameter distributions ... 101
5.3.3 M odel accuracy by m odeling iterations ... 102
5.3.4 M odel validation after calibration... 105
5.4 D iscussion ... 106
5.4.2 Hybrid m odeling with statistical m ethods ... 108
5.5 Sum m ary ... 109
6 Applications in energy policy and design...110
6.1 Introduction... 111
6.2 M ethodology ... 112
6.2.1 Stakeholder perspectives and application fram ework... 113
6.2.2 CA SE 1 -Energy pricing policy in Kuwait ... 115
6.2.3 CA SE 2 -Energy efficient urban design in Boston ... 118
6.3 Results... 121
6.3.1 Savings by scenario in CASE 1(Kuwait)... 122
6.3.2 Energy m etrics by proposal in CASE 2 (Boston)... 126
6.4 Discussion ... 129
6.5 Sum m ary ... 132
7 Conclusions and outlook...133
7.1 Conclusions... 134
7.1.1 Sum m ary of contributions ... 134
7.1.1 Scope and lim itations... 136
7.2 Research outlook... 137
7.2.1 M odeling hourly dem ands ... 137
7.2.2 Big data accessibility for live UBEM ... 138
7.2.3 Building perform ance regulation and com pliance ... 140
8 References ... 143
Dissertation references...143
Publications written in the context of this dissertation ... 153
Chapter 1
Introduction
Cities are both the most vibrant productive human creations and one of the main sources of global environmental impacts, a reality which is only going to become more acute as time progresses. The United Nations estimates that the number of city-dwellers worldwide will grow until 2050 at a net rate of
about five million per month, largely via informal settlements and haphazard densification [1]. As a result, urban-related greenhouse gas (GHG) emissions are at an all-time high, with energy consumption in buildings being a key contributor, accounting for 22% of emissions in the United States and for almost a third globally [2]. Unless current emission rates are dramatically reduced, city populations will experience
unmanageable climate change consequences, including increases in temperature and extreme weather events [3]. An example of such episodes was storm Sandy, which hit the North East of the United States in 2012, leaving without power large sections of downtown Manhattan (Figure 1-1). These changes will heighten the stress on the existing urban energy infrastructure, resulting in energy access limitations and more frequent power outages [4], especially harmful for informal or underserved communities.
In response to these global environmental challenges, city governments worldwide are developing action plans that set ambitious long term emission reduction targets such as 30%, 40% and 60% reductions by 2025 (New York, San Francisco and London) or 80% by 2050 [5-7]. Given the relevance of energy use in buildings, municipalities are introducing a variety of energy efficiency and supply planning strategies ranging from the scale of buildings, to that of neighborhoods and districts. The former involves policies for retrofitting existing building envelopes or equipment, and for ensuring that new construction follows modern performance standards. The latter measures comprise a variety of initiatives, being tackled by both cities and energy providers, including distributed generation, power storage, and district systems, which require the effective management and optimization of energy demands.
Figure 1-2: NYC after Sandy storm (Iwan Baan 2012)
While these strategies point in the general direction of a better energy future, both in terms of GHG emission mitigation and resiliency of urban energy systems, their practical implementation requires a dialogue between municipalities and other relevant stakeholders (building designers, real estate owners, utility companies, energy generators, etc.) over specific urban interventions. All parties involved in an energy related decision need to know which specific buildings and neighborhoods will be affected, what their current energy consumption is, and how that demand will change in the future should that decision be made. That conversation is not possible in the absence of current building energy demand data, and the understanding of how this demand, and the city's energy ecosystem at large, may change as a result of a potential intervention. Regarding existing buildings, energy consumption is routinely measured by utilities for billing purposes at annual or monthly timescales, and the increasing use of "smart metering" in buildings (45% electricity customers in the US) [8] is making demand data available at lower temporal scales. However, this information is rarely available for urban decision makers due to privacy and legal concerns, and their access is limited to anonymized and aggregated datasets, which are not sufficient for informing building-related urban strategies. While recent mandatory programs for energy disclosure in large cities like Boston or New York [9,10] are addressing these limitations, they typically only target large commercial or city owned buildings. The difficulty is even larger in the case of energy planning for new urban developments or future conditions, since building demands need to be modelled based on limited available information. As a result of the lack of access to detailed building energy data, cities face an "information gap" between the aggregate scale of their emission reduction targets, and the scale at which urban strategies need to be evaluated and implemented (Figure 1-2).
-30%
-15%
-42%
AGGREGATE DETAILED
ENERGY TARGETS ENERGY STRATEGIES
Figure 1-2 - The energy information gap
In addition to climate related policies, this gap also limits the capability of local governments to deal with issues of fuel poverty, weather vulnerability, and power grid resiliency which need to be addressed simultaneously. To close it, municipalities and other interested stakeholders require modeling tools that provide realistic spatially and temporally defined energy demands by building. Furthermore, such tools need to be based on currently available and actively maintained urban databases so they can be effectively implemented in practice.
1.1 The problem of modeling urban building energy use
Over the last decades, the problem of predicting or estimating the energy demands of buildings has been addressed at two very different scales: The building stock analysis level, of interest for policy makers, and the individual building design level relevant in architecture and engineering. To understand building energy demand patterns within cities, different types of modelling techniques inherited from stock analysis methods have been proposed over time, falling in two main categories: "top-down" or "bottom-up" models [11]. "Top-down" models link aggregate energy use to statistical variables, such as population trends and economic activities [12], but are not well suited for the analysis of small spatial and temporal units. "Bottom up" models on the other hand, apply statistical or "engineering" analytical methods to represent each building individually [13] and offer a more appropriate scale of analysis for urban decision making. However, by definition they require large datasets of metered building demand data, and do not offer enough flexibility to model detailed urban development or future technology scenarios. To address the shortcomings of existing large scale techniques, Urban Building Energy Modeling (UBEMs) is a new simulation technique that has been [14] proposed as a hybrid approach that combines bottom-up stock modeling with physics based simulation methods. Within an UBEM each building is represented as a thermal model, based on the same heat transfer principles that govern individual building energy models (BEM) [15].
BEMs are part of the established field of computer-based building performance simulation (BPS), and are applied in architecture for design development, code-compliance and improved operation of individual buildings. They can be generated and simulated through available tools such as EnergyPlus, ESP-r or TRNSYS [16-18], and provide outputs ranging from heating and cooling needs to indoor thermal conditions based on a variety of information about the building ranging from construction and usage patterns to surrounding climate. Being based on the same modeling approach, a calibrated UBEM can - in principal - be used by urban planners and policy-makers to evaluate current and future energy demands, with high spatial and temporal detail, as long as sufficient information about the buildings and their operation is provided. UBEM results can then be combined with mapping techniques to support energy certification and fuel poverty policies [19,20], or with power grid distribution models to evaluate the dynamic performance of urban energy systems [21]. As with BEMs, the generation of an UBEM requires the definition of numerous data inputs for both the building geometry and a large set of non-geometric energy related parameters (constructions, systems, usage patterns, loads, etc.). However, the established processes of model setup for individual buildings cannot be applied directly at the urban scale due to larger model sizes and lower data availability, requiring the use of various abstraction and simplification techniques. Multiple methods have been introduced for both the generation of building geometry from GIS or LIDAR datasets as well as their transformation into simplified thermal models with reasonable simulation times [22].
The remaining parameters however (such as number of occupants or level of insulation) represent a much larger modelling challenge, since municipalities typically store very limited data about their building stock, and building usage and operation details are necessarily unknown at this scale. Borrowing from bottom-up stock modeling practices, UBEM research has so far relied on the characterization of these parameters through "archetypes". An archetype is an average representation of a group of buildings with similar use, vintage, etc., used to define the whole group [23,24]. Yet, in the absence of detailed building and energy data, this process has remained somewhat arbitrary in UBEM research, relying on preexisting deterministic assumptions and the subjective judgement of the modeler about the correct values for model parameters. The resulting simplification can potentially lead to predictions that misrepresent urban demands and misinform decision makers. In individual building energy modelling, similar parameter uncertainty problems are typically solved through calibration techniques based on metered energy demand data [25,26]. Equivalent methods could be applied to UBEM, but very little research has focused on understanding how much accuracy could be achieved and how much building and energy data is required given its limited accessibility at this scale. This dissertation seeks to address the feasibility and accuracy of archetype-based UBEMs, in order to understand their potential to support urban decision making regarding energy demand and supply strategies for buildings.
1.2 Research hypotheses
The overall goal of this dissertation is to improve existing urban building energy modeling workflows to the point at which they can become decision support tools for those entities involved in the development and implementation of urban energy scenarios, from municipal governments, urban designers and utilities to the general public. Given the potential of these tools to provide actionable information to urban stakeholders as well as the challenges surrounding availability and access to data this work particularly focuses on the leadership role municipalities when it comes to collecting complete datasets of their jurisdictions and applying derived information for urban policy decisions.
Based on the shortcomings of existing methods described above, this translates into a more specific research goal: to develop a methodology for the generation of calibrated archetype-based UBEM
models, using building and energy data sources currently accessible at the urban scale. This larger
goal translates into the following three research hypotheses which will be addressed throughout this manuscript and revisited in the concluding chapter 7.
Feasibility (Chapter 3)
It is possible to generate and simulate a citywide UBEM and a library of building archetypes using available municipal urban datasets.
Reliability (Chapters 4-5)
Building archetype parameters can be calibrated by combining thermal simulation with Bayesian statistics, based on a subset of buildings for which metered energy demands are available.
The resulting calibrated UBEM can reliably reproduce building energy use intensity (EUI) distributions throughout a neighborhood, with more accuracy than a typical deterministic model.
The time resolution of the measured dataset determines the resolution at which the derived UBEM can provide reliable predictions.
Relevance (Chapter 6)
A calibrated archetype-based UBEM can be used in the analysis of policy and design scenarios, to
1.3 Dissertation overview
This dissertation presents the development of a methodology for the generation and calibration of archetype-based UBEM models, and their validation through modeling case studies in Boston, Kuwait, and Cambridge, of varying scale and context. Chapter ] has provided a brief overview of the scope of this work and its motivation, focusing on the relevance of urban energy modeling in current municipal energy planning. Chapter 2 introduces the nascent field of Urban Building Energy Modeling (UBEM) to the reader in the context of exiting modeling techniques. A literature review of required data inputs, available tools and case studies is developed and current limitations for archetype-based UBEMs are identified.
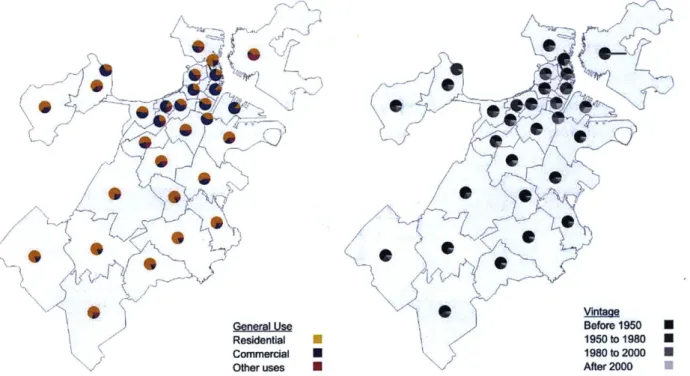
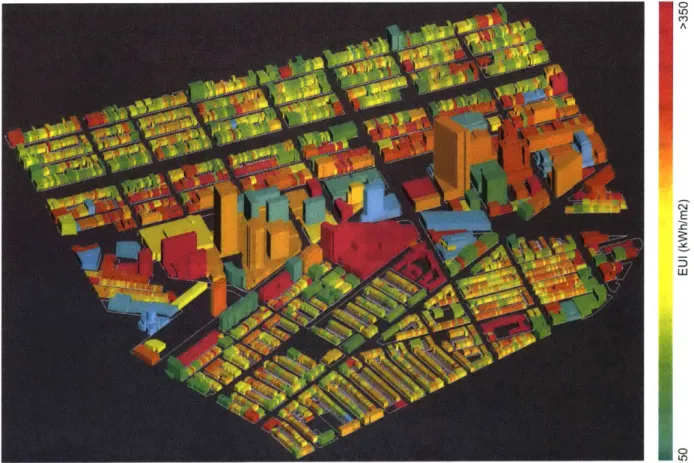
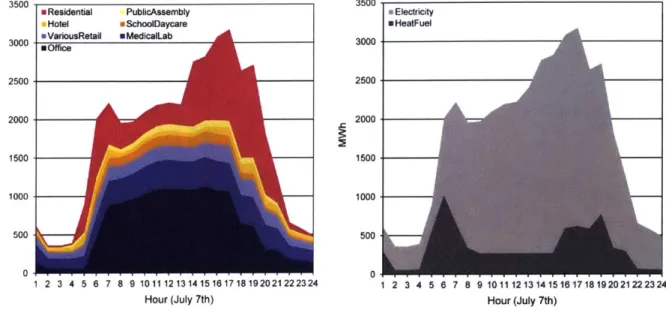
Chapter 3 introduces a workflow for the generation and simulation of UBEMs, based on urban datasets for buildings that are widely available for medium to larger US cities. As a case study, the workflow is used to generate a citywide model for the City of Boston in collaboration with the local planning department. Based on the case study, current limitations and barriers to the widespread use of these models are identified.
Chapters 4 and 5 focus on the accuracy achieved through the use of uncalibrated and calibrated archetypes in UBEM. In Chapter 4, a Bayesian calibration approach for building archetype parameters is proposed and validated by comparing UBEM simulation results with annual metered data for a residential district tin Kuwait City. The effectiveness of the Bayesian approach to model EUI distributions is compared with that of two typical deterministic modeling approaches. In Chapter 5, the problem of calibration at lower temporal scales is discussed, and an expansion to the method is proposed if monthly measured energy use is available. The Bayesian approach is applied for monthly load analysis through the case study of residential archetypes in Cambridge, MA.
Chapter 6 finally concentrates on the added value created with a calibrated UBEM, when applied in the analysis of future urban energy scenarios. Two example case studies are developed, based on the calibration results of previous chapters. Using the district UBEM created for Kuwait, three efficiency strategies and two electricity pricing scenarios are evaluated from the perspectives of a municipal energy planner, an energy provider and a policy maker. Next, two design proposals for a new residential neighborhood in Boston are compared in terms of total energy use and compliance with a local performance requirement, from the perspectives of an urban design team and a local planner.
The above three hypothesis are revisited in Chapter 7 followed by a critical discussion of the advances made throughout this document as well as an outlook section that proposes concrete data and model management and implementation guidelines for municipalities interested in the use of bottom up urban building energy modeling to support their energy policy and planning efforts.
Chapter 2
Urban scale building energy modeling
The following chapter reviews the current state of the art of the nascent field of Urban Building Energy Modeling (UBEM). This particular approach is introduced in the larger context of energy modeling techniques, applied to large building stocks and individual buildings. UBEM data requirements and main current modeling workflows are reviewed thoroughly, and the "archetype" approach is discussed in detail. Model accuracy limitations are described in relation with archetype characterization methods, and a lack of validation and calibration studies is identified as a major gap in literature for the
integration of UBEM in urban energy planning and decision making.
Elements of this chapter have been published in the Building and Environment Journal:
Reinhart CF, Cerezo Davila C (2016). Urban building energy modeling: A review of a nascent field Building and Environment 97:196-202.
2.1 Top-down vs bottom-up building stock modeling
As discussed in Chapter 1, municipalities and interested urban stakeholders need to better understand not only which sectors and buildings are responsible for current demands, but also what future effects comprehensive energy retrofitting programs and energy supply infrastructure changes might have. Over the last decades, the problem of predicting or estimating the energy demands of buildings has been addressed at two very different scales: The building stock analysis level, of interest for policy makers, and the individual building design level, relevant in architecture and engineering. Traditionally, urban energy models have inherited most concepts and techniques from the former. In that context, and to understand spatiotemporal energy demand patterns due to buildings, different types of urban modelling techniques have been proposed over time, which fall into two main classification categories (Figure 2-1): "top-down" or "bottom-up" models [11,27]. TOP UP STATISTICS BASED PHYSICS BASED
UBEM
DOWN BOTTOMFigure 2-1: Top-down vs bottom-up energy modeling methods
The more general "top-down" models link aggregate urban energy use at the national, regional or urban scale to statistical variables, such as population trends and economic activities [12]. While useful for the understanding of larger existing stocks, they necessarily extrapolate from the status quo and are less suitable for the analysis of future energy supply-demand scenarios, where energy demands need to be characterized at the scale of the district or neighborhood. At this meta-scale, ranging from several dozens to thousands of buildings, "bottom-up" modeling techniques are better prepared to inform decision makers [13], and have been applied at national and urban scales in the past. "Bottom up" models apply statistical and/or "engineering" analytical methods to estimate the energy demands of each building individually.
Statistical models correlate available high level building parameters such as vintage, use type or size with individual building metered demand via regression models [28,29]. They are particularly "robust" when reproducing current individual building demands, since they are based on metered data and thus able to accurately incorporate occupant behavior, something notoriously difficult to accomplish in analytical models [30]. However, statistical models require large datasets of metered energy use, which are rarely available to modelers other than as annual data, and are unable to estimate lower temporal scales or forecast the impact of new technologies. To address these shortcomings, bottom-up "'engineering" or "physics-based" models have been proposed where the demands of a building are estimated based on its specific properties (geometry, materials, systems, etc.) through analytical principle-based models [31].
Urban Building Energy Models (UBEM) [14] have been introduced as a more sophisticated family of engineering models, by applying performance simulation methods to represent each building as a dynamic thermal model, based on the same principles that govern individual building energy models (BEM) [15]. This relatively young field brings together the stock methods discussed so far with those of building performance simulation (BPS) used in architecture and engineering. UBEMs offer high flexibility to consider combinations of building technologies in future scenarios, and hence can be used by urban planners and policy-makers to evaluate impacts of potential retrofits or new construction, or to compare energy supply alternatives. Furthermore, they can be combined with grid models to evaluate the dynamic hourly performance of urban energy systems [32]. Although UBEMs are the focus of this dissertation, the same bottom-up simulation approach has been recently applied to the analysis of other urban sustainable performance criteria including material impacts [33], daylight access [34] or human mobility [35], as part of the field defined by Perez and Robinson as urban "micro simulation" [36].
2.2
Overview of Building Energy Modeling (BEM)
The basic approach of UBEM is to apply physical models of heat and mass flows in and around buildings to predict operational energy use. At the individual building level, such heat flows are well understood, and Building Energy Models (BEMs) are already widely used in many parts of the world for design, code-compliance and improved operation [15,37]. The purpose of BEMs, which belong to the larger field of Building Performance Simulation (BPS), is to simulate the effects of the environment in the indoor conditions of a space, due to envelope transmission loses, infiltration, ventilation and solar gains. Internal heat flows generated by occupants, lighting and equipment are also taken into account. Based on those BEM tools one can either estimate resulting changes in temperature and humidity in the space, or calculate the heating/cooling loads necessary to achieve a heat balance in which certain comfort conditions are maintained.
Since both the external climate and the internal conditions of a space change dynamically with time, significant research efforts have gone into the development of simulation algorithms capable of capturing their interactions, starting with the introduction in the late 60s of the "thermal response factor" method for modeling single rooms [38]. A first generation of "dynamic" BEM engines emerged in the seventies and eighties to overcome the shortcomings of early steady-state single room heat balance models. They applied computational heat transfer methods such as response functions or finite-difference methods to model the impacts of thermal mass in room temperatures. The eighties and nineties saw the integration of diverse, isolated modeling methods into the first whole building modeling tools. Multiple simulation engines have been introduced since, such as TRNSYS [18], ESP-r [17], DOE-2 [39], EnergyPlus [40] and
IES-VE [41]. They have been validated against measurements in several example applications [40,42]
and ANSI/ASHSRAE standards are in place to ensure their continued reliability [43]. An overview that contrasts the differences between them is given by Crawley et al [44]. Nowadays in the United States, BEM simulation is applied for energy code compliance following guidelines from the American Society of Heating Refrigerating and Air Conditioning Engineers (ASHRAE), through its Standards 90.1-2013 and 189.1-2011 [45,46]. Similarly, it is required for the fulfillment of energy-related credits in sustainability certification schemes such as LEED in the US [47] or BREEAM in the UK [48], where it is also used to show compliance with local building regulations.
In order to streamline the use of BEM engines in these scenarios, a variety of graphical user interfaces (GUIs) have become commercially available as part of modeling software packages such as DesignBuilder [49] or OpenStudio [50], simplifying the generation of multi-zone models. In a traditional usage case for these tools, an expert energy modeler is provided with building geometry, constructions, HVAC and internal loads data, as well as usage schedules for a building project. The level of available information is commensurate with the design stage of the project as building and occupant data is typically provided by the design or engineering team involved, sometimes requiring the modeler to make educated guesses for those parameters yet unknown. The modeler then enters the available information into the software in combination with weather data, a mostly manual, time consuming and costly process
[51], and runs the simulation. More recently however, plug-in GUIs such as Archsim [52] or HoneyBee [53] have been developed to incorporate BEM into generic CAD modeling environments, making them
accessible to architects and other non-expert users. This new approach to BEM tools, combined with the efforts of the American Institute of Architects (AIA) to actively promote the use of energy simulation in early design [54], has changed the traditional roles of architects and engineers in building performance design (BPD). New research questions are being explored as a result, regarding the effective integration of BEM in interdisciplinary workflows [55] and the education of non-experts users [56].
While the above outlined BEM process can in principle be applied to any new building to improve the energy efficiency of the built environment, the extent to which these methods are applied in practice is still low. To put it in perspective, while every year in the US between 80,000 and 100,000 new buildings are constructed, as of February 2017 there were only around 34,000 LEED certified. In that context, to become globally relevant, affordable, and reach a larger audience, the BEM field is shifting its focus towards the urban realm with the development of UBEM modeling.
2.3
Urban Building Energy Modeling (UBEM)
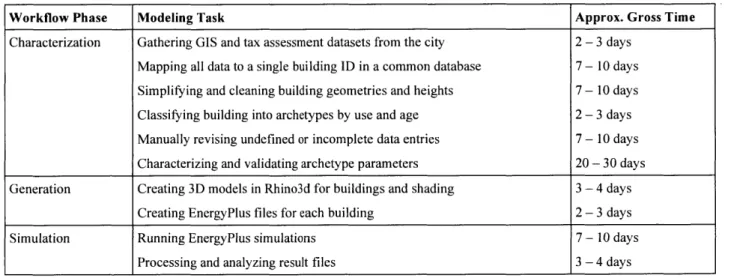
Bottom-up building energy simulation models, or UBEMs, reduce the dependence. that statistical methods have on metered energy demand data, but increase the amount of necessary building information, hence introducing new modeling requirements. Since complete sets of building construction and usage information need to be generated and simulated for potentially thousands of buildings, conventional BEM approaches would become unacceptably resource intensive and impossible to manage. Therefore, in order to make UBEM an effective tool, a reconceptualization and automation of existing workflows is required. As documented in the review paper by the author covered in this chapter, a host of new methods had to be developed over the past decade in research to assemble and manage the enormous amount of data required to generate and ran an UBEM within a reasonable time frame [14]. These methods can be generally broken into the following subtasks: (1) Gathering and processing of data inputs, (2) generation and simulation of thermal models, and (3) result analysis and validation. The following sections explore in detail existing sources for each modeling step.
2.3.1 Data input processing
An UBEM requires the combination of numerous datasets in order to characterize three main sets of inputs, shared by single building energy models (Figure 2-2): Weather information, buildings geometry, and non-geometric model parameters (Including data about constructions, systems, users, etc.). Climate datasets for building performance simulation have been available for a number of years following the initial establishment of a standard data format, the typical meteorological year (TMY) [57,58], and the subsequent provision of data available in this format for multiple regions worldwide (US-DOE EPW Data. URL: energyplus.net/weather). TMY files contain hourly measured environmental variables for a given site such as solar radiation, dry bulb temperature, relative humidity, or wind speed and direction. Apart from improving the world-wide coverage of these datasets, researchers have recently been exploring methods of how to model local microclimatic phenomena within cities such as the urban heat island effect (UHI) [59]. For the City of London, Mavrogianni et al coupled locally measured temperature profiles with a UBEM in order to study the impact of the UHI effect on building energy use and resident
health [60]. Predicting local wind patterns [61] and linking IPCC climate change predictions to current day TMYs [62] are equally active areas of research with direct implications for UBEM. Although better modeling capabilities for urban microclimates are required, currently available data sources are sufficient for the analysis of annual or monthly demands in typical weather conditions, and accessible worldwide. Regarding building geometry data, an UBEM requires, as a minimum, 3D building shapes or "massings", information about the amount of fagade openings, and terrain elevations when relevant. Depending on whether an existing or a new district is the subject of investigation, this information can either be
extracted from available datasets or generated from scratch as part of an urban planning/design process.
MATERIALS & CONST WEATHER GEOMETRY CONDITIONING --.... V --..O SYSTEMS PROFILES NON GEOMETRIC E BUILDING + OCCUPANT --- --- ' PARAMETERS
IM7 ENGINE
Figure 2-2: Data inputs in UBEM modeling
In the first scenario, a variety of urban sources with increasing level of detail have become available over time. Traditionally, two dimensional CAD files have been produced by municipal planning departments to document building footprints. Over the past decades, similar geometric data has been stored through city-wide Geographic Information System (GIS) databases, which have not only become commonplace in many regions of the world but are also increasingly accessible to the general public. GIS shape files can additionally store measured building and terrain height values, and be used to automatically generate the simplest form of massing through extrusion (Figure 2-3a), commonly referred to as a "2.5D" model [63]. Increasingly available LIDAR based datasets for cities, can allow for an even higher definition in building envelopes, capable of including smaller features such as sloped roofs or multi-height volumes [64], but at an increased processing cost. Finally, data formats such as CityGML offer yet a higher level of detail by combining complex 3D building models with a connected database
In the case of urban design projects, 3D models with similar characteristics are routinely generated through CAD tools such as Rhinceros3D [70] or SketchUp [71], as shown in the example in Figure 2-3d which depicts an early proposal for Boston's Innovation District (Boston BPDA 2010). As far as the simulation process is concerned, geometric inputs are therefore identical for existing and new neighborhoods, and can be obtained with a justifiable effort level. Of all geometric inputs, fagade openings are typically the hardest to model for existing neighborhoods, since municipalities do not collect data about their position and size, or even the ratio of the fagade area they occupy, commonly referred to as a Window to Wall Ratio (WWR). To address this limitation, current research efforts are focused on developing methods for the automated identification of building openings from aerial or street photography through computational image processing methods [72].
*LO12 LoD
LOD 10
444
Figure 2-3: GIS based 2.5D massing model (a), LIDAR based urban model (b), CityGML building LOD 3 model (c), and urban design massing proposal for the Boston BPDA (d)
A third component, non-geometric model parameters have to be characterized as well, including
material and construction information, HVAC systems' properties and operation regimes, and a long list of occupant related parameters. In a single building BEM, this step routinely takes about a third of the time spent preparing and creating a model [51] and constitutes one of the main sources of errors due to the unavoidable uncertainty regarding infiltration rates, usage schedules, occupancy rates, etc. [46]. While these quantities can be measured for a small group of existing buildings, such detailed data collection efforts become impractical for larger urban areas, and their characterization represents one of the largest
low
challenges in UBEM. The most common solution to the lack of building data for all such parameters is the use of "building archetypes" i.e. average representations of a population of buildings assumed to share similar properties [23]. In their definition, buildings are usually classified based on properties such as age or use type, and then characterized according to representative parameter values for that group. As further described in the following section, developing this procedure can be very difficult given the natural complexity of the building stock in a city. The built environment is heterogeneous, and full buildings can rarely be described by single use categories, since they often accommodate multiple activities distributed in independently owned premises, which can be grouped in multiple ways for the purposes of energy metering. This is especially true for non-residential and mixed use building typologies. Similarly, uses within a building change through time dynamically, and a single structure can include multiple additions or renovations corresponding to different periods, which would require constantly revisiting its archetype definition. For these and other reasons, the use of archetypes necessarily influences the overall accuracy of the resulting model, as well as its ability to predict the impact of urban interventions or policies. Yet, it remains somewhat arbitrary and deterministic, relying on the subjective judgement of the modeler.
2.3.2 Archetype modeling
As introduced above, building archetypes in UBEM are a simplification tool for assigning non-geometric simulation parameters to individual building models. This approach has been extensively used in the context of national or regional bottom up building stock models to understand the aggregated impact of energy efficiency policies [31] and new technologies [23]. The still ongoing European project
TABULA, in which 13 EU member countries defined relevant national residential archetypes according
to climatic zone, vintage and building shape, is the most complete and relevant example of this application [73]. However, such national databases are rarely available for the variety of building types and level of detail required in urban modelling archetypes, and their generation and validation process still remains one the most undefined steps in UBEM. The definition of a set of archetypes is typically developed in two steps: Classification and Characterization. In previous urban modeling research, these steps have been developed to the extent that available data sources allowed.
Archetype Classification
In classification (Or segmentation), buildings are grouped according to one or more indicators which need to be: First, correlated to the energy demand of the building (e.g. building use as an indicator can convey when it is occupied) and second, available for all buildings. This second condition typically limits the number of indicators since few energy variables are documented throughout a city's building stock. The indicators most often used to classify buildings into archetypes are programmatic use (e.g. residential, office, retail, etc.), floor area, shape typology and age of the construction [24,30,74-81].
These four indicators are readily available in most municipalities as part of property datasets, but fail to capture the complexity of the building stock especially in the case of mixed-use buildings, in which the floor area dedicated to specific uses is rarely available. Smaller spatial classification scales have been proposed to represent sections of one or multiple buildings with one or more distinct uses such as the Self Contained Unit (SCU) [82], which can be used to better align the model with the real spatial configuration or distribution of energy meters. Additional indicators have been proposed to complement these, such as household demographics [83], heating system [77] or window to wall ratio (WWR) [72].
Table 2-1:'Number of buildings and archetypes in published studies
Scale of # Bldgs.* Use Type Classification # Archs. Characterization Bldg./Arch. Ref.
Application Parameters Method Ratio
Urban (Osaka) 1,128 Residential Shape/Area 20 Virtual 56 [83]
Urban (Houston) ** Mixed Shape/Age/Use/System 30 Virtual ** [79]
Urban (London) 267,000 Residential Shape/Age 144 Virtual 1854 [30]
Urban (Carugate) 1,320 Residential Age 7 Sample 189 [23]
Urban (Milan) ** Mixed Shape/Age/Use 56 Virtual ** [74]
Urban (Rotterdam) 300,000 Residential Shape/Age 26 Virtual 11,538 [75]
200 12 17
Urbanocveral US 200,000 Mixed Shape/Age/Use/System 17 Virtual 1,6 [81]
15,000 25 600
Urban (Basel) 20,802 Mixed Shape/Age/Use 20 Virtual 1040 [85] National (UK) 115,751 Residential Shape/Age 47 Virtual 2463 [31]
National (Italy) 11,226,595 Residential Shape/Age/Climate 96 Sample 116,943 [24] National (Greece) 2,514,161 Residential Shape/Age/Climate 24 Sample 104,716 176]
National (Greece) 2,514,161 Mixed Shape/Age/Use/System 5 Virtual 502,832 [86]
National (Italy) 877,144 Residential Shape/Age/Climate/System 3168 Virtual 277 [78]
National (Ireland) 40,000 Residential Constructions/Thermal 13 Virtual 3078 [84] Regional (Sicily) 171,000 Residential Shape/Age/Climate 84 Virtual 2036 [77]
National 14,916,600 92 162,137
(Franc Spain, Residential Shape/Age/Climate/System Sample & Virtual [87]
(Frane, Spain 18,040,000 122 147:869
Germany, UK) 20,496000 252 81,333
National (Finland) 36,000 Mixed Age/Use 12 Sample 3000 [80]
* Number of buildings to be represented by archetypes. ** Number of buildings not available in the study.
Measured energy demand by individual building, for sufficiently representative sections of the urban stock, can significantly improve the classification process, helping identify statistically those indicators with the strongest correlation [28,84] or clarify their meaning. For example, Aksoezen et al. [85] used measured gas consumption data from 1,356 meters to test the common assumption that building age is a good classification indicator since the older the building the higher its demand for heating. The authors showed that in fact, buildings constructed in the period of 1921 to 1979 used more gas than those built before or after. Unfortunately, UBEM modelers do not usually have access to sufficient measured energy demand for individual buildings, and there is no way to validate the effectiveness of the chosen
classification indicators. As a result, no consistent relationship between the size of an UBEM and the number of archetypes developed has been so far established. Classification indicators and number of
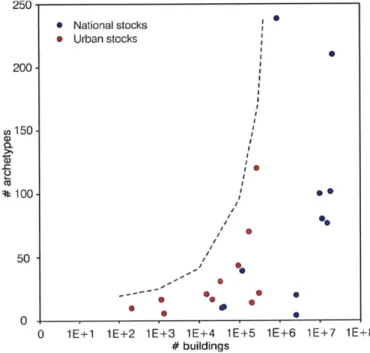
archetypes are typically chosen based on already existing categories, and complex situations such as mixed-use buildings or structures with multiple additions, which cannot be described through simple indicators, are usually excluded from the model. The extensive review of published building stock modeling efforts by the author showed that [14], depending on the scale of application and indicators chosen, an archetype may represent 50 to 500,000 buildings (Table 2-1, Figure 2-4).
250 * National stocks * Urban stocks 0 200- 150-o II *100-50 , 0 0
0 1E+1 1E+2 1E+3 1E+4 1E+5 1E+6 1E+7 1E+8 # buildings
Figure 2-4: Ratio between number of buildings and archetypes in reviewed studies Archetype Characterization
Once all buildings in an urban model have been classified, each resulting archetype has to be characterized for all relevant energy simulation parameters. These are all non-geometric building and occupant factors which influence energy demand, including envelope construction details, HVAC system properties, occupancy schedules, internal loads, etc. The exact set of parameters to be defined depends on the UBEM simulation tool, the thermal modelling approach (steady state vs dynamic) and the model zoning simplification (single zone vs multi zone) [14]. For a given parameter combination however, defining their values in an urban modeling setting is a particularly complicated task. The most common approach is to characterize archetype parameters in a deterministic way (i.e. a single value assigned to each parameter and used for every building). This can be achieved either by assigning to the archetype the characteristics of an audited real building belonging to it, or of an average virtual building [24]. Table 2-1 shows the selected approach for a variety of published modeling studies.
Both approaches have the limitation that, even if the archetypical building correctly represents the mean or the median of all buildings in its group, individual buildings will perform differently. For example, two "midsize offices from the 1980s" will have distinct working hours or glazing types which are unknown to the modeler. Archetype descriptions that use solely deterministic parameters are thus intrinsically unable of reproducing the diversity of demands found within the population they represent. Therefore, to account for this variety and for the modeler's uncertainty regarding specific buildings, they can also be characterized in a probabilistic way, using distributions [68]. The use of uncertainty modelling techniques to deal with unknown parameters has been extensively addressed in BEM for retrofit and design purposes [88,89]. However, it remains unclear how to effectively apply these methods at the urban level, where they are limited by the lack of parameter data and the high computational cost of simulation. For that reason, most existing UBEMs have so far relied on deterministic characterization, at a detail level commensurate with available data sources. What are these sources?
In the simplest case, values used to characterize archetype parameters can be extracted from literature data, such as national building surveys, building codes and standards, and research literature. In the United States for example, the largest databases of energy related building characteristics are the Commercial and Residential Buildings Energy Consumption Surveys (CBECS/RBECS) published by the
US Energy Information Administration [90,91]. They have been used for the definition of urban
archetypes [79,92] in combination with current and historic ASHRAE energy efficiency standards [45] and reference building models published by the US Department of Energy [93]. Similar resources can be found in most countries, and in Italy for example, Caputo et al. [74] divided both residential and commercial buildings in Milan, into 56 archetypes, characterized using the Italian National Census. Although literature sources are a valid starting point, sometimes more granular building data is available which can provide characteristics of individual buildings within the urban area being modelled. This requires the modeling team to audit or survey a sample of buildings for selected archetypes [23,81], or to work in collaboration with local companies or institutions which may have performed them in the past
[30]. In large enough samples, building audit data can also serve as a basis for a probabilistic
characterization, providing empirical distributions for parameters. Unfortunately, given the cost and labor required to develop building by building surveys, such datasets are uncommon and limited in coverage. The introduction of mandatory building Energy Performance Certificates (EPCs) in the European Union [94] has been proposed as a potential solution to the problem [95], but no equivalent initiative is currently underway in the United States. Hence, the question remains, what might be an effective way to introduce probabilistic archetype parameters in large scale UBEMs?
2.3.3 Thermal simulation methods and tools
Once climate data, building geometry and archetype templates are available, they need to be combined into a thermal model, and divided in zones than can be analyzed in a simulation engine. Previously published UBEM workflows mainly differ in the type of simulation, the detail of thermal zoning used, as well as whether the effect of surrounding buildings is taken into account (Table 2-2). A
number of these workflows are described in the following, going from low to increasingly higher complexity. In the simplest case, an UBEM consists of single zone, steady state heat balance models of a sample building for each archetype. Simulation results are scaled up to the ensemble level by multiplying them with either the number of buildings per archetype [31] or a floor area-weighted function of that number [23]. This modeling approach ignores that the urban context and specific shape of a building can significantly affect its performance e.g. through shading, local wind patterns, etc.
To consider shading as well as building compactness the SIMSTADT tool in combination with the
INSEL simulation engine applies a single-zone steady state model to each building separately
[66,68,69,96]. While steady-state methods are generally known to reliably predict heating loads, dynamic
thermal simulation engines such as EnergyPlus [16,40] and DOE2 [39] are preferable for locations with notable cooling needs, or where hourly demands are especially relevant. Mata and Caputo accordingly used context-less single zone dynamic models to analyze archetypes in France, Germany, Italy, Spain and the UK [74,87]. Last, for investigations of detailed urban design choices, multi-zone dynamic thermal models may become necessary, which can capture demand variations resulting from different solar exposures. In practice, this requires converting a massing model into a network of volumetric thermal zones. Same as for single zone models, multi-zone models can either be generated for sample buildings only [19,75,79] or for each building individually so that solar shading can be considered as well [97].
Table 2-2: Thermal modeling methods
Type of Thermal Model Type of Simulation Context Modeling References
Single Zone Steady State No [23,31]
Single Zone Steady State Yes [63,67,96]
Single Zone Dynamic No [87]
Single Zone Dynamic Yes [98]
Multi Zone Dynamic No [19,79,99]
Multi Zone Dynamic Yes [97,99-102]
While simple steady state simulation models for several thousand buildings can be executed in a matter of an hour on a standard laptop, the simulation time for equivalent dynamic multi-zone models may take days, even when parallel or cloud computing resources are available. In addition, building
floorplans are not available to modelers at an urban scale. For both reasons, massings in a multi-zone
UBEM need to be simplified depending on acceptable simulation times and purpose of the model (Figure
2-5). In the simplest case, each floor of a building can be treated as a zone, to capture vertical solar
exposure variations in a dense urban context [92]. To further capture the impacts of orientation and building depth, building floors can be divided into core and perimeter thermal zones, as recommended by ASHRAE 90.1 Appendix G [45]. To apply this operation to any geometric form, Dogan et al [103] developed an "autozoner" algorithm which automatically generates ASHRAE 90.1 compliant models from massings. While effective, the core and perimeter approach can result in an excessive number of simulations for a neighborhood or district. To maintain accuracy while reducing the number of simulations, less resource intensive approaches have been recently proposed such as integrating reduced order models [104], aggregating internal zones into thermal mass elements [105], clustering building envelope zones with similar exposure conditions into shoebox models [22] and others [106]. When choosing a simplification, floorplan typologies can become relevant, since core and perimeter schemes can misrepresent the thermal behavior of real spaces with errors up to 70% [107].
ASingle building zone B Single zone per floor CASHRAE 90.1 DShoeboxer zone
Core and perimeter abstraction method
Figure 2-5: Thermal zoning approaches for 3D massings in UBEM
The processes of integration of data inputs, execution of the simulation itself, and communication of results back to the user, have been implemented in the past with varying levels of automation. In most cases the developers combined export/import capabilities of exiting tools such as GIS and BIM as well as custom scripts to generate a thermal model, execute the simulations and present them via spreadsheets or
GIS applications [19,23,30,75,99]. A few groups further automated and streamlined the simulation
workflows to incorporate additional urban performance metrics and make UBEM accessible to urban designers and planners: SUNTOOL [102] and the CITYSIM [100] are examples that combine a custom
GUI with newly developed thermal simulation engines. While data inputs are manually defined
CITYSIM, SIMSTADT for example can automatically read a CityGML database [68,69,96]. In a further step in user interface development, the Urban Modeling Interface (UMI) developed at MIT works as a plug-in for the CAD modeling software Rhino, which allows developing parametric 3D urban models,