arXiv:0805.2781v1 [cond-mat.mtrl-sci] 19 May 2008
Tetrahedral clustering in molten lithium under pressure
Isaac Tamblyn1
, Jean-Yves Raty2
, and Stanimir A. Bonev1∗
1
Department of Physics, Dalhousie University, Halifax, NS, B3H 3J5, Canada 2
FNRS-University of Liege, Sart-Tilman 4000, Belgium (Dated: May 19, 2008)
A series of electronic and structural transitions are predicted in molten lithium from first prin-ciples. A new phase with tetrahedral local order characteristic of sp3
bonded materials and poor electrical conductivity is found at pressures above 150 GPa and temperatures as high as 1000 K. Despite the lack of covalent bonding, weakly bound tetrahedral clusters with finite lifetimes are predicted to exist. The stabilization of this phase in lithium involves a unique mechanism of strong electron localization in interstitial regions and interactions among core electrons. The calculations provide evidence for anomalous melting above 20 GPa, with a melting temperature decreasing below 300 K, and point towards the existence of novel low-symmetry crystalline phases.
PACS numbers: 62.50.-p,61.20.Ja,64.70.dj,71.22.+i
The properties of materials under high pressure can change in profound and unexpected ways. At ambient pressure (P ) and temperature (T ), Li can be regarded as the prototype for an ideal metal. However, theoretical studies [1] have predicted that as a result of increased core-valence electron interactions, low-T dense solid Li would undergo a series of symmetry-breaking transitions,
culminating in a Li2-paired crystal with semi-metallic
properties at pressures above 150 GPa. Besides the regu-lar transition at 7.5 GPa from body-centered cubic (bcc) to face-centered cubic (f cc) structure [2], measurements to date [3] have confirmed only an initial transition at 39 GPa from fcc to a less compact structure with a 16-atom cubic cell (cI16 space group) via an intermediate disordered phase (hR1). The existence and properties of even lower-coordinated structures at higher pressures remains an open question due to the lack of experimen-tal data and difficulties associated with conclusive the-oretical predictions of low-temperature thermodynamic crystalline stability.
It was shown recently [4] that solid-solid transitions in Na are preceded by analogous changes in its liquid but at much lower pressure. Similar behavior was also sug-gested for other light alkalis. This raises the intriguing question, answered in what follows, of whether the ex-istence of low-symmetry structures in Li [1, 3, 5, 6, 7] could be established by investigating its molten phase. Molecular dynamics simulations of liquids have the ad-vantage of depending minimally on initial conditions and are not subject to the inherent bias of comparing a finite number of solid configurations. Finding low-coordinated structures in molecular dynamics simulations of a liquid, in addition to being remarkable in itself, would therefore constitute rather conclusive evidence for the existence of similar crystalline phases.
We have carried out first principles molecular dynamics (FPMD) simulation of liquid Li in the density range
cor-responding to 3.06 > rs> 1.60 (where
4 3π(rsa0)
3
= V /N ,
a0is the Bohr radius, V the volume and N the number of
valence electrons) at temperatures up to 3000 K, and of the known crystalline phases: bcc, f cc, and cI16, between 0 and 90 GPa. Density functional theory with a plane wave basis set and the Born-Oppenheimer approximation were used for all simulations [8]. They were performed in the N V T ensemble with cubic supercells and periodic boundary conditions. For the simulations of bcc and cI16 solids, and all liquids we used 128 atom supercells with Γ-point sampling of the Brillouin zone. Simulations of the f cc solids were performed with 108 atoms and 8 k-points (the Γ-point only was found to be insufficient). Most simulations ran for at least 10 ps, with some up to 20 ps, while for obtaining the melting temperatures we have computations as long as 200 ps. Extensive convergence tests were carried out for size effects, various simulation parameters, and the validity of the pseudopotential ap-proximation [9]. Good agreement was also obtained with existing liquid experimental data [10].
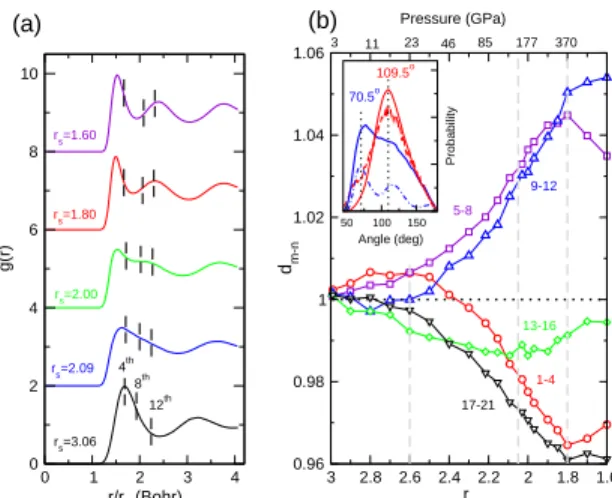
Results for the structural analysis of the liquid along a 1000 K isotherm are presented in Fig. 1. Initially, the first peak of the pair correlation function, g(r), broad-ens (Fig. 1(a)) in a way previously observed in Na [4]. Upon further compression, it splits entirely, indicating significant further lowering in the coordination. For a more detailed analysis of the structure, we examine the evolution of neighbor distances with increasing density (Fig. 1(b)). While there is no indication for discontinuous liquid-liquid transitions, several distinct regions with dif-ferent liquid structures can be identified, which correlate well with the electronic and melting properties discussed
further below. These are: (i) rs &2.60 (P < 23 GPa);
(ii) 2.60 & rs & 2.05 (23 GPa < P < 150 GPa); and
(iii) rs . 2.05 (P > 150 GPa). The initial changes are
analogous to those observed in liquid Na [4] - a transition from a bcc-like to an f cc-like local order in (i), followed in (ii) by lowering in the coordination (number of neighbors under the symmetrized first peak of g(r)) to 8 + 4 + . . ., and the liquid acquiring a cI16-like local order.
neigh-0 1 2 3 4 r/rs (Bohr) 0 2 4 6 8 10 g(r) rs=3.06 rs=2.09 rs=2.00 rs=1.80 rs=1.60 4th 8th 12th (a) (b) 1.6 1.8 2 2.2 2.4 2.6 2.8 3 rs 0.96 0.98 1 1.02 1.04 1.06 dm-n Pressure (GPa) 3 11 23 46 85 177 370 5-8 9-12 1-4 13-16 17-21 50 100 150 Angle (deg) Probability 109.5o 70.5o
FIG. 1: Structural changes in molten Li along the 1000 K isotherm. (a) Pair correlation function, g(r), for selected den-sities. Vertical dashed lines indicate the average positions of the 4th
, 8th
, and 12th
neighbors. (b) Evolution of density-rescaled average interatomic distances with pressure and den-sity. First, average interatomic distances are computed to the first (r1), second (r2), and so on, neighbors. Next, density-rescaled distances are calculated as di = (ri/rs)/(r
0 i/r 0 s), where r0 s= 3.06 and r 0
i refers to distances obtained at r 0 s. Fi-nally, dm−n is the averaged value of di for neighbors, i, from m to n. The corresponding values of m and n are indicated next to each curve. The inset shows bond angle distributions between the first two neighbors in molten Li (solid curves) for rs = 3.06 (blue) and 1.80 (red), of solid bcc Li (dashed blue
line) at 500 K and rs = 3.06, and of molten diamond [11]
around 250 GPa (dashed red curve). Angles among nearest neighbors in ideal bcc (70.50o
) and diamond (109.50o
) crys-tals are indicated. The bcc data are scaled by a factor of 1/3 relative to the other angle distributions.
bors 1-4 continue to contract even faster, while the next
eight, as well as 13-16, move away. As a result, by
rs = 1.80 (P ∼ 370 GPa), the first coordination shell
completely splits in two, the coordination becomes only
four and remains roughly so up to at least rs = 1.6
(P ∼ 810 GPa). The distribution of angles among the nearest neighbors also becomes rather unexpected (inset
in Fig. 1(b)) as it has a peak at 109.5o
. The parallel
with the liquids of materials with sp3
bonding is indeed striking when compared to the corresponding angle dis-tribution in molten carbon, obtained by melting diamond at similar pressure (inset in Fig. 1(b)). Therefore, there is a large pressure range, 150 GPa < P < 810 GPa, for which we predict that Li has tetrahedral local order, hitherto not seen in a liquid metal, but characteristic of
semiconductor liquids with sp3
bonding.
The apparent structural similarity with covalently bonded liquids has prompted us to investigate the persis-tence probability of Li clusters. For this purpose, we
eval-uate a function Pn(t), which gives the statistical
proba-bility for the first (n−1) nearest neighbours found around an atom at time t to be the same as those found at time
0 2 4 6 8 10 12 14 n 0 0.1 0.2 0.3 0.4 0.5 Pn (t) HS rs=1.6 rs=3.06 rs=1.6 rs=1.8 rs=2.0 rs=2.22 0 5 10 n 0 0.1 0.2 0.3 0.4 0.5 Pn (t) rs=1.8 1000K 2000K 3000K
FIG. 2: Survival probability, Pn(t), of clusters as a function of their size, n. Results are shown for Li and for a hard sphere (HS) liquid. The times at which the Pn(t)’s are evaluated are: 43 fs (for rs= 3.06), 27 fs (rs= 2.22), 20 fs (rs= 2.00), 15 fs (rs= 1.80) and 12 fs (rs= 1.60) for Li, and 20 fs for the HS liquid. The HS radius is chosen such that the self-diffusion constant and the short-distance g(r)’s of the HS and Li liq-uids are roughly the same. Computations with HS’s at lower densities show rapidly decreasing values of Pn(t); already an
order of magnitude lower at rs = 2.0. The inset shows
sur-vival probability of clusters as a function of temperature at rs= 1.80.
t = 0. For completely uncorrelated particles, Pn(t) would
drop monotonically with increasing n for any fixed t. This is a result of the fact that the larger the cluster the more particles there are that can leave the cluster during
any time interval. For the same reason, Pn(t) should be
a decreasing function of n for a sufficiently large t even if there is some weak binding among the atoms. For exam-ple, if p is the average probability for a given particle to leave a cluster during a time interval t, then the survivor
probability of that cluster is Pn(t) ∼ (1 − p)(n − 1) for
large t (and neglecting particles re-entering the cluster). In order to study cases with weak metastability, the
time chosen for the evaluation of Pn(t) should be
suffi-ciently short such that results are non-trivial. The values
of t at which we have evaluated Pn(t) for each density are
listed in the caption of Fig. 2. The ratios among them are roughly equal to the ratios of the periods of atomic vi-brations at different densities, which have been estimated from a velocity autocorrelation analysis. This allows us to quantitatively compare the metastability of clusters for a range of densities, over which diffusion rates and vibrational properties differ significantly. As shown in
Fig. 2, Pn(t) changes qualitatively when density is
in-creased. The appearance of a peak at n = 5 is evi-dence for a weak metastability of the tetrahedral clusters. To estimate the importance of caging effects [12], which could appear in a compressed liquid, we have also carried out simulations of hard-sphere liquids. The comparison
with Li (Fig. 2) demonstrates that the peak in Pn(t) of
inter--6 -4 -2 0 E - EF (eV) 0 4 8 12
DOS (states / Ha.electron)
(a) 3.06 2.60 2.22 2.03 1.90 1.80 1.60 1.6 2 2.4 2.8 3.2 rs 0 1 2 3 4 5 6 7
Valence bandwidth (eV)
p-DOS bandwidth (b) 0 2 4 6 8 10 12 Core p-DOS (%) rs = 2.05 150 GPa rs = 2.6 23 GPa 0 100 200 300 400 Pressure (GPa) 104 σ ( Ω .cm) -1 rs 2.6 2.05 1.8 2 x10³ (c) ref. 14 this work, 1000 K this work, 3000 K ref. 13, 900-1300 K ref. 13, 1800-2800 K
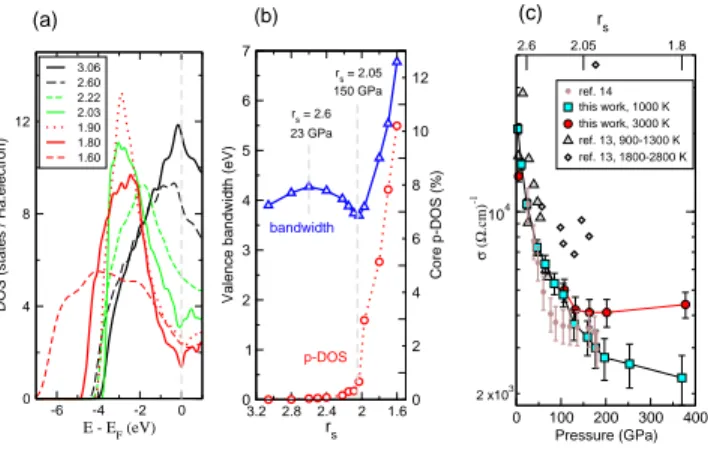
FIG. 3: Electronic properties of dense molten Li. (a)
Elec-tronic density of states, DOS. The corresponding rs
val-ues for each density are listed in the legend. (b) Valence electron bandwidth (blue triangles) and integrated DOS of core electrons with p angular momentum character, p-DOS (red circles). (c) Calculated dc conductivity, σ, along the
1000 K and 3000 K isotherms. Error bars are statistical
standard deviations. Comparison is made with experimen-tal measurements[14, 15]. The data from [14] are divided into two sets, representing two temperature intervals. Only quali-tative comparison is meaningful with [14] as a model equation of state has been used there to obtain Li density, T , and σ.
atomic correlations.
We now examine the changes in the electronic prop-erties that are likely to drive the structural transitions. With increasing density, the DOS at the Fermi level grad-ually decreases ( Fig. 3(a)). A similar effect, interpreted as a Peierls symmetry breaking, was observed in liquid Na [4], except that its strength in Li is stronger, which can be understood in terms of an increasing hardness of the effective repulsive potential; it is similar, for ex-ample, to the decreased amplitude of the distortion in crystalline Sb in comparison to crystalline As [13]. To interpret these changes and their likely consequences, we first look at the valence electron bandwidth (Fig. 3(b)). It increases with increasing density, es expeced upon den-sification. This tendency remains up to P ∼ 23 GPa
(rs = 2.6), which matches well the pressure range over
which the liquid becomes more compact. Above this pres-sure, the bandwidth begins to decrease due to a develop-ment of partial (p-character) bonding, which lowers the band-structure energy. The DOS develops a marked peak well below the Fermi level. This is also the range over which the coordination in the liquid begins to decrease.
Finally, starting at P ∼ 150 GPa (rs< 2.05), the valence
band begins to broaden again, but the DOS at the Fermi level does not decrease much further. This density range coincides with the conditions under which the tetrahedral coordination develops.
The consideration of valence electrons alone is clearly insufficient to understand the modifications occurring at P > 150 GPa, which can be explained by examining the
core electrons. Indeed, for rs < 2.05 (P > 150 GPa)
the p angular momentum character of the core electrons increases rapidly (Fig. 3(b)), indicating core-core over-lap. At the same time, the volume available to the va-lence electrons, now squeezed into interstitial regions, de-creases linearly with increasing density and hence the rapid increase of the valence bandwidth. The resulting ”anti-diamond” structure (inset in Fig. 5) is with ions forming a tetrahedral network, but the valence electrons occupying preferentially the voids of the diamond struc-ture instead of being located between adjacent ions.
The electrical conductivity (σ) of compressed liquid Li exhibits exactly the opposite P and T dependence usual for metals. Our computations [16] show that along the 1000 K isotherm it has nearly a 10-fold drop between 3 and 150 GPa. When heating the liquid to 3000 K near and above 250 GPa, there is about twofold increase in σ, but this increase vanishes at lower P . These results are compared with measurements [14, 15] for which we now provide an explanation that is very different from what was originally proposed.
First, the electron localization and decrease of DOS at the Fermi level lead to a significant drop in σ with P . Second, the above-mentioned electronic changes are closely related to structural transitions from a higher to a lower-coordinated liquid. This trend is reversed when heating the liquid at a constant V ; it reverts to a more homogeneous local order (see Fig. 4) as favored by en-tropy. The result is an increase of σ with T , as seen in our calculations above 150 GPa. This effect is of course countered by increased electron-ion scattering at high T . At P ∼ 100 GPa, the two effects cancel, and at lower P where the structural changes are less significant, the scattering effects dominate. This explanation for the ob-served changes in σ is different from what was previously suggested and we emphasize that the increase in conduc-tivity observed at the highest-P measurements by Fortov et al. [14]) is not a pressure but a temperature effect. De-spite the fact that the latter data were obtained using a model equation of state to estimate the density, resistiv-ity, and T , the general trend of increased σ with T at sufficiently high P is consistent with our findings.
Finally, we compute the melting curve (Fig. 5) using a heat-until-melting approach, which provides an upper
bound for the melting temperatures (Tm). The method
was shown [4] to be valid for Na for reasons that are likely to hold for Li. The melting curve has a steep negative
slope between roughly 20 and 80 GPa, with Tm
drop-ping from (680 ± 25) K to (275 ± 25) K. The shape of the melting curve above bcc is relatively flat, which is consistent with a gradual transformation in the liq-uid from bcc-like to f cc-like local order. The f cc solid is denser than bcc and the melting slope above it initially in-creases, in accordance with the Clapeyron equation. The onset of symmetry breaking transitions lead to lowering of the liquid electronic band structure energy, its
densifi-1.6 1.8 2 2.2 2.4 2.6 2.8 3 rs 0.96 0.98 1 1.02 1.04 1.06 dm-n Pressure (GPa) 1000 K 1-4 17-21 13-16 9-12 5-8 3 11 21 46 85 177 370 1.6 1.8 2 2.2 2.4 2.6 2.8 3 rs 0.96 0.98 1 1.02 1.04 1.06 dm-n Pressure (GPa) 3000 K 3 11 23 46 85 177 370 1-4 5-8 9-12 13-16 17-21
FIG. 4: Evolution of density-rescaled average interatomic dis-tances with pressure and density at T = 1000 K (left panel) and T = 3000 K (right panel). As expected, increasing tem-perature leads to more homogeneous structures.
cation, and, hence, to the turnover of the melting curve
above the f cc phase. The maximum Tm is near 20 GPa
- exactly where we identified the onset of the changes towards lower coordination. The anomalous melting be-havior persists until pressures where the solid also begins to undergo Peierls symmetry breaking transitions.
We have only computed the melting curve in the pres-sure range where the crystalline structures are well estab-lished. Above 100 GPa, (or even down to 70 GPa), they remain unsettled; previous suggestions include Cmca [1] and Cmca24 [7]. We propose that future investigations of low-T crystalline phases of compressed Li focus on diamond-like tetrahedral structures. The appearance of such a phase, and especially its persistence at high T , is completely unexpected. While the modifications in Li are initially driven by Peierls-like distortions, at higher P they are determined by core-core electron interactions and valence electron localization (resulting from core-valence interactions). This behavior describes a distinct regime, likely present in other materials, where both va-lence and core electrons are responsible for chemical and physical properties. Such effects could have far reach-ing consequences in areas rangreach-ing from planetary mod-eling to the study of superconductivity under pressure [19, 20, 21, 22, 23]. Another interesting aspect is the possible implications of these results for the properties of dense hydrogen. It has been discussed [1, 24] that similarities between Li and H could be used to predict high-pressure phases, including superconductivity [25], in metallic H.
Work supported by NSERC and CFI. Computational resources provided by ACEnet, IRM Dalhousie, West-grid, and Sharcnet. I.T. acknowledges support by the Killam Trusts. We thank E. Schwegler, R. Redmer, A. Correa, M. Bastea, and V. E. Fortov for discussions.
1 10 100 1000 Pressure (GPa) 100 200 300 400 500 600 700 800 900 T emperature (K) fcc cI16 bcc CmcaX? tetrahedral?
FIG. 5: Melting curve of Li under pressure. Available experi-mental data [17, 18] are shown in green. Uptriangle and down-triangle pairs indicate FPMD simulations of solid and liq-uids phases, respectively, on the same isochore, which bracket the melting temperature. The dashed line connecting the highest-pressure experimental data to the theoretical points near 10 GPa is only a guide to the eye. The vertical dotted lines indicate ambient temperature phase boundaries between solid phases. Only the high temperature phase boundary be-tween f cc and cI16 has been estimated based on their re-spective melting temperatures. For pressures above 90 GPa, previous theoretical studies have proposed crystals with the Cmca [1] and Cmca24 [7] symmetries; hence, we have indi-cated this phase as CmcaX. The inset shows the tetrahedral structure, which develops in the liquid above 150 GPa. The picture is from a liquid configuration taken at rs = 1.8 and T = 1000 K. The ions are shown as red balls, each connected to its nearest neighbours. Isosurfaces of the valence charge density are shown in gold; they illustrate the localization of valence electrons in the interstitial regions.
∗ Electronic address: [email protected]
[1] J. B. Neaton and N. W. Ashcroft, Nature 400, 141 (1999).
[2] B. Olinger and W. Shaner, Science 219, 1071 (1999). [3] M. Hanfland, K. Syassen, N. E. Christensen, and D. L.
Novikov, Nature 408, 174 (2000).
[4] J. Y. Raty, E. Schwegler, and S. A. Bonev, Nature 449, 448 (2007).
[5] G. J. Ackland and I. R. McLeod, New J. of Phys. 6, 138 (2004).
[6] N. E. Christensen and D. L. Novikov, J. Phys.: Condens. Matter 14, 10879 (2002).
[7] R. Rousseau, K. Uehara, D. D. Klug, and J. S. Tse, ChemPhysChem 6, 1703 (2005).
[8] W. Kohn and L. J. Sham, Phys. Rev. 140, A1133 (1965). The FPMD simulations were performed with two codes. PWscf [26] (with Troullier Martins pseudopotentials) was used used for some (P < 50 GPa) melting simulations while VASP [27] (with all-electron PAW) for the rest. The valence only pseudopotential becomes inaccurate for rs< 2.2. All reported results are valid within the Perdew,
Burke, and Ernzerhof generalized gradient approxima-tion (PBE-GGA).
[9] For selected P and T , FPMD were carried out with 8
k-points, with 256 atom cells and time steps up to 16
a.u. small (1 a.u. = 0.02419 fs). The validity of our PAW potential at extreme density was tested on isolated Li5 tetrahedral clusters by comparing with all-electron DFT-GGA (both PBE and B3LYP) calculations produced with the Gaussian quantum chemistry code [28], using a −3/r ion potential. The quantity, which we compare is dE/dr, where E and r are the energy and the shortest interatomic distance in the cluster, respectively. The er-ror in pressure for 2.7 < r < 3.8 Bohr, which corresponds to the first peak of g(r) for 1.7 < rs< 2.4, is below 3%. [10] L. Lowenberg and A. Lodding, Z. Naturforsch. A 22,
2077 (1967).
[11] A. Correa, S. A. Bonev, and G. Galli, PNAS 103, 1204 (2006).
[12] W. C. Pilgrim and C. Morkel, J. Phys. Chem. 217, 957 (2003).
[13] J. P. Gaspard, A. Pellegatti, F. Marinelli, and C. Bichara, Phil. Mag. B 77, 727 (1998).
[14] V. E. Fortov et al., JETP Letters 74, 418 (2001). [15] M. Bastea and S. Bastea, Phys. Rev. B 64, 193104
(2002).
[16] DOS and σ were computed with ABINIT [29], using an all-electron PAW pseudopotential within the PBE-GGA. The reported results are from calculations with 32 k-points, but tests were made with up to 1000
k-points, and independently checked with VASP. The
Kubo-Greenwood formula was used to obtain σ. [17] H. Luedemann and C. Kennedy, J. of Geophysical
Re-search 73, 2795 (1968).
[18] R. Boehler, Phys. Rev. B. 27, 6754 (1983). [19] N. W. Ashcrof, Nature 419, 569 (2002). [20] K. Shimizu et al., Nature 419, 597 (2002).
[21] V. V. Struzhkin, M. I. Eremets, W. Gan, H. Mao, and R. J. Hemley, Science 298, 1213 (2002).
[22] S. Deemyad and J. S. Schilling, Phys. Rev. Lett. 91, 167001 (2003).
[23] N. E. Christensen and D. D. L. Novikov, Phys. Rev. Lett. 86, 1861 (2001).
[24] R. M. Martin, Nature 400, 117 (1999).
[25] N. W. Ashcroft, Phys. Rev. Lett. 21, 1748 (1968). [26] S. Baroni et al. (http://www.pwscf.org).
[27] G. Kresse and J. Hafner, Phys. Rev. B 47, 558 (1993); Comp. Mat. Sci. 6, 15 (1996).
[28] Gaussian 03, D.02, Gaussian, Inc., Wallingford CT, 2004. [29] X. Gonze et al., Comp. Mat. Sci. 25, 478 (2002).
![FIG. 5: Melting curve of Li under pressure. Available experi- experi-mental data [17, 18] are shown in green](https://thumb-eu.123doks.com/thumbv2/123doknet/5916827.145135/4.918.77.440.75.331/melting-curve-pressure-available-experi-experi-mental-shown.webp)
