HAL Id: hal-03160172
https://hal.archives-ouvertes.fr/hal-03160172v2
Preprint submitted on 13 Apr 2021
HAL is a multi-disciplinary open access
archive for the deposit and dissemination of
sci-entific research documents, whether they are
pub-lished or not. The documents may come from
teaching and research institutions in France or
abroad, or from public or private research centers.
L’archive ouverte pluridisciplinaire HAL, est
destinée au dépôt et à la diffusion de documents
scientifiques de niveau recherche, publiés ou non,
émanant des établissements d’enseignement et de
recherche français ou étrangers, des laboratoires
publics ou privés.
Reference Energies for Intramolecular Charge-Transfer
Excitations
Pierre-Francois Loos, Massimiliano Comin, Xavier Blase, Denis Jacquemin
To cite this version:
Pierre-Francois Loos, Massimiliano Comin, Xavier Blase, Denis Jacquemin. Reference Energies for
Intramolecular Charge-Transfer Excitations. 2021. �hal-03160172v2�
Reference Energies for Intramolecular Charge-Transfer
Excitations
Pierre-François Loos,
∗,†Massimiliano Comin,
‡Xavier Blase,
∗,‡and Denis Jacquemin
∗,¶†Laboratoire de Chimie et Physique Quantiques, Université de Toulouse, CNRS, UPS, France
‡Univ. Grenoble Alpes, CNRS, Inst NEEL, F-38042 Grenoble, France
¶Université de Nantes, CNRS, CEISAM UMR 6230, F-44000 Nantes, France
E-mail: [email protected]; [email protected]; [email protected]
Abstract
In the aim of completing our previous efforts devoted to local and Rydberg transitions in organic compounds, we provide a series of highly-accurate vertical transition energies for intramolecular charge-transfer transitions occurring in (𝜋-conjugated) molecular compounds. To this end we apply a composite protocol consisting of linear-response CCSDT excitation energies determined with Dunning’s double-𝜁 basis set corrected by CC3/CCSDT-3 energies obtained with the corresponding triple-𝜁 basis. Further basis set corrections (up to aug-cc-pVQZ) are obtained at the CCSD and CC2 level. We report 30 transitions obtained in 17 compounds (ABN, aniline, azulene, benzonitrile, benzothiadiazole, DMABN, dimethylaniline, dipeptide, 𝛽-dipeptide, hydrogen chloride, nitroani-line, nitrobenzene, nitrodimethylaninitroani-line, nitropyridine N-oxide, N-phenylpyrrole, phthalazine, and quinoxaline). These reference values are then used to benchmark a series of wave function (CIS(D), SOPPA, RPA(D), EOM-MP2, CC2, CCSD, CCSD(T)(a)*, CCSDR(3), CCSDT-3, CC3, ADC(2), ADC(3), and ADC(2.5)), the Green’s function-based Bethe-Salpeter equation (BSE) formalism performed on top of the partially self-consistent ev𝐺𝑊 scheme considering two different starting points (BSE/ev𝐺𝑊 @HF and BSE/ev𝐺𝑊 @PBE0), and TD-DFT combined with several exchange-correlation functionals (B3LYP, PBE0, M06-2X, CAM-B3LYP, LC-𝜔HPBE, 𝜔B97X, 𝜔B97X-D, and M11). It turns out that the CC methods including triples, namely, CCSD(T)(a)*, CCSDR(3), CCSDT-3, and CC3 provide rather small average deviations (≤ 0.10 eV), CC3 emerging as the only chemically accurate approach. ADC(2.5) also performs nicely with a mean absolute error of 0.11 eV for a O (𝑁6) formal scaling, whereas CC2 and BSE/ev𝐺𝑊 @PBE0 also deliver very satisfying results given their respective O (𝑁5) and O(𝑁4) computational scalings. In the TD-DFT context, the best performing functional is 𝜔B97X-D,
closely followed by CAM-B3LYP and M06-2X, all providing mean absolute errors around 0.15 eV relative to the theoretical best estimates.
1. CHARGE-TRANSFER EXCITATIONS
Charge-transfer (CT) transitions are key to the working prin-ciple of many practical applications of photoactive molecules (OLEDs, photovoltaics, photosynthesis, ion probes, etc). For this reason they have been widely studied, and they are gener-ally regarded as a specific class of excitations, fundamentgener-ally different from their more local valence and Rydberg coun-terparts. While there is no formal definition of CT, chemists generally consider that, in a CT transition, the excitation pro-cess transfers a significant fraction of electron density from one molecular fragment, the donor D, to another fragment, the acceptor A. These two fragments can be part of the same molecule (intramolecular CT) or belong to two distinct molecules (intermolecular CT). The CT excitation induces a significant charge shift in going from the ground state (GS) to the excited state (ES), the latter being typically (much) more polar than the former. The reverse situation in which the dipole strongly decreases upon excitation can also be ob-served (e.g., in betaine 301). In other words, CT transitions
are characterized by a large change in dipole moment as well as a small overlap between the starting and final molecular orbitals (MOs), or electron densities, involved in the transi-tion.
From a more theoretical point of view, considering an overall neutral system, one can show that a CT excitation energy behaves, for large enough separation 𝑅 between the donor and acceptor (the so-called Mulliken limit2) as3,4
Δ𝐸CT= IPD− EAA− 1/𝑅,
(1) where IPDis the first ionization potential of the donor, EAA is the electron affinity of the acceptor, and −1/𝑅 is the elec-trostatic interaction between the excited electron located on the acceptor fragment and the hole left behind located on the donor fragment. Due to the wrong asymptotic behavior of the kernel associated with (semi-)local exchange-correlation functionals (XCFs), it was quickly recognized that captur-ing the correct −1/𝑅 asymptotic behavior of Eq. (1) is
ticularly challenging for time-dependent density-functional theory (TD-DFT).5,6Furthermore, the energy difference be-tween the donor ionization potential (IPD) and acceptor elec-tron affinity (EAA) tends to be too small when using Kohn-Sham (KS) orbital energies obtained with semi-local func-tionals due to the lack of derivative discontinuity into the XCF upon electron addition or removal.7As a result, in its tradi-tional adiabatic formulation, TD-DFT tends to drastically underestimate CT transition energies when combined with local-density approximation (LDA) or generalized-gradient approximation (GGA) XCFs. Some improvements are ob-served for global hybrid functionals (such as B3LYP8–10and PBE011,12) that combine a uniform fraction of Hartree-Fock (HF) exchange with a (semi-)local XCF. However, unless 100% of exact exchange is included, a systematic underesti-mation of CT excitation energies remains due to the relative short-sightedness of global hybrids. Historically, this limita-tion strongly motivated the development of range-separated hybrids (RSHs)13–17and their optimally-tuned versions18,19 which provide a more subtle blend by switching gradually, as a function of the interelectronic distance, from short-range (semi-)local exchange to long-range HF exchange. In such a way, one can combine the best of both worlds by benefiting from the short-range dynamical correlation effects given by DFT as well as key error cancellation between exchange and correlation, while using 100% HF exchange at long range in order to entirely take into account the interaction between the electron and the hole, hence capturing the correct −1/𝑅 asymptotic behavior. RSHs are particularly effective at de-scribing CT transitions, but often at the cost of a (slight) overestimation of the transition energies of the correspond-ing local excitations.20
As an alternative to TD-DFT, one can use the Bethe-Salpeter equation (BSE) formalism21–28 starting with 𝐺𝑊 quasiparticle energies29–35 (BSE/𝐺𝑊 ) as specific formula-tions of Green’s function many-body perturbation theory, By construction, this scheme explicitly includes terms describ-ing the non-local electron-hole interactions, together with an accurate description at the 𝐺𝑊 level of the ionization poten-tials and electron affinities, allowing to “naturally” deliver accurate CT energies for a computational cost comparable to TD-DFT.28,36–39 The description of the non-local electron-hole interaction thanks to the screened Coulomb potential 𝑊 allows to consider CT excitations in situations differing from the ideal long-range CT through vacuum, a property central to the study of intramolecular CT or CT in effec-tive dielectric media such as organic semiconductors.40–45Of course, one can also turn towards wavefunction approaches, and both the second-order algebraic diagrammatic construc-tion [ADC(2)]46,47 and approximate second-order coupled-cluster method (CC2)48,49methods are generally regarded as well-suited for accurately describing CT phenomena.
2. CHARGE-TRANSFER METRICS
How does one pinpoint a CT transition? Experimentally, the identification of CT transitions is typically achieved by inves-tigating the absorption spectrum: a strong CT induces a large increase of dipole moment when going from the GS to the ES, which in turn, translates into a broad and structureless
absorption band undergoing significant redshifts when the polarity of the solvent increases (the so-called positive sol-vatochromism). Theory obviously delivers a complementary view for unveiling CT states. A decade ago, such task was often performed by investigating the topology of the MOs involved in the transition and/or the changes of partial atomic charges following the electronic excitation. Such analyses were certainly successful, but they obviously lacked system-atic character. Hence, more quantifiable metrics have been recently developed.
The first we are aware of is the so-called Λ parameter de-fined by Tozer in 2008.50 Λ measures the overlap between the occupied and virtual orbitals involved in a specific tran-sition, and was originally applied by the Tozer group to demonstrate the superiority of RSHs for CT and Rydberg transitions.50In 2011, Le Bahers, Adamo, and Ciofini came up with the 𝑑CT metric,51 which measures the distance be-tween the barycenters of density gain and depletion upon excitation; this model is thus particularly well-acquainted to density-based approaches.52,53Following these two seminal works, many other strategies have been proposed to quantify CTs, such as Guido’s Δ𝑟,54 which measures the electron-hole distance thanks to an analysis of the charge centroids of the orbitals involved in the excitation, Etienne’s 𝜙𝑠which
is based on the detachment/attachment matrices,55 and the more general approaches developed by Dreuw’s group,56,57 which allow analyses not only at the TD-DFT level but also with more advanced wavefunction theories such as ADC(2). Several of these metrics have been implemented in well-known quantum chemistry codes and clearly enjoy a strong popularity in the community. In this framework, we specifi-cally highlight the purpose-designed TheoDORE package58 encompassing many models for investigating ES topologies. Although these various metrics do not provide a definite answer to the “what is a CT transition” question, and poten-tially deliver distinct answers depending on the nature of the underlying (density or wavefunction) description, they nev-ertheless offer a large panel of options for quantifying the CT strength.
3. LITERATURE SURVEY
To evaluate the performances of specific methods for CT tran-sitions, various sets of reference values have been proposed over the years. Let us describe a selection of some relevant datasets.
In their seminal TD-DFT work,50 Peach and cowork-ers gathered a group of 14 intramolecular CT transitions obtained in three model peptides, N-phenylpyrrole (PP), dimethylamino-benzonitrile (DMABN) and hydrogen chlo-ride (HCl). The reference values were taken from a previous CASPT259,60 work for the peptides,61 extracted from ex-periment for DMABN, and determined at the CC2 level for both PP and HCl. The same reference values were used in the following years to assess various DFT approaches.62–64 How-ever, in 2012, the Tozer group used EOM-CCSD to define new benchmark transition energies for the smallest peptide as well as for both planar and twisted DMABN and PP, in a work encompassing 9 reference CT energies.65The same year, Dev, Agrawal and English compiled a set of 16 CT
transitions in large conjugated dyes,66 and they exclusively employed experimental data as reference. In 2015, Heßel-mann considered the 10 CASPT2 values obtained for pep-tides61and the 2 EOM-CCSD data determined for PP65as benchmarks for evaluating the performance of non-standard TD-DFT schemes.67All the transitions of the original con-tribution of Peach and coworkers were re-evaluated in 2019 by Goerigk’s group,68 which proposed updated references obtained with CCSDR(3)/cc-pVTZ69 (or SCS-CC2)70 of-ten using a basis set extrapolation technique similar to the one applied here (vide infra). This set was completed by three additional cases, namely para-nitro-aniline (pNA) with a reference value obtained with CCSDR(3), the benzene-tetracyanoethylene (B-TCNE) intermolecular complex with a EOM-CCSD(T)71reference, and a large dye (so-called DBQ) for which experiment was used as benchmark.72These vari-ations in reference values along the years for Tozer’s original set clearly highlight the appetite of the electronic structure community for high-quality benchmark values, as well as the lack of indisputability for such data even for thoroughly-studied systems.
We wish also to mention that the test set developed by Truh-lar and Gagliardi73 contains three CT transitions for pNA [computed at the 𝛾-CR-EOM-CC(2,3)D level],74 DMABN (experiment) and B-TCNE (experiment). Two of us consid-ered the same CT transitions to explore the performances of BSE/𝐺𝑊 .75In 2018, Gui, Holzer and Klopper,76used a set of seven CT states in pNA, DMABN, PP, HCl and B-TCNE in the similar context. For the first five molecules, they proposed basis set extrapolated CC3/aug-cc-pVTZ re-sults, therefore providing again new reference values for those popular systems.
Other sets have been exclusively dedicated to intermolec-ular CT transitions, which can be viewed as conceptually simpler, as the electron “jumps” from one molecule to an-other during the CT excitation. Such systems were used al-ready 15 years ago by Truhlar’s group,77,78and have become very popular for benchmarking density- and wavefunction-based methods.18,77–85In 2009, Stein, Kronik and Baer used 13 experimental values measured in CT complexes consti-tuted of an aromatic system interacting with TCNE to assess the performances of their optimally-tuned RSH functional.18 The same systems were further studied at the BSE level in 2011.36 In 2020, Ottochian and coworkers followed a very similar strategy to benchmark various hybrid and double-hybrid functionals.83 In 2011, Aquino and coworkers em-ployed ADC(2) as reference to benchmark various XCFs for CT occurring in stacked DNA bases.79Similar stacked nu-cleobases were also studied by Szalay and coworkers in a 2013 work which reports EOM-CCSD(T) data,80in 2014 by Blancafort and Voityuk who obtained CASPT2 energies,81 and in 2021 by the Matsika group which provided a large set of reference values obtained at the ADC(3)/cc-pVDZ level.85 Again, the richness of reference values is obviously both an advantage and a drawback as it is objectively hard to know which work reports the most accurate transition energies. Recently Kozma et al. tackled this question by defining 14 accurate intermolecular CT transitions obtained in molecular dimers (e.g., ammonia-fluorine, pyrrole-pyrazine,
acetone-nitromethane, . . . ).84 In this key work, the reference val-ues are obtained at EOM-CCSDT86 or CCSDT-387 levels (depending on the system size) with the cc-pVDZ basis set and several lower-order wavefunction approaches are bench-marked. Interestingly, this study reveals that for intermolecu-lar CT transitions, CCSDT-3 is more accurate than CC3,88,89 which is the opposite trends as compared to local and Ryd-berg transitions.90To the very best of our knowledge, Ref.84
stands today as the sole work providing reference CT values obtained at a very high level of theory (i.e., EOM-CCSDT).
Our goal here is to propose to the community a list of highly-accurate vertical transition energies for intramolecular CT excitations that can be used as reference to assess the pros and cons of lower-level models. For instance, there have been recent controversies in the literature regarding the relative ac-curacy of various double hybrids for CT transitions,68,83,91,92 whereas there are significant discrepancies (ca. 0.2 eV) be-tween the recent CC-based theoretical best estimates (TBEs) obtained for pNA, DMABN, and PP by distinct groups,68,76 and it is rather difficult to determine the actual origin (basis set, geometry, method, . . . ) of these differences.
We do hope that the present (rather large) set can help set-tling in these incertitudes. Obviously, some systems treated here have been taken from the sets described above, but we have both computed more accurate geometries (vide infra) and clearly increased the level of theory employed to de-fine the benchmark TBEs as compared to previous efforts devoted to intramolacular CT. Although these endeavors are well in-line with our recent efforts devoted to local and Ry-dberg transitions of organic compounds93–96that led to the QUEST database encompassing approximately 500 reference vertical transition energies,39,90 it should be noted that the very nature of CT transitions makes the determination of reference values more challenging. Indeed, large density shifts ubiquitous to CT phenomena typically take place in larger compounds than those previously treated. Conse-quently, (EOM-)CCSDTQ calculations are clearly beyond reach, whereas (EOM-)CCSDT calculations lie at the fron-tier of today’s possibilities. Beyond completing the QUEST database,39,90we also believe that the present reference val-ues nicely complement the ones recently proposed by the Szalay group for intermolecular CT excitations.84Following the philosophy of the QUEST database, we also wish to avoid any experimental input in order to avoid potential biases and ease theoretical cross comparisons.
4. COMPUTATIONAL METHODS
The investigated systems are displayed in Fig. 1. They include some of the previously described compounds (see Sec.3), as well as a significant series of new derivatives.
4.1 Geometries
Unless otherwise stated, we use CCSD(T)97 or CC388,89 to optimize the ground-state geometry of each compound. These optimizations are carried out with Dunning’s cc-pVTZ basis set using CFOUR2.198that offers analytical GS nuclear gradients for both methods. As expected, we applied the most advanced approach, CC3, when possible, i.e., for the “small-est” systems investigated. The frozen-core (FC) approxima-tion is enforced during these geometry optimizaapproxima-tions.
Carte-Figure 1: Representation of the investigated derivatives.
sian coordinates and the corresponding optimization method are provided for each compound in the Supporting Informa-tion (SI).
Spatial symmetry is enforced during the geometry opti-mization process which induces some constraints for specific molecules. For example, the 𝐶2𝑣point group is enforced for
aniline meaning that the amino group is planar. Experimen-tally, the NH2group is puckered, but the symmetry constraint
allows for faster calculations as well as an easier ES tracking from one method to another. Of course, such constraints might prevent direct comparisons with experiments, but it is well-known that vertical transition energies have no clear experimental equivalent anyway.99
4.2 Basis sets
As further explained below, in a first stage, we perform ES calculations with Dunning’s cc-pVDZ and cc-pVTZ basis sets applying systematically the FC approximation. This al-lows us to provide TBEs/cc-pVTZ reference values which are subsequently employed to benchmark wavefunction methods. There are several reasons for the choice of cc-pVTZ: i) the same basis set was used in previous benchmark studies de-voted to intramolecular CT,50,68,100 and ii) the addition of diffuse basis functions would yield lower Rydberg transi-tions and increase state mixing. This would be detrimental for identifying CT states in some derivatives (e.g., the pep-tides). We note that Kozma and coworkers went for an even more radical choice (cc-pVDZ) in their recent work,84 but we acknowledge that the basis set effects are likely larger for the intramolecular cases treated here. Of course, the absence of diffuse functions in ES calculations is likely to result in (slightly) overestimated transition energies, which is why we also provide estimates with diffuse containing basis sets. This is also justified by the different basis set depen-dencies of wavefunction- and density-based methods.101–103 Therefore, in a second stage, we also perform CCSD calcu-lations97,104–107 with aug-cc-pVTZ, as well as CC248
cal-culations with aug-cc-pVTZ and aug-cc-pVQZ so as to get estimates with larger basis sets. See below for further details.
4.3 Reference calculations
The first stage of the present study deals with the obtention of reference excitation energies for CT excited states. To iden-tify CT transitions in the investigated derivatives, we first determine the lowest 8–20 transitions at the LR-CCSD/cc-pVTZ level with GAUSSIAN 16.108 We then analyze the nature of the underlying orbitals, and, when possible, com-pare with literature results. Next, we compute the same ESs at both the ADC(2)/cc-pVTZ46,47and CAM-B3LYP/cc-pVTZ15levels of theory using Q-CHEM 5.3109and GAUS-SIAN 16,108 respectively. Establishing the correspondence between ESs at different levels of theory is straightforward for the vast majority of the cases. From the CAM-B3LYP calculations, we compute the CT distance, as given by Le Bahers’ model51,52 on the basis of the difference between the relaxed TD-DFT density and its GS KS-DFT counter-part. This value is simply labelled 𝑑CTCAMbelow. Likewise, from the ADC(2) data, we compute the electron-hole dis-tance from an analysis of the transition density matrix,56,57 labelled 𝑟ADCeh in the following. Finally, we also compute, as an estimate of the CT strength, the electron-hole distance determined from the inverse of the expectation value of the direct Coulomb operator over BSE electron-hole eigenstates stemming from the BSE/ev𝐺𝑊 @HF/cc-pVTZ calculations (see also the SI). These are performed with the Fiesta pack-age.110These latter values are denoted 𝑟ehBSEin the following. Whilst it would certainly be possible to rely on alternative metrics (see Sec.2), we have selected these three models to have complementary views on the nature of the CT states (DFT vs wavefunction vs Green’s function, ES density vs transition density vs Coulomb matrix). As mentioned below, the CT transitions found following such a protocol are usually in agreement with the known literature.
CCSDT-3,87,111 CC3,88,89 and CCSDT86,112–115 transition energies for the states previously identified. For the rather small num-ber of pathological cases, having a LR-CCSD guess is a valu-able asset to ease the convergence towards the target ESs. To define our TBEs/cc-pVTZ values, we rely on the following incremental approach Δ𝐸TBE TZ = Δ𝐸 CCSDT cc-pVDZ+ h Δ𝐸CC3 cc-pVTZ− Δ𝐸 CC3 cc-pVDZ i = Δ𝐸CCSDT cc-pVDZ+ ΔΔ𝐸 CC3 TZ , (2)
Such additive scheme is popular in the CC community116–122 and similar approaches have been employed in studies involv-ing CT states.65,68,76In Table S5 of the SI, we list the ΔΔ𝐸TZ
values obtained with CCSDT-3 and CC3, and their very high degree of similarity is obvious, with a 𝑅2of 0.99 and a mean absolute deviation between the two sets of data as small as 0.01 eV. In a second step, we have obtained TBEs accounting for diffuse orbitals by applying a similar scheme, that is,
Δ𝐸TBE ATZ = Δ𝐸 TBE TZ + h Δ𝐸CCSD aug-cc-pVTZ− Δ𝐸 CCSD(T-3) cc-pVTZ i = Δ𝐸TBE TZ + ΔΔ𝐸 CCSD(T-3) ATZ = Δ𝐸CCSDT cc-pVDZ+ ΔΔ𝐸 CC3 TZ + ΔΔ𝐸 CCSD(T-3) ATZ (3)
in which the term ΔΔ𝐸ATZ was typically determined with
CCSD, unless CCSDT-3/aug-cc-pVTZ calculations were technically feasible. In Table S6 in the SI, we compare the ΔΔ𝐸ATZ values obtained with CC2, CCSD, and CCSDT-3. Whilst the basis set corrections are highly dependent on the considered state and molecule, they are almost unaffected by the level of theory selected, e.g., the absolute difference be-tween the CCSD and CCSDT-3 basis set correction is at most 0.02 eV and 0.01 eV on average. This clearly highlights the transferability of basis set effects between these two wave-function methods. Eventually, to get even closer to the CBS limit and ease the comparison between wavefunction- and density-based methods, we added additional corrections at the CC2 level, i.e.
Δ𝐸TBE AQZ= Δ𝐸 TBE ATZ+ h Δ𝐸CC2 aug-cc-pVQZ− Δ𝐸 CC2 aug-cc-pVTZ i = Δ𝐸TBE ATZ+ ΔΔ𝐸 CC2 AQZ = Δ𝐸CCSDT cc-pVDZ+ ΔΔ𝐸 CC3 TZ + ΔΔ𝐸 CCSD(T-3) ATZ + ΔΔ𝐸 CC2 AQZ (4) The CC2 calculations with both cc-pVTZ and aug-cc-pVQZ are performed with TURBOMOLE,123 applying the resolution-of-identity (RI) approximation with the corre-sponding basis sets.124 and we have confirmed that the RI approximation has a negligible effect on the present results. As can be seen below, this last correction is marginal for the vast majority of states considered here, so that we do expect that the aug-cc-pVQZ basis set provides very accurate esti-mates for low-lying ESs in organic compounds, and we do not foresee further basis set extension to play a significant role.
4.4 Wavefunction and BSE benchmarks
In the second phase of the present study, we evaluate the performances of several wavefunction- and Green’s function-based approaches using the Δ𝐸TBETZ values de-fined in Sec. 4.3 as references. We systematically apply the FC approximation in all these calculations. The following approaches were tested: CIS(D),125,126 EOM-MP2,127 SOPPA,128,129 RPA(D),130 CC2,48,49 CCSD,97 CCSD(T)(a)*,131 CCSDR(3),69 CCSDT-3,87,111 CC3,88,89ADC(2),46,47ADC(3),47,132,133ADC(2.5),134and BSE/𝐺𝑊 .21,22,27The EOM-MP2 and ADC calculations are performed with Q-CHEM 5.2,109 applying the RI approxi-mation with the cc-pVTZ-RI auxiliary basis set,124and tight-ening the convergence and integral thresholds. The CIS(D) and CCSD calculations are achieved with GAUSSIAN 16,108 using default parameters. The SOPPA, RPA(D), CC2 and CCSDR(3) results are obtained with DALTON 2017,135also using default parameters. In the following, we omit the prefixes LR and EOM as both formalisms are known to yield identical excitation energies.106,136
The BSE calculations are performed with the Fiesta pack-age,110using Coulomb-fitting RI with the cc-pVTZ-RI aux-iliary basis set.124The intermediate 𝐺𝑊 quasiparticle ener-gies and screened Coulomb potential 𝑊 are calculated using a partially self-consistent scheme on the eigenvalues (ev𝐺𝑊 ) shown in several studies to provide accurate data137,138while significantly removing the dependency on the input KS or HF eigenstates in the final BSE excitation energies.76,110,139 Dy-namical effects in the 𝐺𝑊 self-energy are treated within an exact contour-deformation approach. For good convergence, all MO energy levels within 10 eV of the HOMO-LUMO gap are explicitly corrected at the 𝐺𝑊 level, lower (higher) states being shifted using the quasiparticle correction ob-tained for the lowest (highest) explicitly corrected level.139 To facilitate the identification of transitions, we first focus on BSE/ev𝐺𝑊 calculations starting from HF eigenstates (BSE/ev𝐺𝑊 @HF), but we next determine the BSE/ev𝐺𝑊 excitation energies obtained starting from PBE011,12 eigen-states (BSE/ev𝐺𝑊 @PBE0), which is a more usual choice in BSE calculations.
4.5 TD-DFT benchmarks
All our TD-DFT calculations have been performed with GAUSSIAN 16,108 using the ultrafine quadrature grid. As the convergence with respect to the basis set size of vertical excitation energies stemming from density-based methods (such as TD-DFT) and wavefunction-based methods tend to significantly differ,101–103 we have decided to perform the TD-DFT benchmarks with the aug-cc-pVQZ basis set (i.e., using the TBE/aug-cc-pVQZ values as references), which is likely large enough to be close to the CBS limit for both families of methods. We have selected the following XCFs to perform our calculations: two global hybrids with rather low exact exchange percentage, B3LYP (20%)10,140–142and PBE0 (25%),11,12 one global hybrid with a much larger share of exact exchange, M06-2X (54%),78 and five RSHs (CAM-B3LYP,15LC-𝜔HPBE,143 𝜔B97X,17𝜔B97X-D,144 and M11145). As mentioned in Sec.1, it is well recognized that the latter XCFs are better suited for modeling CT tran-sitions. We wish nevertheless to explore the performances
of the global hybrids for “mild” CT as well as the relative performances of the five RSH functionals for various CT strengths.
5. RESULTS AND DISCUSSION
5.1 Reference values
Our reference vertical excitation energies are listed in Table
1, in which we report CCSD, CCSDT-3, CC3, and CCSDT values with two basis sets (cc-pVDZ and cc-pVTZ), as well as literature values and CT strengths evaluated thanks to the three models described in Sec. 4.3. Additional details (os-cillator strengths, MO combinations at CCSD level, etc) can be found in the SI. Taking the 𝑟ADCeh values as reference, one notes a satisfactory agreement with 𝑑CAMCT for rather small CT (for strong CT, the CAM-B3LYP charge separations appear too small), and a decent match with 𝑟BSEeh for the cases of large electron-hole separation (for weak CT, the BSE charge separations appear too large). This can be clearly seen in Fig. S1 in the SI. At this stage, we of course highlight that in the case of mild CT character, a change of basis set could induce non-trifling variations of the values given by these CT metrics.
5.1.1 Aminobenzonitrile
Aminobenzonitrile (ABN) is a well-known push-pull molecule, that has been the subject to several previous the-oretical studies with wavefunction approaches,146,147,175–179 these works typically focussing on the two lowest ESs of local (𝐵2) and CT (𝐴1) character. According to the ADC(2)
metrics, excitation to this 𝐴1state induces a charge separation
of ca. 1 Å (see Table1), and there is a perfect match between the CC3 and CCSDT values, whereas CCSDT-3 (CCSD) seem to deliver slightly (significantly) overestimated values. Our TBE/cc-pVTZ, 5.26 eV, perfectly matches the value obtained in the most recent CASPT2 study we are aware of,178 and is also in quite good agreement with a twenty-year-old STEOM-CCSD estimate (5.13 eV).147 Those two works used the cc-pVDZ basis set however. In contrast, all previous CASPT2 estimates seem to provide smaller values in the 4.44–5.01 eV range.146,175–177The experimental 𝜆max
is located at 4.76 eV in an apolar solvent,148a value signifi-cantly below our basis set corrected vertical transition energy (5.09 eV), as expected in such comparison.
5.1.2 Aniline
For aniline, the lowest 𝐴1excited state involves more than one
MO pair (see the SI) and has a weak CT character (𝑑CTCAM= 1.02 Å, 𝑟ADCeh = 0.83 Å, and 𝑟ehBSE = 1.91 Å). Indeed, this state was previously characterized as local in a calculation involving the puckered amine,150 whereas we enforced the 𝐶2𝑣point group in the present calculations. The results listed in Table1show a remarkable methodological stability, the CC3, CCSDT-3, and CCSDT values all falling inside a tight 0.04 eV window with the cc-pVDZ basis set, whereas the differences obtained with the triple-𝜁 basis set are relatively small. Our TBE/cc-pVTZ value, 5.87 eV, is strongly lowered when further basis set corrections are accounted for (5.48 eV). The latter value is in good agreement with the investigation of Worth’s group149 although we recall that we have enforced 𝐶
2𝑣 symmetry here (which also makes comparisons with
experiment difficult).
5.1.3 Azulene
Azulene is a very well-known asymmetric isomer of naph-thalene. Its electronic transitions have been investigated at various levels of theory,152,153,180,181 likely due to its un-usual non-Kasha fluorescence. According to the considered metrics, the second (2𝐴1) and third (2𝐵2) singlet ESs
ex-hibit small CT characters. As can be seen in Table1, CC3 transition energies are again very close from the CCSDT ones, whereas going from the double- to the triple-𝜁 basis set decreases the predicted transition energies by roughly −0.10 eV, further basis set extensions yielding even smaller changes. Our TBE is very close to a previous CASPT2/6-31G(d) estimate152for the 𝐴1 ES, but is significantly higher
than the multi-reference result for the 𝐵2ES. Both our TBEs
exceed the experimental 0-0 energies by approximately 0.3– 0.4 eV,153–155which is the expected trend.
5.1.4 Benzonitrile
In benzonitrile the two lowest transitions of 𝐴1and 𝐵2
sym-metries do not present any significant CT character (not shown). There is however a higher-lying dark 𝐴2 state
cor-responding to a CT from the 𝜋 orbital of the cyano moi-ety parallel to the main molecular plane towards the highly-delocalized LUMO (see the SI for representation of the MOs) that has a CT nature (𝑟ehADC= 1.18 Å). Our TBE/cc-pVTZ for this transition is 7.10 eV, which is likely trustworthy as the CC3 and CCSDT results are much alike with the cc-pVDZ basis set (see Table1). To the best of our knowledge, this specific transition was not investigated previously, but for a rather old CASPT2 analysis that reports a 7.33 eV value for the lowest 𝐴2ES.146
5.1.5 Benzothiadiazole
This bicyclic system, BTD, is an extremely popular accep-tor unit in solar cell applications.182–184Surprisingly, while one can find many TD-DFT investigations of large dyes en-compassing a BTD moiety, there seems to be no previous wavefunction investigation of this (isolated) building block. Contrasting with the previous molecules, the CCSDT-3 tran-sition energy is closer from the CCSDT value than its CC3 counterpart, though all three methods provide very similar excitation energies. Our TBE/aug-cc-pVQZ of 4.28 eV, is 0.76 eV above the experimental 0-0 energy,156but such large value is not inconsistent with the large experimental Stokes shift,185 and the strong theoretical elongation of the N – S bonds in going from the GS to the ES.186
5.1.6 Dimethylaminobenzonitrile
Dimethylaminobenzonitrile (DMABN) is the proto-typical system undergoing twisted intramolecular CT (TICT) and it consequently displays a dual-fluorescence signature strongly dependent on the medium. This process has been the subject of countless investiga-tions,62–64,70,146–148,150,157,158,175–177,187–199 and it is clearly not our intend to review in details all these works. Besides its TICT feature, DMABN is undoubtedly one of the most popular dye in CT benchmarks.50,65,66,68,73,75,76However, the present work stands again as the first to propose an estimate of CCSDT quality. Our TBE/aug-cc-pVQZ, 4.86 eV, should be rather solid given the agreement between CC3 and CCSDT, and the rather limited basis set effects. This TBE is exactly
T able 1: R ef er ence data for CT ESs. F or each s tat e, w e pr o vide its symme tr y and thr ee CT par ame ter s (in Å , see Sec. 2 ), as w ell as the tr ansition ener gies (in e V) obtained wit h v arious w a v e function me thods, the TBE/cc-pV TZ and TBE/ aug -cc-pV TZ ref er ence e xcitation ener gies, the CC2 corr ection ΔΔ 𝐸 CC2 , and the corr esponding basis-se t corr ect ed TBE/ aug -cc-pVQZ v alues. These v alues ar e obtained wit h Eqs. 2 to 4 , e xcep t o ther wise s tat ed. Com parisons wit h lit er atur e ar e giv en in the rightmos t columns. cc-pVTZ cc-pVDZ cc-pVTZ aug -cc-pVTZ aug -cc-pVQZ Litt. Molecule S tate 𝑑 CT CAM 𝑟 eh ADC 𝑟 eh BSE CCSD CCSDT -3 CC3 CCSDT CCSD CCSDT -3 CC3 TBE CCSD CCSDT -3 TBE ΔΔ 𝐸 CC2 AQZ TBE Th. Th. Exp. Exp. Aminobenzonitr ile 2 𝐴1 ( 𝜋 → 𝜋 ★) 1.15 1.01 2.05 5.53 5.43 5.39 5.39 5.41 5.30 5.25 5.26 5.23 5.13 5.09 0.00 5.09 4.98 𝑎 5.13 𝑏 4.76 𝑐 Aniline 2 𝐴1 ( 𝜋 → 𝜋 ★) 1.02 0.83 1.91 6.16 6.08 6.04 6.05 5.99 5.90 5.86 5.87 5.60 5.53 5.50 -0.02 5.48 5.42 𝑑 5.34 𝑒 5.39 𝑓 Azulene 2 𝐴1 ( 𝜋 → 𝜋 ★) 1.16 1.06 2.36 4.12 4.01 3.98 3.99 4.02 3.92 3.88 3.89 3.97 3.85 0.00 3.84 3.81 𝑔 3.46 ℎ 3.56 𝑖 3.57 𝑗 2 𝐵2 ( 𝜋 → 𝜋 ★) 1.02 0.95 2.43 4.89 4.68 4.60 4.62 4.82 4.61 4.52 4.55 4.78 4.50 -0.01 4.49 4.15 𝑔 4.13 ℎ 4.23 𝑘 Benzonitr ile 1 𝐴2 ( 𝜋CN → 𝜋 ★) 1.17 1.18 1.73 7.48 7.31 7.25 7.27 7.33 7.15 7.08 7.10 7.28 7.10 7.05 0.00 7.05 7.37 𝑎 Benzothiadiazole 1 𝐵2 ( 𝜋 → 𝜋 ★) 1.41 1.24 2.30 4.82 4.59 4.50 4.56 4.63 4.40 4.30 4.37 4.56 4.32 4.29 -0.01 4.28 3.52 𝑙 Dimeth y laminobenzonitr ile 2 𝐴1 ( 𝜋 → 𝜋 ★) 1.48 1.44 2.15 5.20 5.10 5.05 5.06 5.10 4.99 4.93 4.94 5.02 4.86 0.00 4.86 4.90 𝑚 4.94 𝑛 4.57 𝑜 Dimeth y laniline 1 𝐵2 ( 𝜋 → 𝜋 ★) 1.13 0.98 2.20 4.74 4.63 4.59 4.58 4.66 4.53 4.48 4.47 4.58 4.39 0.00 4.40 4.30 𝑝 4.48 𝑞 4.30 𝑟 2 𝐴1 ( 𝜋 → 𝜋 ★) 1.25 1.22 2.02 5.81 5.73 5.68 5.69 5.68 5.58 5.53 5.54 5.54 5.40 0.00 5.40 5.06 𝑝 5.16 𝑟 Dipeptide 7 𝐴 00( 𝑛1 → 𝜋 ★) 2 2.17 3.62 3.35 9.07 8.53 8.28 8.39 8.92 8.31 8.04 8.15 8.07 𝑠 8.33 𝑡 𝛽-Dipetide 7 𝐴 0( 𝜋1 → 𝜋 ★)2 2.36 3.16 3.11 9.13 8.85 8.72 8.77 8.90 8.59 8.51 𝑢 7.99 𝑠 8.59 𝑡 10 𝐴 00( 𝑛1 → 𝜋 ★)2 2.29 4.35 3.22 9.83 9.32 9.08 9.20 9.58 9.02 8.90 𝑢 9.13 𝑠 9.08 𝑡 Hydrog en Chlor ide 1 Π ( 𝑛 → 𝜎 ★) 1.05 0.95 1.66 8.29 8.24 8.23 8.23 8.18 8.12 8.11 8.10 𝑣 7.91 7.85 7.84 𝑣 7.88 𝑤 7.86 𝑥 8.23 𝑦 Nitroaniline 2 𝐴1 ( 𝜋 → 𝜋 ★) 2.02 2.08 2.27 4.96 4.79 4.70 4.76 4.80 4.61 4.51 4.57 4.63 4.40 -0.01 4.39 4.54 𝑡 4.30 𝑧 Nitrobenzene 2 𝐴1 ( 𝜋 → 𝜋 ★) 1.66 1.51 2.07 6.00 5.84 5.78 5.83 5.77 5.59 5.52 5.57 5.62 5.43 5.41 -0.01 5.39 4.99 𝑎 𝑎 5.27 𝑎 𝑏 4.62 𝑎 𝑐 5.11 𝑎 𝑑 Nitrodimeth y laniline 2 𝐴1 ( 𝜋 → 𝜋 ★) 2.18 2.41 2.37 4.68 4.51 4.42 4.48 4.53 4.33 4.22 4.28 4.39 4.14 -0.01 4.13 3.89 𝑎 𝑒 Nitrop yr idine N-Oxide 2 𝐴1 ( 𝜋 → 𝜋 ★) 1.70 1.97 2.07 4.60 4.39 4.28 4.46 4.24 4.13 4.24 𝑎 𝑓 4.32 4.10 4.10 0.00 4.10 4.32 𝑎 𝑔 3.80 𝑎 ℎ N-Phen y lp yr role 2 𝐵2 ( 𝜋 → 𝜋 ★) 2.11 2.13 2.07 6.02 5.77 5.67 5.70 5.84 5.60 5.50 5.53 5.63 5.32 0.00 5.32 5.52 𝑡 5.21 𝑎 𝑖 3 𝐴1 ( 𝜋 → 𝜋 ★) 2.28 3.54 3.54 6.72 6.33 6.17 6.24 6.52 6.14 5.97 6.04 6.34 5.85 0.00 5.86 6.07 𝑡 5.69 𝑎 𝑖 Phthalazine 1 𝐴2 ( 𝑛 → 𝜋 ★) 1.11 1.87 2.00 4.24 4.05 3.92 3.95 4.26 4.03 3.89 3.93 4.25 4.01 3.91 0.01 3.91 3.74 𝑎 𝑗 3.68 𝑎 𝑘 3.61 𝑎 𝑙 3.01 𝑎 𝑚 1 𝐵1 ( 𝑛 → 𝜋 ★) 1.13 1.87 1.86 4.67 4.49 4.38 4.40 4.64 4.43 4.32 4.34 4.61 4.40 4.31 0.00 4.31 4.20 𝑎 𝑗 4.12 𝑎 𝑘 3.91 𝑎 𝑙 3.72 𝑎 𝑚 Quino x aline 1 𝐵2 ( 𝜋 → 𝜋 ★) 1.51 1.76 2.42 5.20 4.99 4.90 4.95 5.00 4.79 4.69 4.74 4.91 4.69 4.64 -0.01 4.63 4.45 𝑎 𝑗 4.20 𝑎 𝑘 4.34 𝑎 𝑙 3.96 𝑎 𝑛 3 𝐴1 ( 𝜋 → 𝜋 ★) 1.12 0.97 2.18 6.13 5.97 5.90 5.89 6.01 5.84 5.76 5.75 5.91 5.75 5.66 -0.01 5.65 5.36 𝑎 𝑙 5.36 𝑎 𝑛 2 𝐵1 ( 𝑛 → 𝜋 ★) 1.21 1.85 2.30 6.94 6.59 6.39 6.46 6.87 6.48 6.26 6.33 6.73 6.36 6.21 0.01 6.22 T wis ted DMABN 1 𝐴2 ( 𝑛 → 𝜋 ★) 1.99 2.69 2.64 4.43 4.31 4.23 4.24 4.41 4.25 4.15 4.17 4.35 4.11 0.01 4.12 4.25 𝑎 𝑜 1 𝐵1 ( 𝑛 → 𝜋 ★) 1.74 2.60 2.17 5.27 5.07 4.95 4.98 5.19 4.95 4.81 4.84 5.09 4.74 0.01 4.75 5.09 𝑎 𝑜 T wis ted PP 2 𝐵2 ( 𝜋 → 𝜋 ★) 2.33 3.32 3.51 6.19 5.91 5.79 5.85 6.10 5.80 5.67 5.73 5.95 5.58 0.00 5.58 5.79 𝑎 𝑜 5.35 𝑎 𝑝 2 𝐴1 ( 𝜋 → 𝜋 ★) 2.38 3.32 2.96 6.37 6.09 5.97 6.03 6.18 5.89 5.76 5.82 6.00 5.64 0.00 5.65 5.45 𝑎 𝑝 1 𝐴2 ( 𝜋 → 𝜋 ★) 2.32 3.27 3.07 6.41 6.21 6.11 6.14 6.35 6.12 6.01 6.04 6.26 5.95 0.01 5.95 5.89 𝑎 𝑝 1 𝐵1 ( 𝜋 → 𝜋 ★) 2.37 3.37 3.15 6.78 6.54 6.42 6.46 6.61 6.36 6.24 6.28 6.50 6.16 0.01 6.17 6.31 𝑎 𝑜 𝑎C ASPT2/DZP v alue from R ef. 146 ; 𝑏S TEOM-CC/cc-pVDZ v alue from R ef. 147 ; 𝑐Exper imental maximum in 𝑛 -heptane from R ef. 148 ; 𝑑CR -EOM-CCSD(T)/ aug -cc-pVDZ v alue from R ef. 149 ; 𝑒S A C-CI v alue from R ef. 150 ; 𝑓 𝜆max (v apor phase) from R ef. 151 ; 𝑔V er tical C ASPT2/6-31G(d) results from R ef. 152 ; ℎ0-0 DFT(BHHL YP)/MR CI/TZVPP v alues from R ef. 153 ; 𝑖0-0 ener gy from fluorescence study of R ef. 154 ; 𝑗Photoelectron spectroscop y from R ef. 153 ; 𝑘0-0 ener gy from the fluorescence spectr um of the jet-cooled der iv ativ e in R ef. 155 ; 𝑙0-0 ener gy measured in frozen dic hlorobenzene matr ix from R ef. 156 ; 𝑚 MR CIS(8,7)+P/AN O-DZ v alue from R ef. 157 ; 𝑛ADC(3)/cc-pVDZ result from R ef.; 158 𝑜Exper imental 𝜆max (v apor phase) from R ef. 159 ; 𝑝C ASPT2/6-311G(d,p) v alues from R ef. 160 ; 𝑞CCSDR(3)/ aug -cc-pVDZ result from R ef. 161 ; 𝑟Exper imental 𝜆max (v apour phase) from R ef. 151 ; 𝑠C ASPT2/DZP v alue from R ef. 61 ; 𝑡CCSDR(3)/cc-pVTZ v alue (basis set e xtrapolated for the 𝛽 -Dipeptide) from R ef. 68 ; 𝑢CCSDT -3/cc-pVTZ v alue cor rected b y the difference betw een CCSDT/cc-pVDZ and CCSDT -3/cc-pVDZ ener gies; 𝑣FCI/cc-pVTZ v alue (present paper) and FCI/ aug -cc-pVTZ from R ef . 93 . F or the for mer basis, the same result is obtained with CCSDTQ/cc-pVTZ; 𝑤 Present CCSDTQ/ aug -cc-pVQZ v alue. 𝑥FCI/CBS (no FC) es timate from R ef. 93 ; 𝑦CC2/cc-pVTZ v alue from R ef. 50 ; 𝑧 𝛾 -CR -EOMCC(2,3),D/6-31+G(d,p) v alue from R ef. 73 ; 𝑎 𝑎C ASPT2//B3L YP result from R ef. 162 , the mos t recent C ASPT2 w e are a w are of repor ts a similar v alue of 5.01 eV; 163 𝑎 𝑏ADC(3)/ def2 -TZVP ener gy from R ef. 164 ; 𝑎 𝑐EELS on monola y er co v erag e from R ef. 162 ; 𝑎 𝑑Gas-phase optical absor ption maximum from R ef. 165 , a similar v alue of 5.15 eV is repor ted in the more recent R ef. 166 ; 𝑎 𝑒Exper imental g as phase v alue from R ef. 167 ; 𝑎 𝑓CCSDT -3/cc-pVTZ v alue, see te xt; 𝑎 𝑔C ASPT2/ aug -cc-pVDZ from R ef. 168 (pre viousl y un published); 𝑎 ℎExtrapolated g as-phase maximum, see R ef. 168 ; 𝑎 𝑖Ext. CC3/ aug -cc-pVTZ v alue from R ef. 76 ; 𝑎 𝑗CC2/ aug -cc-pVDZ results from R ef. 169 : 𝑎 𝑘C ASPT2/cc-pVQZ results from R ef. 170 ; 𝑎 𝑙From MCD spectra in 𝑛 -heptane from R ef. 171 ; 𝑎 𝑚0-0 ener gy from R ef. 172 ; 𝑎 𝑛0-0 ener gy in v apor from R ef. 173 ; 𝑎 𝑜Ext. CCSD/ aug -cc-pVTZ v alues from R ef. 65 ; 𝑎 𝑝C ASPT2/AN O-DZP v alues from R ef. 174 .
the same as the extrapolated CC3/aug-cc-pVTZ result of Ref.
76and is also close to the ADC(3)/cc-pVDZ value given by Mewes and coworkers (4.94 eV).158Of course, one can also found other estimates at lower levels of theory, e.g., 4.88 eV with CCSD/aug-cc-pVDZ,199 4.73 eV with STEOM-CCSD,147and 4.90 eV with MRCIS(8,7)+P/ANO-DZ,157all three being reasonably close to the current TBE. In contrast, previous CASPT2 estimates of 4.41 eV,1754.51 eV,1464.47 eV,1764.45 eV177are all significantly too low.
5.1.7 Dimethylaniline
This derivative was much less investigated than the previ-ous one and we could find only two studies of its excited states involving high-level ab initio methods [CASPT2160 and CCSDR(3)161]. The metrics selected in this work de-scribe the two lowest ESs of this compound as having a small CT character with a charge separation of ca. 1 Å with ADC(2), the CT nature of the 𝐴1transition being only slightly
larger than that of the “local” 𝐵2excitation. Here again, one
notes the usual methodological trends as illustrated by the data gathered in Table1, with superb agreement between the CC3 and CCSDT estimates, and a limited drop of the tran-sition energies when enlarging the basis set. The basis set corrected TBEs of 4.40 and 5.40 eV are reasonably in line with the literature.160,161
5.1.8 Dipeptide and𝛽-dipeptide
Both of these model compounds were originally character-ized at the CASPT2 level by Serrano-Andrés and Fülscher.61 The smaller derivative is a popular test molecule for CT,200,201 and is part of Tozer’s50,65 and Goerigk’s68 sets. In both systems, these works identified two CT transitions, denoted as 𝜋1 → 𝜋
★
2 and 𝑛1 → 𝜋 ★
2, the subscript referring
to the amide number in the compound (see Fig.1). For the smaller dipeptide, Tozer relied on the CASPT2/ANO-"DZP" values of 7.18 eV and 8.07 eV as benchmarks in his origi-nal work,50 whereas Goerigk proposed reference values of 7.17 and 8.33 eV estimates obtained the CCSDR(3)/cc-pVTZ level.
If these values seem numerically consistent, these two tran-sitions are hardly well defined, the mixing of the MO char-acter making unambiguous assignments impossible. As we detail in the SI, this is especially the case for the former 𝜋
1→ 𝜋
★
2 transition that mixes with local excitations. In fact
at the same CCSD/cc-pVTZ level, Tozer selected the 8.09 eV transition as a CT ES and the 7.35 eV transition as a local ES,65whereas Goergik made the opposite assignments. Both choices are in fact reasonable based on the selected criteria (see the SI). Due to this confusion, we did only consider the less problematic 𝑛1 → 𝜋
★
2 excitation for the dipeptide. For
this transition, the CCSDT value is interestingly in-between the CC3 and CCSDT-3 estimates, rather than closer to the CC3 value. As such transition has, chemically speaking, an intermolecular nature, this outcome parallels the finding of Kozma and coworkers who found that CCSDT-3 performs better for intermolecular CTs.84Our TBE/cc-pVTZ of 8.15 eV is slightly smaller (larger) than previous CCSDR(3)/TZ (CASPT2/DZ) estimates.
For the 𝛽-dipeptide, the identification of the two CT transi-tions is somehow easier than in the sister compound (see the
SI for details). With the cc-pVDZ basis, CCSDT values are roughly midway to CC3 and CCSDT-3. However, the larger size and limited symmetry of 𝛽-dipeptide make calculations extremely challenging, and CC3/cc-pVTZ calculations were beyond our computational reach. For the 𝜋1 → 𝜋
★
2excitation,
the CCSDT value is bracketed by the CC3 and CCSDT-3 re-sults, and our TBE of 8.51 eV is slightly below the CCSDR(3) data of Ref.68, whereas the original CASPT2 transition en-ergy is significantly too small.61For the higher lying 𝑛1→ 𝜋
★ 2
excitation, our best estimate obtained with the same protocol is 8.90 eV, lies below previous estimates.61,68
Given the very large MO mixing with both cc-pVDZ and cc-pVTZ, we did not attempt to obtain a TBE with diffuse-containing basis sets for these two derivatives.
5.1.9 Hydrogen chloride
HCl is small enough for allowing FCI and CCSDTQ calcula-tions, and both yield a transition energy of 8.10 eV for the hall-mark CT excitation with the cc-pVTZ basis set. This value is almost perfectly reproduced by both CC3 and CCSDT-3. We could also perform the CCSDTQ/aug-cc-pVQZ calculation which returned an excitation energy of 7.88 eV, within 0.02 eV of our previous FCI/CBS value obtained on the same ge-ometry, but with a different computational strategy.93Given these results, the original CC2/cc-pVTZ reference value con-sidered in Tozer’s set (8.23 eV) seems too large by 0.13 eV, whereas the CC3/aug-cc-pVTZ value of 7.81 eV used in Ref.
76could be slightly too low. 5.1.10 Nitroaniline
pNA is a prototypical donor-acceptor system, the potent ni-tro group allowing an elecni-tron-hole separation of the or-der of 2 Å, about twice the distance determined in the re-lated ABN compound. As in the other nitro-bearing sys-tems discussed below, CCSDT-3 seems to slightly outper-form CC3, though the consistency of all CC approaches including triples remains excellent. Our TBEs are 4.57 eV (with cc-pVTZ) and 4.39 eV (with aug-cc-pVQZ). This latter value is once more exactly equivalent to the one reported by the Klopper group with an extrapolated CC3/aug-cc-pVTZ scheme.76Other wavefunction estimates include a 3.80 eV estimate with CASPT2,176 4.30 eV with 𝛾-CR-EOMCC(2,3)D/6-31+G(d,p),73 4.72 eV with EOM-CCSD/aug-cc-pVDZ,202 and 4.54 eV with an extrapolated CCSDR(3)/cc-pVTZ scheme.68
5.1.11 Nitrobenzene
Similarly to the previous case, in nitrobenzene, the pulling group is stronger than in benzonitrile, and the lowest 𝐴1
state gains a significant CT character (𝑑CTCAM = 1.66 Å, 𝑟eh
ADC= 1.51 Å, and 𝑟 eh
BSE= 2.07 Å). As for the other systems
treated herein, the interested reader can find several previ-ous calculations of the ES properties of this substituted sys-tem,162–164,166,203–205but to the best of our knowledge, none relied on a CC approach including contributions from the triples. Nevertheless, we wish to point out the joint exhaustive work by the Marian and Dreuw groups exploring the photo-physics of nitrobenzene,164which includes CCSD, NEVPT2, and ADC(3) values for many ESs. While the CCSD transition energy is, as expected too large, there is an excellent agree-ment between CCSDT and the other CC methods including
iterative triples. The obtained TBEs are likely safe. These TBEs significantly exceed the experimental values, as well as the CASPT2162,163 and ADC(3) estimates,164 but are in good agreement with a recent CR-EOM-CCSD(T)/cc-pVDZ estimate of 5.44 eV.205
5.1.12 Nitrodimethylaniline
This chemical compound is likely one of the strongest donor-acceptor phenyl derivatives that one could envisage. The electron-hole separation in the lowest 𝐴1ES is enhanced by
0.1–0.3 Å and its energy is downshifted by roughly −0.3 eV as compared to pNA. Otherwise, the methodological trends are exactly the same as in the parent compound, the CCSDT result being bracketed by the CCSDT-3 and CC3 values, and the basis set effects being within expectation for a low-lying ES. Our TBE/aug-cc-pVQZ is 0.24 eV larger than the “experimental” 𝜆max in gas phase,167 whereas we did not
found previous CC estimates for this derivative. 5.1.13 Nitropyridine N-Oxide
This molecule is a solvatochromic probe,206and its interac-tions with various solvents were studied in details by various theoretical approaches.168 Besides it was not investigated theoretically as far as we know, so that this is the first work reporting CC3 and CCSDT-3 transition energies. Unfortu-nately, the CCSDT/cc-pVDZ corrections failed to properly converge for that specific compound. As a consequence, given the results obtained for the three previous nitro dyes, we went for the CCSDT-3/cc-pVTZ result as reference value. Our TBE/aug-cc-pVQZ estimates are 4.10 eV, 0.30 eV above the gas-phase 𝜆maxvalue estimated in Ref. 168on the basis
of the experimental spectra of Ref.206. Again, such a differ-ence between a vertical transition energy and an experimental absorption maximum is within expectations for a rigid dye. 5.1.14 N-Phenylpyrrole
PP is a well-known test molecules that is included in many CT sets.50,65,68,76,174,207,208 We considered both the planar and twisted (see below) 𝐶2𝑣 structures here, as in Tozer’s 2012
work.65In the former configuration, the two lowest ESs have a local character, whereas the third (2 𝐵2) and fourth (3 𝐴1)
transitions have strong CT characters, with a 𝑟ADCeh as large as 3.5 Å for the latter. With the cc-pVDZ basis set, the CCSDT energies are bracketed by the CC3 and CCSDT-3 values that are slightly too small and too large respectively. Our TBEs are 5.53 and 6.04 eV with cc-pVTZ, and 5.32 and 5.86 eV with aug-cc-pVQZ. The former are close to the extrapolated CCSDR(3)/cc-pVTZ values of Ref.68, whereas the latter are significantly larger than the extrapolated CC3/aug-cc-pVTZ estimates of 5.21 and 5.69 eV given in Ref.76.
5.1.15 Phthalazine
In this asymmetric bicyclic system, the two lowest ESs, of 𝑛 → 𝜋★character, do involve a moderate CT character ac-cording to the selected metrics. The data listed in Table
1show that CC3 and CCSDT do agree very well, whereas the CCSDT-3 transition energies seem too large by approx-imately 0.1 eV. Our TBE/cc-pVTZ of 3.93 and 4.34 eV are most probably trustworthy for this basis set and decrease only very slightly with the addition of diffuse basis functions. The most refined previous estimates we are aware of are the CC2/aug-cc-pVDZ results of Etinski and Marian169and the
CASPT2/cc-pVQZ values of Mori and coworkers,170 and it seems reasonable to state that the TBEs gathered in Table1
are more accurate. Our vertical energies are, as expected, larger than both experimental peak positions171,209 and 0-0 energies.172
5.1.16 Quinoxaline
In quinoxaline, we identified three transitions possessing a partial CT character with the selected basis set and mod-els: two 𝜋 → 𝜋★ ESs as well as a higher-lying 𝑛 → 𝜋★ ES. Confirming the trends obtained above, one notes that the CCSDT excitations energies are roughly in between their CCSDT-3 and CC3 counterparts for the states with a signif-icant electron-hole separation (𝑟ehADC >1.5 Å), but closer to the CC3 results for the transitions with milder CT charac-ter (𝑟ADCeh ∼ 1.0 Å). Unexpectedly, the basis set effects seem significantly larger than for phthalazine. For the lowest transi-tion considered, 1𝐵2, the present TBE/aug-cc-pVQZ of 4.63
eV exceeds significantly the previous CC2/aug-cc-pVDZ169 and CASPT2/cc-pVQZ170 results. Finally, for the two ESs for which experimental values have been reported,171,173the correct positive difference is once more obtained.
5.1.17 Twisted DMABN and PP
Finally, we consider DMABN and PP in their twisted con-formation in which the orthogonality between the NMe2or
pyrrole group and the phenyl moiety was enforced. The GS structures were optimized in the 𝐶2𝑣 symmetry. In such
conformation, the donor and acceptor units are effectively electronically uncoupled, and one creates two (DMABN) or four (PP) low-lying CT transitions from the nitrogen lone pair (DMABN) or the pyrrole 𝜋 system (PP) towards the two lowest phenyl 𝜋★orbitals. This also very crudely mimics the possible TICT behavior of these compounds. At the cc-pVDZ level, the CCSDT value falls systematically between the CC3 and CCSDT-3 results, the respective average errors of these two methods being −0.04 eV and +0.07 eV for the six ESs computed on the twisted molecules. In all cases, the basis set effects are rather limited, the cc-pVTZ results being only decreased by ca. −0.10 eV when going to aug-cc-pVQZ, except for the 𝐴1 transition of PP for which the
basis set effects are slightly larger. For the twisted DMABN our TBE/aug-cc-pVQZ values are slightly below the extrap-olated CCSD/aug-cc-pVTZ data obtained by Tozer.65 For twisted PP, the same observation holds and the present TBEs are larger than CASPT2/DZP values obtained two decades ago.174 In both cases, direct comparisons with experiment, e.g., fluorescence from the TICT structure, remains beyond reach as GS geometries are considered here rather than the ES geometries.
5.2 Benchmarks
5.2.1 Wavefunction and BSE
Having a series TBEs of CCSDT quality at hand, it seems natural to investigate the performances of lower-order ap-proaches. Then, we evaluate here wavefunction-, Green’s function-, and density-based methods. For the two former families we rely on the TBE/cc-pVTZ data as the basis set dependency is similar for these groups of methods. The correspoding results are collected in Table2. For the vast majority of the cases, the identification of the states was
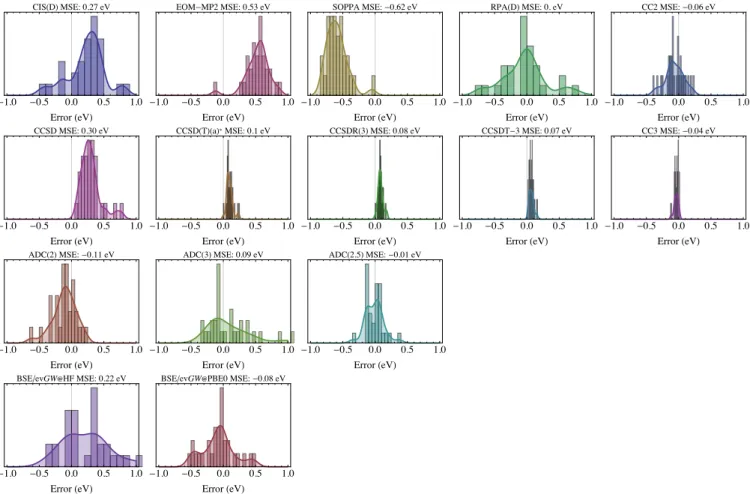
straightforward for all tested methods, except again for the two peptide derivatives for which a careful inspection of the orbitals/densities was required to reach the correct attribu-tion. At the bottom of Table 2, we also provide statistical quantities obtained by considering these TBEs as reference. We report mean signed error (MSE), mean absolute error (MAE), standard deviation of the errors (SDE), root-mean-square error (RMSE), and maximal positive [Max(+)] and negative [Max(−))] errors. For one transition, our TBE is of CCSDT-3 rather than CCSDT quality, so that the correspond-ing CCSDT-3 and CC3 results are obviously not included in the statistical analysis (see the footnote in Table2). Finally, a graphical representation of the error patterns can be found in Fig.2.
As can be seen in Table 2 and Fig. 2, CIS(D) typically overestimates transition energies, except for the twisted com-pounds. Hence, this leads to a quite large MSE value of 0.27 eV. The CIS(D) MAE, 0.35 eV, significantly exceeds the 0.22 eV value reported for the local transitions of the very large QUEST database,90hinting that CT states are likely difficult for CIS(D). RPA(D) is somehow superior as its MSE is close to zero, and its MAE is smaller, 0.34 eV, though the differ-ences seem to decrease when the CT character increase. A similar MAE of 0.35 eV was reported with RPA(D) for the valence singlet transitions of Thiel’s set.210EOM-MP2, an-other “computationally light” method also named CCSD(2) in some works, systematically overshoots the transition en-ergy (except for HCl), the MAE being very large (> 0.50 eV). Note, however, that a quite systematic error pattern is obtained (see Fig.2), as shown by the very acceptable SDE of 0.19 eV. This typical feature of EOM-MP2 (clear overes-timation of the transition energies with a significant increase of the magnitude of the error with system size) was also clearly identified in our previous benchmarks focussing on Rydberg and local transitions.90For their intermolecular CT set, Kozma and coworkers reported a very similar SDE (0.15 eV), but a smaller MSE (0.31 eV) for the same method, a clear overestimation trend being also found.84 SOPPA mir-rors somehow the behavior of EOM-MP2, with strong un-derestimations (MSE of −0.62 eV), but in a rather systematic way, so that the SDE is also rather small (0.21 eV). We note that the fact the SOPPA underestimates transition energies was already reported in several benchmarks,64,210,211 and is not specific to CT states, though the errors are particularly large here.
As expected,133CC2 and ADC(2) excitation energies are highly correlated (the 𝑅2 between the two series of tran-sition energies attain 0.995), and we found that the former method has a slight edge in terms of accuracy. For the present CT set, CC2 and ADC(2) are also more accurate than both CIS(D) and EOM-MP2, with MAE of 0.12 eV (CC2) and 0.16 eV [ADC(2)]. Various research groups reported similar average errors for local transitions in molecules of similar sizes.90,95,133,134,212–216Interestingly, when considering only the subset of strong CT (𝑟ADCeh ≥ 1.75 Å), one notes larger errors with significant (and nearly systematic) underestima-tions leading to negative MSEs of −0.14 eV and −0.19 eV for CC2 and ADC(2), respectively. In other words, both meth-ods tend to undershoot the CT transition energies when the
electron-hole separation becomes sizable. This trend is fully consistent with the investigation of Kozma and coworkers devoted to intermolecular CT ESs:84they reported MSE of −0.36 eV for both methods.
The contrast is clear with CCSD that overestimates quite considerably the transition energies, especially for the strong CT subset with a MSE of +0.37 eV. On the brighter side, CCSD provides quite systematic errors with a SDE of 0.16 eV. These trends are typical of CCSD and were reported in several benchmarks considering local and Rydberg excita-tions.75,90,93,95,134,212,216–221A MSE of +0.30 eV and a SDE of 0.08 eV have been reported for the 14 intermolecular CT transitions of Ref. 84.
The results obtained with the three CC methods including contributions from the triples are much more satisfying. In-deed, the MAEs are of the order of 0.10 eV (or smaller) and the SDEs are below the 0.05 eV threshold. A near-perfect cor-relation between the CCSD(T)(a)*, CCSDR(3), and CCSDT-3 transitions is noticeable (𝑅2 larger than 0.999 for all pos-sible pairs of methods, see also Fig.2). Comparing the two approaches with perturbative triples, namely, CCSD(T)(a)* and CCSDR(3), one notes very similar deviations, with a slight edge for the second method. Consistently with the results discussed above, CCSDT-3 systematically overesti-mates the TBEs, whereas CC3 tends to provide slightly too small values. While the sign and magnitude of the differences between the excitation energies obtained with these two CC approaches nicely parallel the findings of Kozma et al.,84 we find, in contrast to their work, that CC3 is superior as it provides chemically accurate CT excitation energies. This statement holds also when considering only the strong CT subset, and is in line with the results obtained for local and Rydberg transitions of compounds of similar size.90,95
Consistently with our recent investigations,90,134 ADC(3) does not significantly improve over ADC(2), as it yields large overestimations for the strong CT subset with a MSE of +0.25 eV, and a MAE of +0.30 eV, together with a significant disper-sion (see Fig.2). Therefore the trends obtained with ADC(3) are opposite to the ones noticed above for ADC(2). The ADC(2.5) approach134 — which simply consists in taking the average between the ADC(2) and ADC(3) transition en-ergies — is more accurate than the two other ADC methods with a negligible MSE, a MAE of ca. 0.11 eV, and a SDE of 0.14 eV. These values indicate that ADC(2.5) outperforms all the wavefunction methods tested here sharing the same O (𝑁6) or a lower O(𝑁5) computational scaling. These
sta-tistical values are totally similar to their local and Rydberg counterparts obtained in the QUEST database (respective MAEs of 0.08 and 0.09 eV),90hinting that ADC(2.5) might be a valuable compromise for many families of transitions.
The BSE/ev𝐺𝑊 calculations were performed with two very different sets of eigenstates (HF and PBE0) as in-put. The well-known positive impact of the ev𝐺𝑊 proce-dure75,76,110,215undoubtedly emerges in Table2. Indeed, one obtains a mean absolute deviation (MAD) of 0.33 eV only between the two sets whereas much larger variations would be reached by comparing TD-PBE0 and TD-HF. There is also a strong correlation (𝑅2 of 0.981) between the two sets of transition energies. In terms of performances, it is clearly
T able 2: CT e xcitation ener gies (in e V) obtained wit h v arious w a v efunction-based me thods wit h the cc-pV TZ basis se t. S tatis tical q uantities ar e repor ted at the bo tt om of the T able. F or the MSE and MAE, w e also pr o vide v alues obtained for the “s tr ong CT” subgr oup, i.e., tr ansitions for which 𝑟 eh ADC ≥ 1 .75 Å . Molecule S tate TBE CIS(D) EOM-MP2 SOPP A RP A(D) CC2 CCSD CCSD(T)(a)* CCSDR(3) CCSDT -3 CC3 ADC(2) ADC(3) ADC(2.5) BSE@HF BSE@PBE0 Aminobenzonitr ile 2 𝐴1 ( 𝜋 → 𝜋 ★) 5.26 5.57 5.61 4.62 5.21 5.26 5.41 5.32 5.31 5.30 5.25 5.16 5.09 5.12 5.22 5.11 Aniline 2 𝐴1 ( 𝜋 → 𝜋 ★) 5.87 6.19 6.12 5.27 5.85 5.86 5.99 5.91 5.90 5.90 5.86 5.79 5.74 5.76 5.80 5.64 Azulene 2 𝐴1 ( 𝜋 → 𝜋 ★) 3.89 4.14 4.37 3.27 3.93 3.94 4.02 3.98 3.98 3.92 3.88 3.86 3.65 3.75 3.57 3.45 2 𝐵2 ( 𝜋 → 𝜋 ★) 4.55 4.78 5.23 4.05 5.14 4.69 4.82 4.69 4.68 4.61 4.52 4.67 4.45 4.56 4.64 4.40 Benzonitr ile 1 𝐴2 ( 𝜋CN → 𝜋 ★) 7.10 7.85 7.52 6.76 7.69 7.32 7.33 7.17 7.16 7.15 7.08 7.28 6.77 7.03 7.03 6.58 Benzothiadiazole 1 𝐵2 ( 𝜋 → 𝜋 ★) 4.37 4.74 5.03 3.79 4.37 4.47 4.63 4.45 4.44 4.40 4.30 4.46 4.04 4.25 4.16 3.89 Dimeth y laminobenzonitr ile 2 𝐴1 ( 𝜋 → 𝜋 ★) 4.94 5.26 5.33 4.20 4.92 4.85 5.10 5.00 4.99 4.99 4.93 4.73 4.87 4.80 4.97 4.89 Dimeth y laniline 1 𝐵2 ( 𝜋 → 𝜋 ★) 4.47 4.67 4.90 3.92 4.22 4.49 4.66 4.54 4.55 4.53 4.48 4.47 4.51 4.49 4.78 4.56 2 𝐴1 ( 𝜋 → 𝜋 ★) 5.54 5.95 5.85 4.85 5.63 5.44 5.68 5.59 5.58 5.58 5.53 5.35 5.52 5.44 5.58 5.42 Dipeptide 7 𝐴 00( 𝑛1 → 𝜋 ★) 2 8.15 9.51 9.01 7.48 9.37 7.89 8.92 8.37 8.33 8.31 8.04 7.82 9.22 8.52 9.03 8.59 𝛽-Dipetide 7 𝐴 0( 𝜋1 → 𝜋 ★)2 8.51 8.60 9.00 7.96 8.44 8.34 8.90 8.63 8.59 𝑎 8.59 8.46 𝑏 8.30 8.88 8.59 9.12 8.84 10 𝐴 00( 𝑛1 → 𝜋 ★)2 8.90 9.71 9.63 8.16 9.67 8.52 9.58 9.14 9.08 𝑎 9.02 8.78 𝑏 8.45 9.76 𝑐 9.10 9.67 9.38 Hydrog en Chlor ide 1 Π ( 𝑛 → 𝜎 ★) 8.10 8.32 7.98 8.05 8.07 8.28 8.18 8.10 8.10 8.12 8.11 8.30 8.02 8.16 8.41 7.72 Nitroaniline 2 𝐴1 ( 𝜋 → 𝜋 ★) 4.57 4.75 5.15 3.85 4.36 4.55 4.80 4.67 4.65 4.61 4.51 4.44 4.42 4.43 4.55 4.47 Nitrobenzene 2 𝐴1 ( 𝜋 → 𝜋 ★) 5.57 5.93 6.11 4.95 5.57 5.63 5.77 5.67 5.64 5.59 5.52 5.55 5.31 5.43 5.47 5.25 Nitrodimeth y laniline 2 𝐴1 ( 𝜋 → 𝜋 ★) 4.28 4.44 4.89 3.47 4.06 4.18 4.53 4.39 4.37 4.33 4.22 4.05 4.21 4.13 4.30 4.28 Nitrop yr idine N-Oxide 2 𝐴1 ( 𝜋 → 𝜋 ★) 4.24 4.26 4.71 2.88 4.52 4.10 4.46 4.31 4.28 4.24 𝑑 4.13 𝑑 3.62 4.17 3.90 3.85 4.05 N-Phen y lp yr role 2 𝐵2 ( 𝜋 → 𝜋 ★) 5.53 5.98 6.06 5.08 5.62 5.55 5.84 5.62 5.61 5.60 5.50 5.57 5.46 5.52 5.59 5.29 3 𝐴1 ( 𝜋 → 𝜋 ★) 6.04 6.35 6.76 5.66 6.23 6.02 6.52 6.18 6.16 6.14 5.97 6.07 6.16 6.11 6.35 6.03 Phthalazine 1 𝐴2 ( 𝑛 → 𝜋 ★) 3.93 4.31 4.47 3.24 3.91 3.78 4.26 4.05 4.04 4.03 3.89 3.79 4.19 3.99 4.39 3.92 1 𝐵1 ( 𝑛 → 𝜋 ★) 4.34 4.75 4.93 3.61 4.27 4.22 4.64 4.46 4.46 4.43 4.32 4.23 4.49 4.36 4.73 4.28 Quino x aline 1 𝐵2 ( 𝜋 → 𝜋 ★) 4.74 5.17 5.32 4.05 4.92 4.66 5.00 4.82 4.81 4.79 4.69 4.65 4.64 4.64 4.53 4.28 3 𝐴1 ( 𝜋 → 𝜋 ★) 5.75 5.90 6.36 5.23 5.43 5.83 6.01 5.86 5.86 5.84 5.76 5.82 5.59 5.71 6.83 5.70 2 𝐵1 ( 𝑛 → 𝜋 ★) 6.33 6.81 7.13 5.79 6.45 6.17 6.87 6.50 6.49 6.48 6.26 6.25 6.79 6.52 6.88 6.42 T wis ted DMABN 1 𝐴2 ( 𝑛 → 𝜋 ★) 4.17 3.82 4.55 3.36 3.49 3.89 4.41 4.23 4.23 4.25 4.15 3.84 4.56 4.20 4.61 4.32 1 𝐵1 ( 𝑛 → 𝜋 ★) 4.84 4.38 5.33 4.07 4.12 4.50 5.19 4.91 4.91 4.95 4.81 4.50 5.40 4.95 5.34 5.05 T wis ted PP 2 𝐵2 ( 𝜋 → 𝜋 ★) 5.73 5.55 6.37 5.23 5.35 5.64 6.10 5.79 5.79 5.80 5.67 5.67 5.87 5.77 6.04 5.65 2 𝐴1 ( 𝜋 → 𝜋 ★) 5.82 6.09 6.41 5.41 5.81 5.78 6.18 5.92 5.91 5.89 5.76 5.82 5.93 5.87 6.07 5.80 1 𝐴2 ( 𝜋 → 𝜋 ★) 6.04 5.90 6.63 5.43 5.56 5.92 6.35 6.11 6.11 6.12 6.01 5.90 6.24 6.07 6.41 6.04 1 𝐵1 ( 𝜋 → 𝜋 ★) 6.28 6.16 6.86 5.69 5.91 6.14 6.61 6.41 6.38 6.36 6.24 6.13 6.57 6.35 6.60 6.27 MSE 0.27 0.53 -0.62 0.01 -0.06 0.30 0.10 0.08 0.07 -0.04 -0.11 0.09 -0.01 0.22 -0.08 MSE (s trong CT) 0.23 0.60 -0.67 -0.02 -0.14 0.37 0.12 0.10 0.09 -0.05 -0.19 0.25 0.03 0.31 0.03 MAE 0.35 0.53 0.62 0.27 0.12 0.30 0.10 0.08 0.07 0.04 0.16 0.25 0.11 0.32 0.20 MAE (s trong CT) 0.37 0.60 0.67 0.34 0.15 0.37 0.12 0.10 0.09 0.05 0.19 0.30 0.11 0.38 0.16 SDE 0.35 0.19 0.21 0.40 0.14 0.16 0.05 0.04 0.04 0.03 0.18 0.33 0.14 0.35 0.25 RMSE 0.43 0.56 0.65 0.40 0.15 0.33 0.11 0.09 0.08 0.05 0.21 0.34 0.13 0.41 0.26 Max( +) 1.36 0.86 -0.05 1.22 0.22 0.77 0.24 0.18 0.16 0.01 0.20 1.07 0.37 1.08 0.48 Max( − ) -0.46 -0.12 -1.36 -0.72 -0.38 0.08 0.00 0.00 0.02 -0.12 -0.62 -0.33 -0.34 -0.39 -0.52 𝑎Basis set e xtrapolated CCSDR(3)/cc-pVTZ v alues from R ef. 68 ; 𝑏CC3/cc-pVDZ v alue cor rected b y the difference betw een CCSDT -3/cc-pVTZ and CCSDT -3/cc-pVDZ v alues; 𝑐ADC(3)/cc-pVDZ v alue cor rected b y the difference betw eenADC(2)/cc-pVTZ and ADC(2)/cc-pVDZ v alues; 𝑑N ot included in the benc hmark statis tics.
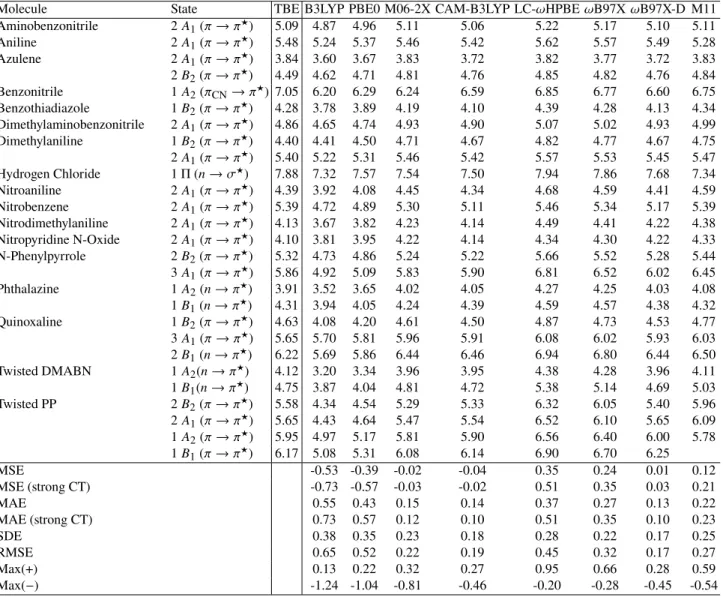
Table 3: TD-DFT transition energies (in eV) obtained with the aug-cc-pVQZ basis set. Statistical quantities are reported at the bottom of the Table. See caption of Table of2for more details.
Molecule State TBE B3LYP PBE0 M06-2X CAM-B3LYP LC-𝜔HPBE 𝜔B97X 𝜔B97X-D M11 Aminobenzonitrile 2 𝐴1(𝜋 → 𝜋 ★ ) 5.09 4.87 4.96 5.11 5.06 5.22 5.17 5.10 5.11 Aniline 2 𝐴1(𝜋 → 𝜋 ★ ) 5.48 5.24 5.37 5.46 5.42 5.62 5.57 5.49 5.28 Azulene 2 𝐴1(𝜋 → 𝜋 ★ ) 3.84 3.60 3.67 3.83 3.72 3.82 3.77 3.72 3.83 2 𝐵2(𝜋 → 𝜋 ★ ) 4.49 4.62 4.71 4.81 4.76 4.85 4.82 4.76 4.84 Benzonitrile 1 𝐴2(𝜋CN→ 𝜋 ★ ) 7.05 6.20 6.29 6.24 6.59 6.85 6.77 6.60 6.75 Benzothiadiazole 1 𝐵2(𝜋 → 𝜋 ★ ) 4.28 3.78 3.89 4.19 4.10 4.39 4.28 4.13 4.34 Dimethylaminobenzonitrile 2 𝐴1(𝜋 → 𝜋 ★ ) 4.86 4.65 4.74 4.93 4.90 5.07 5.02 4.93 4.99 Dimethylaniline 1 𝐵2(𝜋 → 𝜋 ★ ) 4.40 4.41 4.50 4.71 4.67 4.82 4.77 4.67 4.75 2 𝐴1(𝜋 → 𝜋 ★ ) 5.40 5.22 5.31 5.46 5.42 5.57 5.53 5.45 5.47 Hydrogen Chloride 1 Π (𝑛 → 𝜎★) 7.88 7.32 7.57 7.54 7.50 7.94 7.86 7.68 7.34 Nitroaniline 2 𝐴1(𝜋 → 𝜋 ★ ) 4.39 3.92 4.08 4.45 4.34 4.68 4.59 4.41 4.59 Nitrobenzene 2 𝐴1(𝜋 → 𝜋 ★ ) 5.39 4.72 4.89 5.30 5.11 5.46 5.34 5.17 5.39 Nitrodimethylaniline 2 𝐴1(𝜋 → 𝜋 ★ ) 4.13 3.67 3.82 4.23 4.14 4.49 4.41 4.22 4.38 Nitropyridine N-Oxide 2 𝐴1(𝜋 → 𝜋 ★ ) 4.10 3.81 3.95 4.22 4.14 4.34 4.30 4.22 4.33 N-Phenylpyrrole 2 𝐵2(𝜋 → 𝜋 ★ ) 5.32 4.73 4.86 5.24 5.22 5.66 5.52 5.28 5.44 3 𝐴1(𝜋 → 𝜋 ★ ) 5.86 4.92 5.09 5.83 5.90 6.81 6.52 6.02 6.45 Phthalazine 1 𝐴2(𝑛 → 𝜋 ★ ) 3.91 3.52 3.65 4.02 4.05 4.27 4.25 4.03 4.08 1 𝐵1(𝑛 → 𝜋 ★ ) 4.31 3.94 4.05 4.24 4.39 4.59 4.57 4.38 4.32 Quinoxaline 1 𝐵2(𝜋 → 𝜋 ★ ) 4.63 4.08 4.20 4.61 4.50 4.87 4.73 4.53 4.77 3 𝐴1(𝜋 → 𝜋 ★ ) 5.65 5.70 5.81 5.96 5.91 6.08 6.02 5.93 6.03 2 𝐵1(𝑛 → 𝜋 ★ ) 6.22 5.69 5.86 6.44 6.46 6.94 6.80 6.44 6.50 Twisted DMABN 1 𝐴2(𝑛 → 𝜋 ★ ) 4.12 3.20 3.34 3.96 3.95 4.38 4.28 3.96 4.11 1 𝐵1(𝑛 → 𝜋 ★ ) 4.75 3.87 4.04 4.81 4.72 5.38 5.14 4.69 5.03 Twisted PP 2 𝐵2(𝜋 → 𝜋 ★ ) 5.58 4.34 4.54 5.29 5.33 6.32 6.05 5.40 5.96 2 𝐴1(𝜋 → 𝜋 ★ ) 5.65 4.43 4.64 5.47 5.54 6.52 6.10 5.65 6.09 1 𝐴2(𝜋 → 𝜋 ★ ) 5.95 4.97 5.17 5.81 5.90 6.56 6.40 6.00 5.78 1 𝐵1(𝜋 → 𝜋 ★ ) 6.17 5.08 5.31 6.08 6.14 6.90 6.70 6.25 MSE -0.53 -0.39 -0.02 -0.04 0.35 0.24 0.01 0.12 MSE (strong CT) -0.73 -0.57 -0.03 -0.02 0.51 0.35 0.03 0.21 MAE 0.55 0.43 0.15 0.14 0.37 0.27 0.13 0.22 MAE (strong CT) 0.73 0.57 0.12 0.10 0.51 0.35 0.10 0.23 SDE 0.38 0.35 0.23 0.18 0.28 0.22 0.17 0.25 RMSE 0.65 0.52 0.22 0.19 0.45 0.32 0.17 0.27 Max(+) 0.13 0.22 0.32 0.27 0.95 0.66 0.28 0.59 Max(−) -1.24 -1.04 -0.81 -0.46 -0.20 -0.28 -0.45 -0.54