Publisher’s version / Version de l'éditeur:
PERD/CHC, 2001-11
READ THESE TERMS AND CONDITIONS CAREFULLY BEFORE USING THIS WEBSITE.
https://nrc-publications.canada.ca/eng/copyright
Vous avez des questions? Nous pouvons vous aider. Pour communiquer directement avec un auteur, consultez la
première page de la revue dans laquelle son article a été publié afin de trouver ses coordonnées. Si vous n’arrivez pas à les repérer, communiquez avec nous à PublicationsArchive-ArchivesPublications@nrc-cnrc.gc.ca.
Questions? Contact the NRC Publications Archive team at
PublicationsArchive-ArchivesPublications@nrc-cnrc.gc.ca. If you wish to email the authors directly, please see the first page of the publication for their contact information.
For the publisher’s version, please access the DOI link below./ Pour consulter la version de l’éditeur, utilisez le lien DOI ci-dessous.
https://doi.org/10.4224/12328729
Access and use of this website and the material on it are subject to the Terms and Conditions set forth at
Friction of sea ice on various construction materials Frederking, Robert; Barker, Anne
https://publications-cnrc.canada.ca/fra/droits
L’accès à ce site Web et l’utilisation de son contenu sont assujettis aux conditions présentées dans le site LISEZ CES CONDITIONS ATTENTIVEMENT AVANT D’UTILISER CE SITE WEB.
NRC Publications Record / Notice d'Archives des publications de CNRC:
https://nrc-publications.canada.ca/eng/view/object/?id=2e69df5e-4cdb-4492-9003-aa73fa17ccbb https://publications-cnrc.canada.ca/fra/voir/objet/?id=2e69df5e-4cdb-4492-9003-aa73fa17ccbb
Friction of Sea Ice on Various Construction Materials
R. Frederking and A. Barker Canadian Hydraulics Centre National Research Council of Canada
Ottawa, Ont. K1A 0R6 Canada
Technical Report HYD-TR-67 PERD/CHC 3-49
Friction of Sea Ice on Various
Construction Materials HYD-TR-067 i
ABSTRACT
A series of tests was performed at the Canadian Hydraulics Centre to investigate friction between sea ice and various materials such as concrete, steel, wood and ice. The tests examined the effects of the change in the friction coefficient corresponding with the deterioration of material surface, speed, temperature, surface wetness and normal pressure. A carriage translated an ice specimen back and forth relative to samples of various construction materials fixed to the tank floor, while measuring the normal and tangential forces between the ice and the sample surface. Results from the test series indicated that friction was higher at lower speeds and also on rough materials. There was a great deal of variability observed in the instantaneous values of the coefficient of friction. Temperature had a weak effect on the friction coefficient, with slightly higher values of friction at higher temperatures, and there was a weak trend of lower friction with higher contact pressures. The average coefficient of friction of sea ice on smooth concrete, painted steel and sea ice was about 0.05 for speeds greater than 5 cm/s and increased to about 0.1 at 1 cm/s. The average coefficient of friction of sea ice on rough concrete and corroded steel was about 0.1 at speeds greater than 10 cm/s and increased to 0.2 at 1 cm/s.
TABLE OF CONTENTS
ABSTRACT ...i
TABLE OF CONTENTS...ii
TABLE OF FIGURES ...iii
1. INTRODUCTION...1
2. TEST EQUIPMENT AND PROCEDURES...1
2.1 Apparatus...1
2.2 Instrumentation...4
2.3 Sample preparation...6
2.3.1 Ice specimens...6
2.3.2 Concrete samples (Series 1)...7
2.3.3 Other samples (Series 2) ... 14
2.4 Testing procedure... 14
3. RESULTS ... 15
3.1 Description of Tests... 15
3.2 Example of Test Results... 17
3.3 Summary of Results... 20
3.3.1 Constant Speed Tests... 21
3.3.2 Varying Speed Tests ... 30
4. Summary and Discussion ... 32
5. Acknowledgements... 33
Friction of Sea Ice on Various
Construction Materials HYD-TR-067 iii
TABLE OF FIGURES
Figure 1 Arrangements for friction testing in the environmental chamber ...2
Figure 2 Side view of test apparatus ...2
Figure 3 Front view of test apparatus ...3
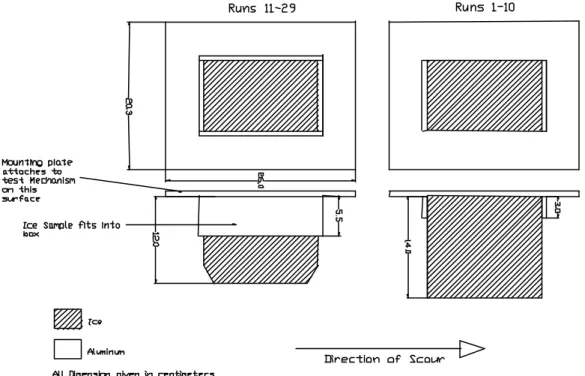
Figure 4 Mounting plate and ice specimen geometry ...4
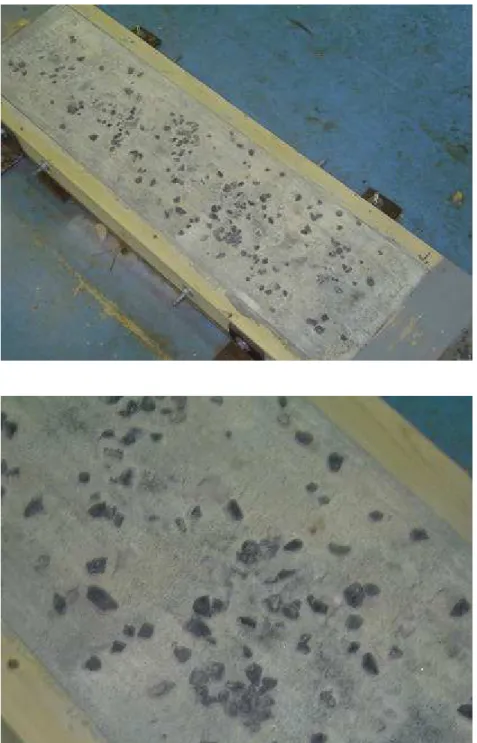
Figure 5 Photos of mounting plate and ice specimen ...5
Figure 6 General test arrangement with samples on tank floor ...6
Figure 7 Smooth concrete, sample #1...8
Figure 8 Rough concrete, sample #2...9
Figure 9 Rough concrete, sample #3... 10
Figure 10 Rough concrete, sample #4... 11
Figure 11 Broomed concrete, sample #5 ... 12
Figure 12 Test Sample layout... 13
Figure 13 Time series of Test Run 12 – Pass 1; 5 cm/s, 65 kPa contact pressure, -6o C ... 18
Figure 14 Time series of Test Run 12 – Pass 1; normal force and vertical displacement... 19
Figure 15 Time series of Test Run 12 – Pass 1, Sample #2; forces and accelerations in vertical and horizontal directions ... 19
Figure 16 Test Run 12; 5 cm/s, 65 kPa contact pressure, -6o C. Average values of friction coefficient for each pass and sample. ... 20
Figure 17 Stage 1, average value of friction coefficient as a function of speed, (a) 65 kPa normal pressure, and (b) 130 kPa normal pressure. ... 23
Figure 18 Stage 2, average value of friction coefficient as a function of speed, 65 kPa, -2o C.... 24
Figure 19 Stage 4, average value of friction coefficient as a function of speed, 130 kPa, -2o C.. 25
Figure 20 Stage 5, average value of friction coefficient as a function of speed, 65 kPa, -10o C.. 25
Figure 21 Effect of temperature and speed on each of the Series 1 samples, 65 kPa normal pressure. ... 26
Figure 22 Effect of temperature and wetting on average friction coefficient of each of the Series 1 samples, 65 kPa normal pressure, (a) 5 cm/s and (b) 10 cm/s. ... 27
Figure 23 Series 2 samples, effect of speed on average friction coefficient... 28
Figure 24 Comparison of speed effect on average friction of the smooth concrete, sample #1, for Series 1Stage 4 and Series 2 Stage 8. ... 28
Figure 25 Comparison of speed effect on average friction of corroded steel and rough concrete, Sample #2. ... 29
Figure 26 Pressure effect on average friction for Series 2 samples, 20 cm/s. ... 29
Figure 27 Test Run 36 – pass 1, decreasing speed to a stop on painted steel sample. ... 30
Figure 28 Test Run 36 – pass 1, increasing speed from stop on painted steel sample. ... 31
Figure 29 Test Run 36 – pass 1, comparison of friction coefficient as a function of speed for decreasing and increasing speed tests on painted steel sample. ... 32
Friction of Sea Ice on Various
Construction Materials HYD-TR-067 1
Friction of Sea Ice on Various Construction Materials
1. INTRODUCTION
Friction is an important matter in determining the force that ice can exert on a sloping structure. There is almost a one-to-one relation between friction and force, so it is not a factor to be taken lightly in estimating ice forces on sloping structures. Friction between ice and various materials has interested scientists and engineers for some time. Extensive testing has been conducted for sea ice on various construction materials in Japan (Saeki et al, 1986). The test results reported here duplicate the conditions of some of the Japanese tests for comparison purposes but extend the test conditions to examine the effects of change in friction with deterioration of material surface, due to abrasion or corrosion. In this study, the effect of material, speed, temperature, surface wetness and normal pressure were examined.
2. TEST EQUIPMENT AND PROCEDURES
2.1 Apparatus
The tests were performed in the Ice Tank at the NRC Canadian Hydraulics Centre. The tank is 21m long, 7m wide and 1.2m deep, and is equipped with a 50 kN capacity towing carriage that spans the width of the tank. The tank is located in an environmental chamber where the air temperature can be maintained at a fixed value in the range of 10o to –20o C. The concept of the tests was to use the carriage to translate an ice specimen back and forth relative to samples of various construction materials fixed to the tank floor, while measuring the normal and tangential forces between the ice and the sample surface. There was no water in the tank to facilitate access to the test apparatus and samples. Figure 1 is a schematic of the test set up.
The loading apparatus consisted of a strut attached to the front of the carriage and a parallel-arm linkage designed to keep a carrier (yellow member in Figure 2) at a constant attitude relative to test sample surfaces. A hydraulic actuator raised or lowered the carrier, and through a pressure control valve could apply a constant downward pressure. Figures 2 and 3 present side and front views of the testing mechanism and its instrumentation. A hydraulic pump located outside the environmental chamber provided pressurized oil to the actuator through flexible hydraulic hoses. These allowed the carriage to move back and forth in the tank. The hydraulic pressure applied to the actuator through the pressure control valve could be manually adjusted to a desired value. A control box on the carriage directed oil flow to one side of the actuator or the other, to raise and lower the carrier.
Figure 1 Arrangements for friction testing in the environmental chamber Dynamometer (Ice Sample mounts underneath) Accelerometers Hydraulic Piston/Linear Displacement Transducer
Friction of Sea Ice on Various
Construction Materials HYD-TR-067 3
Figure 3 Front view of test apparatus
The ice specimens were frozen to aluminum mounting plates that were specially designed to hold the ice firmly. The mounting plates were attached to the bottom of the carrier using a set of guide rails and a clamping mechanism that facilitated easy insertion and removal of the ice specimen and mounting plate assembly. The mounting plate and ice specimen assembly are illustrated in Figure 4 (dimensions) and Figure 5 (photos).
In order to provide a visual record of the tests, a Super-VHS video camera and light were mounted on the end of a strut that was bolted to the carriage. The camera was about 1.4 m from the test samples.
Test samples were bolted along the length of the tank floor. The small distances between the samples were bridged using pieces of painted plywood strips. At either end of the test samples, painted plywood run-out strips were provided for
accelerating the carriage up to test speed and slowing it at the end. The elevations of the samples and run-out strips were surveyed and shimmed to ensure they are level to within ± 0.5 mm. The overall layout is illustrated in Figure 6.
2.2 Instrumentation
The primary instrument for measuring the frictional forces was a 6-component dynamometer (Advanced Mechanical Technologies Inc. MC6-4000), attached to the bottom of the carrier. It had a load capacity of 20 kN in the normal direction and 10 kN in the two transverse directions. The ice specimen and mounting plate were attached directly to the bottom of the dynamometer through the clamping mechanism described previously. The dynamometer measured the normal force, transverse force in the direction of motion and the lateral force perpendicular to the direction of motion, as well as the three associated moments. A linear displacement transducer measured the vertical displacement of the carrier and thus gave an indication of the wearing away of the ice specimen during a test. Three accelerometers (Sundstrand QA-700 Q-Flex Servo) mounted along the centre-line of the base plate of the carrier measured the dynamic response of the carrier and ice specimen.
The coordinate system used in the experiments had the z-axis vertical, the x-axis horizontal in the longitudinal direction (the length of the tank) and the y-axis also horizontal but perpendicular to the x-axis (using the right hand rule).
Friction of Sea Ice on Various
Construction Materials HYD-TR-067 5
Figure 6 General test arrangement with samples on tank floor
A tachometer on the electric drive motor on the carriage provided a measure of carriage speed. There was also an optical counter on the final drive gear of the carriage that measured each rotation of the shaft, from which speed could be calculated.
The instruments were connected to a NEFF Instruments System 100 signal conditioner that sampled and digitized the signals. During the sampling an analogue low pass filter with a cut-off frequency of 30 Hz was applied to prevent aliasing. The digitized signals were recorded on a Digital VAX AlphaStation computer using GEDAP software (Miles, 1990). The normal scan rate was 50 Hz, but for very fast or slow tests, scan rate was adjusted accordingly.
2.3 Sample preparation
2.3.1 Ice specimens
Coarse-grained salt was mixed with tap water in a plastic basin measuring 570 mm by 460 mm by 190 mm deep. The salinity of the solution was about 7.5 parts per thousand (ppt). This results in an ice specimen with a salinity of about 5 ppt, a value comparable to natural sea ice. A fine, plastic square mesh (0.5 mm diameter and
Friction of Sea Ice on Various
Construction Materials HYD-TR-067 7
12.5 mm spacing) was placed in vertically oriented layers in the brine solution. The purpose of the mesh was to add tensile strength to the ice without affecting the friction.
The basin containing the solution was then placed in a freezer at –25o C for about 3 days. The grain structure of the ice grown in the basin simulated that of naturally grown sea ice. The basin was moved from the freezer to a cold room maintained at about – 10oC, and the ice removed from the basin. The bottom of the ice block usually had a slushy layer that was cut off. The ice block was cut vertically into 4 strips using a handsaw. These strips where then cut vertically in half, and trimmed to specimen dimensions using a band saw in the cold room. (See Figure 4 for final sample dimensions). Note that the first 10 specimens were rectangular prisms 140 mm high. It was found that the ice specimens tended to fracture during the test runs, so several measures were taken to reduce this. A plastic mesh was included in the ice, as already described, specimen height was reduced to 120 mm, leading and trailing edges of the specimen were beveled, and the height of the aluminum sample box was heightened and sides put on it. The ice specimens were always cut so that the bottom of the specimens corresponded to the bottom of the original ice block.
2.3.2 Concrete samples (Series 1)
Wooden boxes of length 1 m, width of 260 mm and depth of 90 mm (inside dimensions) where fabricated. The bottom of each box was 12 mm plywood. Two 6 mm threaded steel rods where bolted through each box to reinforce the box and facilitate subsequent handling. A 100 mm grid steel mesh was wired to the rods. Bagged concrete mix with aggregate up to about 8 mm diameter was used. The type of concrete and surface finish were as follows:
Sample #1: Smooth towelled surface.
Sample #2: Rough surface; coarse angular aggregate 10 to 20 mm diameter added to concrete during mixing, surface pressure washed about 1 hour after placing to expose aggregate.
Sample #3: Rough surface; pieces of angular aggregate 10 to 20 mm diameter were pressed into a broomed surface before the concrete hardened.
Sample #4: Rough surface; pieces of angular aggregate 10 to 20 mm diameter were pressed into a smooth surface before the concrete hardened. Sample #5: Broomed surface finish, no inclusions added
Photographs of each concrete sample surface are shown in Figures 7 through 11. The dimensions and layout of the samples is shown in Figure 12, with sample description on the left hand side for Series 1.
Friction of Sea Ice on Various
Construction Materials HYD-TR-067 9
Friction of Sea Ice on Various
Construction Materials HYD-TR-067 11
Friction of Sea Ice on Various
Construction Materials HYD-TR-067 13
Figure 12 Test Sample layout N
Sample Type > 260 < Sample Type
Smooth Concrete #1 1000 #1 Smooth Concrete
100
Pressure washed concrete #2 1000 #2 Smooth steel, painted
100
1000 #3 Corroded steel
100
1000 #4 Wood
100
Broomed concrete #5 1000 #5 Saline ice
S
Series 1 Series 2
Angular agregate pressed into a broomed surface #3
2.3.3 Other samples (Series 2)
The type of sample and surface finish were as follows: Sample #1: Same sample from Series 1 as a control. Sample #2: Smooth steel, painted.
Sample #3: Heavily corroded steel, unpainted.
Sample #4: Fir plywood with grain orientation parallel to direction of motion. Sample #5: Saline ice.
The right hand side of Figure 12 shows the arrangement of samples for Series 2. 2.4 Testing procedure
The environmental chamber refrigeration system was set to maintain the desired temperature for the test series. The chamber was left at this temperature for several hours prior to testing to allow the concrete samples to reach an equilibrium temperature.
The aluminum mounting plate was cooled in the freezer, and then moved to the cold room. The ice specimen was placed in the box on the mounting plate, and tap water was injected between the ice specimen and the box. After the ice specimen had frozen to the mounting plate, it was moved to the environmental chamber and warmed to the chamber temperature.
Shortly before beginning the test, the ice specimen’s pre-test dimensions and surface temperature were measured and recorded. The temperature of the concrete or other material samples was also recorded.
The hydraulic system was started, the desired hydraulic pressure set, and the carrier raised. The mounting plate with ice specimen frozen to it was installed beneath the dynamometer using the mounting rails and clamping mechanism. A set of zero-offset readings was taken on the data acquisition (DA) system. The DA system was started, the video camera switched on, the carriage motor started, and the carriage brought up to test speed. Just before the carriage reached the samples, the carrier was lowered and normal force was applied to the ice specimen. Speed was maintained constant until the ice specimen had passed over all of the samples, then the carrier was raised and the carriage stopped.
The carriage was again started and brought up to speed in the opposite direction to start the second pass. The carrier was again lowered just before reaching the
Friction of Sea Ice on Various
Construction Materials HYD-TR-067 15
samples. To complete the test, this process was repeated again without changing the carriage speed, pressure setting for the hydraulic system or ice specimen. This made for a total of 4 passes per test run. Normally a test run started at the north end of the test tank, but in some cases it started at the south end.
After the test run had been completed, the ice specimen was removed from the test mechanism. The post-test ice temperature and specimen dimensions were measured and recorded. The remaining ice was removed from the mounting plate and allowed to melt in a covered container. The salinity of the melt water was measured and recorded as the specimen salinity.
Between each test run the samples were swept with a stiff bristled broom to remove any ice particles. No cleaning of the sample surface was done between individual passes.
3. RESULTS
3.1 Description of Tests
In total, 38 test runs were performed in 8 stages. Every test run proceeded until there was not enough ice left or until 4 passes had been completed. A summary of the test parameters is presented in Table 1. Tests that were started at the north end of the tank ran towards the south end of the tank, are noted with an “s” in column labelled “Dir” (direction) of Table 1. The sign convention for speed with motion from north to south is positive. The horizontal frictional force, Fx, resisting motion in the
x-direction is negative. The coefficient of friction, f , is defined by:
F
F
y x
f = (1)
Ten tests were performed in the first stage. They were of an exploratory nature, looking at the effects of pressure and carriage speed on the ice specimen and friction. Hydraulic pressures of 5 MPa (65 kPa ice pressure) and 10 MPa (130 kPa ice pressure) were used. The chamber temperature was set to -5o C, and test
speeds investigated were 1, 5, 10, 15, and 45 cm/s. Most of the runs began at the north end of the tank and proceeded in a southerly direction. Two runs were repeated beginning at the southern end of the tank, with the first pass proceeding north. The purpose of these tests was to assure that the friction data were not dependent on the direction of the tests.
Six runs were performed in the second stage. Runs from the previous stage were repeated using the modified specimen mounting plate discussed earlier. Shorter ice specimens with ends beveled at 30o, and layers of plastic mesh frozen in
vertically along their axis, were used with the new mounting plates. These modifications were made to resolve problems with ice specimens fracturing or crushing at 130 kPa. It was also decided that the 45 cm/s test speed would be eliminated from future tests since there was little difference between the friction coefficient measured at 15 or 45 cm/s.
Table 1 Test Conditions
Two runs were performed in the third stage that repeated two runs from the second stage but at a slightly higher temperature (-4o C). The specimens used from this stage onward had a lower salinity; 5 ppt was the target salinity to more accurately model sea ice. Also, from this point onwards, a normal ice pressure of 65 kPa was used to minimize failure of the ice specimens.
Run Dir # of Hydraulic Speed Ice Sample Initial Footprint Final
passes Pressure Initial Final Salinity temp Height Length Width Area Height Length Width (psi) (cm/s) o C o C
(ppt) o C (cm) (cm) (cm) (cm²) (cm) (cm) (cm) Stage 1: Preliminary testing
1 s 1 5 5.0 - - 6.4 - 13.3 15.2 9.8 148.96 12.7 - -2 s 4 5 5.0 -4.5 -4.2 5.0 -4.6 14.0 15.8 9.5 150.1 9.0 - -3 s 4 5 15.0 -5.5 -5.4 5.4 -5.1 14.7 15.7 9.5 149.15 10.0 - -4 s 4 5 45.0 -6.2 -5.7 6.4 -4.7 14.7 15.8 9.5 150.1 10.7 - -5 s 4 5 1.0 -5.0 -4.1 5.7 -4.6 13.5 15.4 9.3 143.22 9.2 - -6 s 1 10 5.0 -5.0 -5.0 7.0 -4.3 14.0 15.7 9.0 141.3 6.6 - -7 n 3 10 5.0 -5.0 -4.9 6.4 - 13.9 15.8 9.1 143.78 7.0 - -8 s 2 10 15.0 -6.8 -6.5 6.1 -4.5 13.8 15.5 9.4 145.7 6.2 - -9 n 1 10 15.0 -5.8 -5.8 5.6 -5.4 14.4 15.5 9.0 139.5 6.4 - -10 s 2 10 45.0 -6.3 -6.2 7.6 -5.3 13.8 15.6 9.1 141.96 6.1 - -Stage 2: Modified sample holder, fine mesh frozen into ice sample for added strength (used from now on)
11 s 4 5 1.0 -5.0 -5.0 5.1 -4.8 12.0 14.5 8.5 123.25 9.5 - -12 s 4 5 5.0 -5.4 -5.2 6.4 -6.5 12.0 14.0 8.7 121.8 7.8 - -13 s 4 10 1.0 -4.9 -5.0 7.7 -5.5 12.0 15.4 9.5 146.3 6.7 - -14 n 4 10 5.0 -5.2 -5.1 7.7 -5.9 12.0 14.5 9.5 137.75 7.0 - -15 s 4 10 10.0 -5.3 -5.4 4.5 -6.3 12.0 15.4 9.6 147.84 6.9 - -16 s 4 10 20.0 -5.2 -5.3 5.1 -6.2 12.2 15.2 9.4 142.88 7.0 - -Stage 3: Higher temperature tests, also lower salinity ice samples used from now on
17 s 4 5 1.0 -3.5 -4.0 3.8 -4.1 12.2 15.3 9.4 143.82 10.4 9.0 5.0 18 s 4 5 10.0 -3.6 -3.9 4.1 -4.7 12.3 15.4 9.4 144.76 8.1 9.5 7.0 Stage 4: High temperature tests
19 s 4 5 1.0 -1.5 -1.6 2.5 -2.7 12.4 15.4 9.5 146.3 10.4 9.0 8.0 20 s 4 5 5.0 -1.7 -1.4 4.1 -2.5 12.0 15.5 9.5 147.25 10.1 15.0 8.5 21 s 4 5 10.0 -2.4 -1.8 3.2 -2.3 12.0 15.5 9.3 144.15 7.1 14.0 9.0 22 s 4 5 20.0 -2.6 -1.8 3.2 -2.6 12.0 15.4 9.4 144.76 7.8 13.0 8.0 Stage 5: Low temperature tests
23 s 4 5 1.0 -11.3 -10.1 4.1 -10.8 12.0 15.5 9.3 144.15 9.6 7.0 9.0 24 s 4 5 5.0 -11.2 -9.7 3.5 -10.6 12.0 15.5 9.3 144.15 10.3 8.0 5.0 25 s 4 5 10.0 -9.2 -8.5 4.1 -10.2 12.0 15.5 9.3 144.15 8.7 13.0 7.0 26 s 4 5 20.0 -8.9 -8.4 3.3 -10.3 11.8 15.4 9.3 143.22 9.0 11.0 4.0 Stage 6: High Temperature tests, concrete samples were wet with brine before testing
27 s 4 5 5.0 -2.2 -2.1 3.8 -1.1 12.4 15.4 9.2 141.68 10.0 5.0 28 s 4 5 10.0 -2.3 -2.1 3.8 -1.6 12.3 15.5 9.3 144.15 10.0 12.0 7.0 Stage 7: Cold ice with warmer concrete samples, concrete samples were wet with brine before testing
29 s 4 700 10.0 -5.0 -5.4 7.7 -2.7 12.0 15.4 9.3 143.22 9.0 13.0 6.0 Stage 8: New set of samples (steel)
30 s 4 5 10.0 -5.8 -5.7 3.0 -5.8 12.0 15.5 9.5 147.25 12.0 12.0 7.0 31 s 4 5/2 20.0 -4.7 -6.0 3.0 12.0 15.5 9.5 147.25 9.3 31b s 4 5/2 20.0 3.0 15.5 9.5 147.25 32 s 4 10 20.0 -4.8 -4.7 3.0 9.3 15.5 9.5 147.25 6.9 33 s 4 5 1.0 -6.1 -6.5 2.0 12.0 15.5 9.5 147.25 11.7 34 s 4 5 5.0 -5.9 -4.6 2.0 11.7 15.5 9.5 147.25 11.5 35 s 4 5 70.0 -4.6 -4.3 3.5 -4.3 12.0 15.5 9.5 147.25 11.7 11.0 7.0 36 s 4 5 var -3.7 -2.5 3.5 -2.0 11.7 15.5 9.5 147.25 37 s 4 10 10.0 -3.1 -2.4 4.0 -1.7 12.0 15.5 9.5 147.25 6.8 Ice temp
Friction of Sea Ice on Various
Construction Materials HYD-TR-067 17
Four runs were performed in the fourth stage, one at each speed, with a higher chamber temperature of –2o C.
Four runs from the fourth stage were repeated in the fifth stage with a lower chamber temperature of –11o C.
Two runs from the third stage were repeated in the sixth stage; to study the effect of wetting the concrete. A brine of salinity 31 ppt and temperature about -1o C was sprayed on the concrete samples immediately before each run.
One test was performed in the seventh stage to investigate the effect of a cold ice specimen (-6o C) on warm wetted concrete samples (-2o C).
An eighth stage was performed with nine test runs on a new set of samples. Sample 1, smooth concrete, was used again as a control and samples of four new materials were used. In this stage, ice pressures of 30 kPa, 65 kPa and 130 kPa were run for a range of speeds, from 1 cm/s to 70 cm/s. In one of the test runs, the effect of slowing the speed to a stop on a sample was explored.
3.2 Example of Test Results
To illustrate the measurements made and the results obtained, Test Run 12 at 5 cm/s will be used as an example. Figure 13 is a time series trace of the normal force (Fz), the frictional force in the direction of motion (Fx) and the coefficient of
friction, f . The vertical lines on the plot indicate the part of the time series where the ice specimen is fully on the sample. It can be seen firstly that the hydraulic control system does not maintain the normal force at a constant value, but does keep it in a range between 0.8 and 0.9 kN in this case. The frictional force varies substantially, even when the normal force is nominally constant. This is not surprising given the roughness of the concrete samples. Mean values of coefficient of friction and standard deviation are indicated on the figure. Mean values ranged from 0.08 to 0.25, depending on the material surface roughness. Individual friction coefficient values were as high as 0.4. The coefficient of variation is generally about 25%. For the smooth concrete (Sample #1), the coefficient of friction is significantly lower than for the other samples.
-0.5 0 0.5 1 0 10 20 30 40 50 60 70 80 90 100 110 Time (s) Fx(kN) Fz (kN) friction coefficient Sample #1 f = 0.079 +/-.020 Sample #2 f = 0.245 +/-0.053 Sample #3 f = 0.186 +/-.061 Sample #4 f = 0.182 +/-.030 Sample #5f = 0.157 +/-.036
Figure 13 Time series of Test Run 12 – Pass 1; 5 cm/s, 65 kPa contact
pressure, -6o C
In addition to forces, the vertical displacement of the carrier was also measured and it is plotted in Figure 14, together with the normal force, Fz. The vertical
displacement is a measure of the abrasion of the ice specimen as it is translated along the concrete samples. The total vertical displacement of the ice specimen in pass 1 was about 0.3 dm (30 mm). The displacement was not progressive in this pass. On Sample 2 at about time 25 s, the ice partially failed and the displacement increased by about 0.15 dm. It can also be observed that at the same time the ice failed, the normal force dropped off and it took about a second for the hydraulic control system to recover and bring the normal force back up to the desired level. For pass 1 over Specimen 2, Figure 15 presents accelerations and forces in the vertical (z) and horizontal (x) directions. Normally the amplitude of the accelerations was small, but in this case significant horizontal and vertical accelerations were generated as the ice specimen passes onto the rough concrete of Sample 2. The frequency of the forces and accelerations is about 4.5 Hz.
Friction of Sea Ice on Various
Construction Materials HYD-TR-067 19
0 0.25 0.5 0.75 1 1.25 0 10 20 30 40 50 60 70 80 90 100 110 Time (s) displacement z (dm) Fz (kN)
Sample #1 Sample #2 Sample #3 Sample #4 Sample #5
Figure 14 Time series of Test Run 12 – Pass 1; normal force and vertical displacement -1 -0.5 0 0.5 1 1.5 20 22 24 26 28 30 32 34 36 38 40 Time (s) Ax (g) Az (g) Fx(kN) Fz (kN) Series2 Sample # 2
Figure 15 Time series of Test Run 12 – Pass 1, Sample #2; forces and accelerations in vertical and horizontal directions
Another way of examining the results is to plot the mean value of the coefficient of friction on each sample for each pass of a test run. An example of this is Figure 16 for Test Run 12; 5 cm/s speed, 55 kPa contact pressure and ~ -6o C temperature. The first pass, from sample #1 to # 5 had the highest values of coefficient of friction. The return, pass 2, starting with Sample #5 to #1 showed lower values of friction coefficient, probably because of ice fragments on the surface left by the first pass. It can also be seen that consistent low friction values for the smooth sample (#1) were apparent, compared to the rough concrete samples (#2, #3, #4 and #5). In the final pass, pass 4, no result is presented for sample #5 since the contact pressure was considerably less than 55 kPa.
0 0.1 0.2 0.3 1 2 3 4 5 Sample # coefficient of friction
pass 1 pass 2 pass 3 pass 4
Figure 16 Test Run 12; 5 cm/s, 65 kPa contact pressure, -6o C. Average
values of friction coefficient for each pass and sample.
3.3 Summary of Results
Test results and conditions are summarized in Table 2. Each test stage will be discussed in turn. While a number of stages of testing are described, this presentation will be divided into two parts, constant speed tests and varying speed tests.
Friction of Sea Ice on Various
Construction Materials HYD-TR-067 21
Table 2 Test Results
Run Dir Speed Ice Sample Footprint
Initial Final Salinity temp pressure Sample 1 Sample 2 Sample 3 Sample 4 Sample 5
(cm/s) o C o C (ppt) o C kPa
Stage 1: Preliminary testing
1 s 5.0 - - 6.4 - 65 0.077 0.251 0.203 0.244 0.196 2 s 5.0 -4.5 -4.2 5.0 -4.6 65 0.066 0.237 0.213 0.201 0.147 3 s 15.0 -5.5 -5.4 5.4 -5.1 65 0.044 0.183 0.163 0.180 0.083 4 s 45.0 -6.2 -5.7 6.4 -4.7 65 0.065 0.176 0.146 0.152 0.074 5 s 1.0 -5.0 -4.1 5.7 -4.6 65 0.137 0.235 0.196 0.218 0.172 6 s 5.0 -5.0 -5.0 7.0 -4.3 130 0.069 0.251 - - -7 n 5.0 -5.0 -4.9 6.4 - 130 - - - 0.144 0.141 8 s 15.0 -6.8 -6.5 6.1 -4.5 130 0.049 - - - -9 n 15.0 -5.8 -5.8 5.6 -5.4 130 - - - - 0.156 10 s 45.0 -6.3 -6.2 7.6 -5.3 130 0.047 - - -
-Stage 2: Modified specimen holder
11 s 1.0 -5.0 -5.0 5.1 -4.8 65 0.131 0.183 0.167 0.181 0.139 12 s 5.0 -5.4 -5.2 6.4 -6.5 65 0.060 0.157 0.126 0.137 0.102 13 s 1.0 -4.9 -5.0 7.7 -5.5 130 0.108 0.165 0.171 0.165 0.133 14 n 5.0 -5.2 -5.1 7.7 -5.9 130 0.065 0.155 0.161 0.128 0.142 15 s 10.0 -5.3 -5.4 4.5 -6.3 130 0.046 0.155 0.183 0.099 0.080 16 s 20.0 -5.2 -5.3 5.1 -6.2 130 0.058 0.218 0.153 0.063 0.050
Stage 3: Higher temperature tests
17 s 1.0 -3.5 -4.0 3.8 -4.1 65 0.119 0.182 0.164 0.161 0.148
18 s 10.0 -3.6 -3.9 4.1 -4.7 65 0.049 0.155 0.138 0.128 0.059
Stage 4: High temperature tests
19 s 1.0 -1.5 -1.6 2.5 -2.7 65 0.155 0.190 0.183 0.166 0.160
20 s 5.0 -1.7 -1.4 4.1 -2.5 65 0.071 0.133 0.109 0.098 0.074
21 s 10.0 -2.4 -1.8 3.2 -2.3 65 0.064 0.139 0.117 0.087 0.072
22 s 20.0 -2.6 -1.8 3.2 -2.6 65 0.040 0.094 0.084 0.088 0.053
Stage 5: Low temperature tests
23 s 1.0 -11.3 -10.1 4.1 -10.8 65 0.151 0.190 0.183 0.166 0.161
24 s 5.0 -11.2 -9.7 3.5 -10.6 65 0.071 0.133 0.109 0.098 0.074
25 s 10.0 -9.2 -8.5 4.1 -10.2 65 0.064 0.139 0.117 0.087 0.072
26 s 20.0 -8.9 -8.4 3.3 -10.3 65 0.040 0.096 0.084 0.088 0.053
Stage 6: High temperature tests, samples wet
27 s 5.0 -2.2 -2.1 3.8 -1.1 65 0.083 0.161 0.150 0.134 0.132
28 s 10.0 -2.3 -2.1 3.8 -1.6 65 0.064 0.128 0.115 0.127 0.101
Stage 7: Cold ice with warmer concrete samples, samples wet
29 s 10.0 -5.0 -5.4 7.7 -2.7 65 0.060 0.140 0.150 0.110 0.080
Stage 8: New set of samples (steel)
30 s 10.0 -5.8 -5.7 3.0 -5.8 65 0.049 0.042 0.124 0.070 0.032 31 s 20.0 -4.7 -6.0 3.0 65/28 0.057 0.057 0.146 0.081 0.023 31b s 20.0 3.0 65/29 0.033 0.049 0.130 0.082 0.025 32 s 20.0 -4.8 -4.7 3.0 130 0.037 0.035 0.106 0.067 0.022 33 s 1.0 -6.1 -6.5 2.0 65 0.118 0.086 0.153 0.151 0.090 34 s 5.0 -5.9 -4.6 2.0 65 0.057 0.055 0.104 0.118 0.045 35 s 70.0 -4.6 -4.3 3.5 -4.3 65 0.049 0.039 0.100 0.091 0.033 36 s var -3.7 -2.5 3.5 -2.0 65 0.052 0.114 0.046 37 s 10.0 -3.1 -2.4 4.0 -1.7 130 0.040 0.097 0.088
Ice temp Average Coefficient of Friction
3.3.1 Constant Speed Tests
The influence of speed and contact pressure were examined in Stage 1 at a temperature of ~ -6o C. Figure 17a presents the mean value of coefficient of friction
at a nominal contact pressure of 65 kPa for speeds in the range 1 to 45 cm/s. The smooth concrete sample #1 showed a higher coefficient of friction at the lowest speed, 1 cm/s. A similar trend was also apparent for the broomed concrete #5. For the rough concrete, #2, #3 and #4, the effect of speed was not so pronounced, but it
was still a bit higher at lower speeds. For the tests at higher pressure, 130 kPa, insufficient data were available to make any conclusions about speed effect, see Figure 17b. Speed effect was also examined in Stage 2 tests at a pressure of 130 kPa, Figure 18. The affect of higher friction at lower speeds is apparent here for the relative smooth samples, #1 and #5, but not apparent for the rough samples, #2 and #3. Stage 3 tests were for slightly higher temperature than for the first two runs of Stage 2 but there was no significant change in friction.
Friction of Sea Ice on Various
Construction Materials HYD-TR-067 23
0.0 0.1 0.2 0.3 0 10 20 30 40 50 Speed (cm/s) coefficient of friction #1 #2 #3 #4 #5 a) 0.0 0.1 0.2 0.3 0 10 20 30 40 50 Speed (cm/s) coefficient of friction #1 #2 #3 #4 #5 b)
Figure 17 Stage 1, average value of friction coefficient as a function of speed, (a) 65 kPa normal pressure, and (b) 130 kPa normal pressure.
0.0 0.1 0.2 0.3 0 10 20 Speed (cm/s) coefficient of friction #1 #2 #3 #4 #5
Figure 18 Stage 2, average value of friction coefficient as a function of
speed, 65 kPa, -2o C.
Stage 4 tests were run at a higher temperature, about -2o C. The friction values
were generally similar to the test results of Stages 2 and 3, the main difference being that the friction for samples # 2 and # 3 now followed a consistent pattern of lower friction at speeds of 5 cm/s and faster, see Figure 19. Stage 5 tests were for a much lower temperature, about -10o C. They showed a similar pattern of reducing friction with increasing speed, Figure 20. In Figure 21, friction results for each sample at the two temperatures are compared. It can be seen that, with the exception of Sample #1 (smooth concrete), friction was higher for the warm ice samples.
Friction of Sea Ice on Various
Construction Materials HYD-TR-067 25
0.0 0.1 0.2 0.3 0 10 20 Speed (cm/s) coefficient of friction #1 #2 #3 #4 #5
Figure 19 Stage 4, average value of friction coefficient as a function of
speed, 130 kPa, -2o C. 0.0 0.1 0.2 0.3 0 10 20 Speed (cm/s) coefficient of friction #1 #2 #3 #4 #5
Figure 20 Stage 5, average value of friction coefficient as a function of
Figure 21 Effect of temperature and speed on each of the Series 1 samples, 65 kPa normal pressure.
Stages 6 and 7 explored the effect of wetting the concrete samples. Results are compared for two speeds, 5 and 10 cm/s for wet and dry ice and samples at -2o C,
and wet samples at 10 cm/s and -10o C, see Figure 22. No clearly consistent patterns emerge. At 5 cm/s the dry samples had lower friction, while at 10 cm/s the wet samples had a lower friction coefficient. The cold wet samples showed friction values in some cases lower than the warmer wet samples. Overall the differences are small and not judged to be significant.
0.0 0.1 0.2 0.3 0 10 20 Speed (cm/s) coefficient of friction -10°C -2°C Sample #1 0.0 0.1 0.2 0.3 0 10 20 Speed (cm/s) coefficient of friction -10°C -2°C Sample #2 0.0 0.1 0.2 0.3 0 10 20 Speed (cm/s) coefficient of friction -10°C -2°C Sample #3 0.0 0.1 0.2 0.3 0 10 20 Speed (cm/s) coefficient of friction -10°C -2°C Sample #4 0.0 0.1 0.2 0.3 0 10 20 Speed (cm/s) coefficient of friction -10°C -2°C Sample #5
Friction of Sea Ice on Various
Construction Materials HYD-TR-067 27
0.0 0.1 0.2 0.3 1 2 3 4 5 Sample # friction coefficient dry wet a) 5 cm/s 0.0 0.1 0.2 0.3 1 2 3 4 5 Sample # friction coefficient
dry wet wet/cold b) 10 cm/s
Figure 22 Effect of temperature and wetting on average friction coefficient of each of the Series 1 samples, 65 kPa normal pressure, (a) 5 cm/s and (b) 10
cm/s.
Stage 8 consisted of examining friction on other construction materials, in this case steel, wood and ice, as described in Section 2.3.3 (Series 2). Figure 23 presents the results for the influence of speed on friction for the 4 new samples plus sample #1 (smooth concrete). The trend of decreasing friction with increasing speed was clear for all samples except the corroded steel. By way of comparison of the friction results, Stage 4 data and Stage 8 data for the smooth concrete sample are compared in Figure 24. The results are similar, showing that they are reproducible. Figure 25 compares friction of rough concrete and corroded steel. For speeds of 10 cm/s and slower, the friction on rough concrete is greater than for higher speeds. Friction coefficients for three different contact pressures were also measured and plotted in Figure 26. Over the pressure range 30 kPa to 130 kPa there is a weak trend of lower friction at higher pressure.
0.0 0.1 0.2 0.3 0 10 20 30 40 50 60 70 Speed (cm/s) coefficient of friction
#1 Painted Steel Corroded Steel Wood Ice
Figure 23 Series 2 samples, effect of speed on average friction coefficient.
0.0 0.1 0.2 0.3 0 10 20 30 40 50 60 70 Speed (cm/s) coefficient of friction Stage 8 Stage 4
Figure 24 Comparison of speed effect on average friction of the smooth concrete, sample #1, for Series 1Stage 4 and Series 2 Stage 8.
Friction of Sea Ice on Various
Construction Materials HYD-TR-067 29
0.0 0.1 0.2 0.3 0 10 20 30 40 50 60 70 Speed (cm/s) coefficient of friction
Corroded Steel #2 Rough Concrete
Figure 25 Comparison of speed effect on average friction of corroded steel and rough concrete, Sample #2.
0.0 0.1 0.2 0.3 1 2 3 4 5 Sample coefficient of friction
30 kPa 65 kPa 130 kPa
3.3.2 Varying Speed Tests
One of the tests, Run 36, examined the effect of varying speed on friction. The ice specimen was decelerated to a stop on a particular sample and then accelerated up to a constant speed. Such tests examined both the effect of speed on friction as well as static versus kinetic friction. Figure 27 is a time series plot of speed, frictional force, Fx, normal force, Fz, and coefficient of friction, µ, as the ice specimen
slows continuously to a stop on the painted steel sample. The frictional force and coefficient of friction reach a maximum when the speed becomes zero. Note that there is a slight shift between the carriage speed, which is determined from a tachometer on the electric motor driving the carriage, and the frictional force. It can also be seen that the frictional force rapidly relaxes to zero even though the normal force remains constant. This is most likely due to the carriage moving back slightly, relieving the frictional force.
Figure 27 Test Run 36 – pass 1, decreasing speed to a stop on painted steel sample.
Figure 28 is a time series plot of the start up of the ice specimen as it increases in speed. It can be seen that there is a lag in the increase of frictional force as the speed starts to increase. This is partly due to inertia and elasticity between the drive system of the carriage and the electric motor where speed is measured. The peak frictional force represents the static friction. There is a drop-off of force as the
-0.1 0 0.1 0.2 0.3 0.4 0.5 0.6 0.7 0.8 0.9 4 4.5 5 5.5 6 6.5 7 Time (s) Fx (kN) Fz (kN) f Speed (m/s)
Friction of Sea Ice on Various
Construction Materials HYD-TR-067 31
ice specimen breaks free of the sample, a recovery and then a decrease in friction as the speed increases.
Figure 28 Test Run 36 – pass 1, increasing speed from stop on painted steel sample.
It is possible to plot the speed versus friction for these two cases (increasing and decreasing speed), see Figure 29. With decreasing speed, friction coefficient increases from 0.04 to about 0.08. In the case of increasing speed the static friction coefficient is about 0.29, and then decreases from about 0.1 at 1 cm/s to about 0.05 at 10 cm/s. For both cases, there are similar trends of decreasing friction coefficient with increasing speed. A repeat test on the painted steel specimen produced similar results. For the corroded steel, the friction coefficient was about 0.1 at speeds greater than 10 cm/s, increasing to about 0.2 as speed approached zero. The static friction was about 0.45. These results are similar to the constant speed test results presented in Figure 23 (for speeds greater than 5cm/s, the average value was 0.12 and 0.05 for corroded and painted steel, respectively).
-0.3 -0.2 -0.1 0 0.1 0.2 0.3 0.4 0.5 0.6 0.7 0.8 0.9 44 44.5 45 45.5 46 46.5 47 47.5 48 Time (s) Fx (kN) Fz (kN) f Speed (m/s)
0.00 0.05 0.10 0.15 0.20 0.25 0.30 0.35 0.00 0.05 0.10 0.15 0.20 0.25 0.30 0.35 Speed (m/s) Coefficient of Friction
Decreasing Speed Increasing Speed
Figure 29 Test Run 36 – pass 1, comparison of friction coefficient as a function of speed for decreasing and increasing speed tests on painted
steel sample.
4. Summary and Discussion
The apparatus developed for these friction tests offers considerable flexibility in terms of ice specimen and material sample size, temperature, speed, wet versus dry and contact pressure. Speeds can be selected over a broad range and either maintained constant or varied. An extensive series of tests were carried out to measure friction of sea ice on samples of a number of materials and under different test conditions such as contact pressure, speed, temperature and wetness.
Two general trends were apparent from the tests; friction was higher at (i) lower speeds and (ii) on rough materials, be they concrete or steel. Friction is higher for the first pass of ice over the test samples, and is lower for subsequent passes. Considerable variability was observed in the instantaneous values of the coefficient of friction, the coefficient of variation on the average being about 25%. The average coefficient of friction of sea ice on smooth concrete, painted steel and sea ice was about 0.05 for speeds greater than 5 cm/s and increased to about 0.1 at 1 cm/s. The average coefficient of friction of sea ice on rough concrete and corroded
Friction of Sea Ice on Various
Construction Materials HYD-TR-067 33
steel was about 0.1 at speeds greater than 10 cm/s and increased to 0.2 at 1 cm/s. Ice-ice friction was 0.03 at a speeds of 0.1m/s and higher, and 0.09 at 0.01m/s. Temperature has a weak effect on friction coefficient, with slightly higher values at – 2o C than at –10o C. There was also a weak trend of lower friction coefficient at higher contact pressures. These trends are similar to those found for kinetic friction by Saeki et al (1986). He measured no effect of contact pressure on kinetic friction over the range 100 kPa to 1000 kPa.
5. Acknowledgements
The assistance of Mark Wardel, a Work Term Student from Memorial University of Newfoundland in setting up the test system, performing the tests and reducing the data is greatly acknowledged. Also, the assistance of Stuart Gill, Work Term student from Memorial University of Newfoundland in additional reduction of the test data is appreciated. The test apparatus was designed by Ed Funke of COMDOR Engineering and fabricated in house at NRC.
6. References
Saeki, H., Ono, T., Nakazawa, N., Sakai and Tanaka, S., 1986. The Coefficient of Friction Between Sea Ice and Various Construction Materials Used in Offshore Structures, ASME Journal of Energy Resources Technology, Vol. 108, No. 1, pp 67-71.
Miles, M. 1990. The GEDAP Data Analysis Software Package. NRC Report TR-HY-030, Ottawa, Ont., Canada.
Friction of Sea Ice on Various
Construction Materials HYD-TR-067
REPORT DOCUMENTATION FORM/FORMULAIRE DE DOCUMENTATION DE RAPPORT REPORT No./ N°. DU RAPPORT HYD-TR-67 PROJECT No./ No. DU PROJET 59_583_00 SECURITY CLASSIFICATION/ CLASSIFICATION DE SÉCURITÉ __ Top Secret/Très sécret __ Secret __ Confidential/Confidentiel __ Protected/Protégée _x Unclassified/Non classifiée DISTRIBUTION/DIFFUSION _ _ Controlled/Contrôlée _x _ Unlimited/Illimitée
DECLASSIFICATION: DATE OR REASON/DÉCLASSEMENT: DATE OU RAISON TITLE, SUBTITLE/TITRE, SOUS-TITRE
Friction of Sea Ice on Various Construction Materials AUTHOR(S)/AUTEUR(S)
R. Frederking and A. Barker SERIES/SÉRIE
CORPORATE AUTHOR/PERFORMING ORGANIZATION/AUTEUR D'ENTREPRISE/AGENCE D'EXÉCUTION
Canadian Hydraulics Centre, National Research Council of Canada
SPONSORING OR PARTICIPATING AGENCY/AGENCE DE SUBVENTION OU PARTICIPATION
Program of Energy Research and Development (PERD) DATE Nov. 2001 FILE/ DOSSIER SPECIAL CODE/ CODE SPÉCIALE PAGES 41 FIGURES 29 REFERENCES 2 NOTES
DESCRIPTORS (KEY WORDS)/MOTS-CLÉS Ice friction tests, sea ice, steel, concrete and wood SUMMARY/SOMMAIRE:
Friction forces of sea ice on several different materials (smooth and rough concrete, smooth and rusted steel, wood and ice) were conducted in an environmental test chamber under controlled conditions. Ice and concrete temperatures were about –3o C. Tests were done
for dry and wet concrete surfaces, however little difference if the values of friction coefficient was observed. Test velocities ranged from 0.01 m/s to 0.7 m/s.
ADDRESS/ADDRESSE
Canadian Hydraulics Centre, National Research Council of Canada Montreal Road, Ottawa, K1A 0R6, Canada; phone (613) 993-2417