1 Supplementary Information
Versatile 3D Porous Recycled Carbon Garments with Fully-Loaded Active
Materials in the Current Collector for Advanced Lithium-Ion Batteries
Hyunjin Choa,g,†, Yeonho Kimb,†, Yong Ju Yunc, Kyu Seung Leed, Jaeho Shimd, Chil-Hyoung Leed, Jin
Won Seoe, Won G. Hongb, Hae Jin Kimb, Hak Yong Kima,f,*, and Dong Ick Sond,h,†,*
aDepartment of Organic Materials and Fiber Engineering, Chonbuk National University, 567,
Baekje-daero, Deokjin-gu, Jeonju, Jeollabuk-do, 54896, Republic of Korea
bDivision of Analytical Science, Korea Basic Science Institute, 169-148 Gwahak-ro, Yuseong-gu,
Daejeon 34133, Republic of Korea
cDepartment of Energy Engineering, Konkuk University, 120, Neungdong-ro, Gwangjin-gu, Seoul,
05029, Republic of Korea
dInstitute of Advanced Composite Materials, Korea Institute of Science and Technology, 92,
Chudong-ro, Bongdong-eup, Wanju, Jeollabuk-do, 55324, Republic of Korea
eDepartment of Materials Engineering, KU Leuven, 3001 Leuven, Belgium
fDepartment of BIN Convergence Technology, Chonbuk National University, 567, Baekje-daero,
Deokjin-gu, Jeonju, Jeollabuk-do, 54896, Republic of Korea
gSecurity and Disruptive Technologies Research Centre, National Research Council Canada, 1200
Montreal Road, Ottawa, Ontario, K1A 0R6, Canada
hKIST School, Nano and Information Technology, University of Science and Technology (UST),
Gajeong-ro 217, Yuseong Gu, Dae-Jeon 34113, Korea
Keywords: Wearable device; Flexible electrode; Carbon staple fabric; Lithium-Ion Batteries;
Oxi-PAN
† These authors contributed equally to this work.
2
Contents:
1. The manufacturing process of the recycled oxidized polyacrylonitrile (Oxi-PAN) spun yarn and carbon spun fabric (CSF).
2. SEM images of the CSF (Dry) and CSF (Wet) carbonized at various temperatures. 3. Various characteristics of the CSF carbonized in the range from 700 °C to 1500 °C. 4. XPS analysis data of the CSF (Dry) and CSF (Wet) carbonized at various temperatures. 5. XRD and Raman spectra of the pristine Oxi-PAN spun fabric and the CSF (Dry).
6. Images of measuring the mechanical property of the CSF (Wale & Course direction, dry) obtained after carbonization at 1100 °C.
7. Repeated bending test of the carbon spun yarn (CSY, dry) carbonized at 1100 °C.
8. The thermal analysis and calculated power (SI unit: W, consumed power energy) of the CSF obtained from various carbonization temperatures.
9. The measured resistance (Ω), temperature (°C), current (A), and power (W) under the standard, stretching (+40%), and bending conditions (-40%) of the CSF (wale and course direction-Dry) carbonized at 1100 °C.
10. The measured thermal images under the standard, stretching (+40%), and bending conditions (-40%) of the CSF (course direction-Dry) carbonized at 1100 °C.
11. The measured thermal image under the standard, stretching (+40%), and bending conditions (-40%) of the CSF (wale direction-Dry) carbonized at 1100 °C.
12. The results of the Joule heating simulations and stress simulations of the CSF course-stretching (40%) in FEA.
13. The heat dissipation of the CSF and Cu foil.
14. Virtual cross-section photograph of non-destructive 3D XRM of the CSF with the 3-dimensional porous structure and the structure of the CSF/LFP@C composite before/after the charging/discharging.
15. The results of AFM and KPFM analysis of the CSF/LFP@C composite before/after the charging/discharging.
16. The SEM-EDS image of the CSF/LFP@C composite before/after the charging and discharging.
17. XRD analysis of LFP nanoplatelets.
18. EDS mapping and composition analysis of LFP@C nanoplatelets. 19. High-resolution XPS spectra of LFP@C nanoplatelets.
3
21. Electrochemical stability windows of the CSF as a current collector and Cyclic-voltammetry profiles of CSF in the voltage range of 0.1 – 4.9 V at a scan rate of 20 mV/s. 22. Cross-sectional SEM images and the EDS elemental mapping images of Al/LFP@C and
CSF/LFP@C composites electrode.
23. Charge-discharge profiles of the Cu/Fe2O3 and CSF/Fe2O3 electrode at a rate of 0.1 C and cycling performance of the CSF/Fe2O3 electrode at a rate of 0.2 C.
24. TGA curves of LFP and LFP@C.
25. The parameters of the Joule heating simulations in the CSF course stretching (40%).
Video Content:
S1. Video data of the measurement process of the tensile strength of the CSF (Wale-Dry). S2. Video data of the measurement process of the tensile strength of the CSF (Course-Dry). S3. Video data of the thermal analysis data for the standard, stretching (+40%), and bending
conditions (-40%) of the CSF (Wale & Course direction-Dry) carbonized at 1100 °C. S4. Video data on the flexibility (crumpled, folded, and twisted) test of the CSF (Dry)
carbonized at 1100 °C.
S5. Video data on the heat insulation and flexibility (crumpled, folded, and twisted) tests of the CSF (Dry) carbonized at 1100 °C.
S6. Video data on virtual cross-section photograph of non-destructive 3D XRM of the CSF with the 3-dimensional porous structure.
S7. Video data on Virtual cross-section photograph of non-destructive 3D XRM of the CSF/LFP composites before Charge/Discharge.
S8. Video data on Virtual cross-section photograph of non-destructive 3D XRM of the CSF/LFP composites after Charge/Discharge Nc=200.
S9. Video data on Another virtual cross-section photograph of non-destructive 3D XRM of the CSF/LFP composites after Charge/Discharge Nc=200.
4
1. The manufacturing process of the recycled oxidized polyacrylonitrile (Oxi-PAN) spun yarn and carbon spun fabric (CSF).
Fig. S1. Illustration of the manufacturing process of the recycled Oxi-PAN spun yarn and CSF. a
Preparation of the initial Oxi-PAN staple fibers (length of 40−50 mm) b The mixing and blowing processes untie the entangled fibers and remove dust and impurities. c The carding process removes impurities and aligns the slivers. d The drawing process doubles the number of slivers (6−8 ea) and repeatedly draws the slivers. e The roving process makes a thin yarn with a twist. f The spinning process draws and twists the Oxi-PAN roved yarns. g The winding process winds the Oxi-PAN spun yarn and distributes the same weight as a cone-type product. h The knitting process knits the Oxi-PAN spun yarns and manufactures knitted fabrics with the wale and course directions. i The Oxi-PAN T-shirt and glove prepared by an additional manufacturing process.
5
The manufacturing process of commercially available carbon fibers typically includes a wet spinning process, stabilization, carbonization, graphitization, surface treatment, and sizing process [1, 2]. The raw material of the carbon fibers was polyacrylonitrile (PAN). PAN multi-filament fibers were generally prepared via a wet spinning process [2]. During the subsequent stabilization process, cut and defective PAN multi-filament fibers could be generated. Therefore, the PAN staple fibers with lengths ranging from 40 to 50 mm were prepared by regularly cutting. However, it is difficult to directly manufacture the prepared carbon staple fibers into one yarn due to loose, untied and entangled nature of the carbon staple fibers. Therefore, in order to fabricate a yarn, we utilized a cotton spinning process, which is a well-known technique for producing cotton staple fibers in yarns.
First, the entangled carbon staple fibers were untied through a mixing and blowing process, which included a step that removed mixed dust and impurities. Second, through the carding process, the carbon staple fibers were aligned in one direction, and the remaining impurities were removed. Then, the Oxi-PAN slivers were manufactured. Third, the Oxi-PAN slivers were collected into two or more Oxi-PAN slivers during the pulling process, which occurred concurrently as the drawing process. Fourth, the collected Oxi-PAN slivers were twisted into a thin yarn via the roving process. Fifth, the thin roving yarns were additionally twisted to manufacture the yarn with the desired thickness via the spinning process. Sixth, the Oxi-PAN spun yarn was distributed and wound in the same weight unit through the winding process. Seventh, Oxi-PAN spun fabrics were produced from the Oxi-PAN spun yarn by using a knitting process, and they were manufactured in the wale and course directions. Finally, the manufactured Oxi-PAN spun fabrics were used to produce an Oxi-PAN T-shirt and glove by a manufacturing process commonly used for commercial applications.
6
7
Fig. S2. SEM images of the CSF (Dry) and CSF (Wet) carbonized at various temperatures from 700 °C to 1500 °C. a-r The low- and high-magnification SEM images.
8
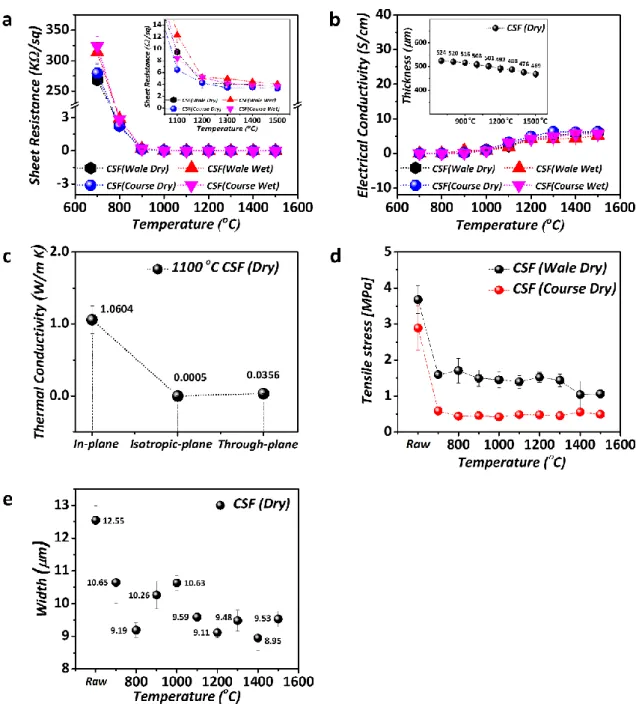
3. Various characteristics of the CSF carbonized in the range from 700 °C to 1500 °C.
Fig. S3. a Data for the sheet resistance of the CSF (Dry & Wet, Wale & Course, 700 °C to 1500 °C)
and data for the sheet resistance of the CSF (the inset) b Data for the electrical conductivity of the CSF (Dry & Wet, Wale & Course, 700 °C to 1500 °C) and the thickness of the samples (the inset) c Analysis data for the thermal conductivity (in-plane, isotropic-plane, and through-plane of the CSF (1100 °C)) d Tensile stress data (MPa) for the CSF (Dry, Wale & Course, 700 °C to 1500 °C) e The measured dimension (width) of the raw (Oxi-PAN) spun fabric and CSFs carbonized at different temperatures.
Fig. S3a and S3b compare the data of the sheet resistance with the electrical conductivity of the CSF (Wale & Course Dry and Wet). The SEM results in Fig. S2 show that
9
the surface and morphology of CSF (Dry) did not change much after washing. However, the surfactants used in the washing process most probably remain on the surface, even after rinsing times, resulting in the increased sheet resistance and reduced electrical conductivity of CSF (Wet), as shown in Fig. S3a and S3b and the inset of Fig. S3a. Furthermore, we determined that the carbon contents increased with the increasing carbonization temperature between CSF (Dry) and CSF (Wet), as shown in the X-ray photoelectron spectroscopy (XPS) data in Fig. S4. Those results are due to the different quality of the graphitic structure. We assume that the residual surfactants could also affect the difference between the CSF (Dry) and CSF (wet) samples.
The inset of Fig. S3b shows the thickness of the CSF (Dry) gradually decreasing with carbonization temperature. This trend can be explained by a higher graphitization ratio and by the fact that the interlayer spacing and the void content in the CSFs get significantly reduced, finally leading to a reduced thickness of the sample. We also measured the dimension (width) of all samples as shown in Fig. S3e to compare the difference among them. As a result, we found that after the carbonization process, the dimension was slightly decreased with increasing the temperature of carbonization. However, the carbon content of CSF (Wet) was lower than that of CSF (Dry), as shown in Fig. S4a, 4b, and 4c.
The results presented in Fig. S2 and S3 show that the properties measured were not much different after carbonization at temperatures higher than 1100 °C, (especially from 1200 °C to 1500 °C). For the sake of the low production cost must be considered, a lower carbonization temperature is preferential, and it is vital to reduce the manufacturing process for commercial applications. It is supposed that the manufacturing cost of the CSF in the optimum condition is lower than that of typical carbon multifilament fibers because the samples prepared at the optimum condition have the sufficient electrical conductivity and flexibility despite the elimination of the additional process like the graphitization [3]. Consequently, the carbonization at 1100 °C was selected as the optimum condition.
10
Fig. S3d shows the tensile strength of the raw Oxi-PAN spun fabric and the CSF (Wale & Course Dry) carbonized at the different temperature conditions. As a result, we found the tensile strength in the wale direction was higher than the course direction because of the unique structure in the knitting process [4]. We believe that the loops in the wale direction became tighter when the tensile stress was applied to the CSF (Dry). On the other hand, the CSY in the course direction became loose with untied fibers. The detailed mechanical response and shape of knitted fabrics were reported through the theoretical study of the fundamental framework [5]. The details of the tensile strength measurements are highlighted in Fig. S6. The tensile strength values of the CSF (Wale Dry) almost linearly decreased with the increasing carbonization temperature. This gradual degradation (approximately 5%) can be explained by the CSY in CSF (Wale Dry) becoming more brittle with the increase of the carbonization temperature.
In contrast, the tensile strength along the course direction (CSF (Course Dry)) remained almost constant despite the increasing the carbonization temperature. We believe that the CSY in CSF (Course Dry) was loose and torn because of the unique structure formed by the knitting process. (Video S1 of the measurement process of the tensile strength of CSF (Dry))
11
4. XPS analysis data of the CSF (Dry) and CSF (Wet) carbonized at various temperatures.
Fig. S4. XPS analysis data of the CSF (Dry) and CSF (Wet) carbonized at various temperatures ranging from 700 °C to 1500 °C. a-c Carbon, nitrogen, and oxygen contents determined by analyzing
the XPS data. d XPS spectrum of the CSF (Dry) carbonized at 1100 °C. e The carbon spectrum of the CSF (Dry) carbonized at 1100 °C. f The nitrogen spectrum of the CSF (Dry) carbonized at 1100 °C. g The oxygen spectrum of the CSF (Dry) carbonized at 1100 °C. The fits of the data are shown in red in
e-g.
Fig. S4 indicates XPS analysis data of the CSF (Dry) and CSF (Wet) carbonized at various temperatures. In particular, the carbon peak of the CSF (Dry) carbonized at 1100 °C was considerably higher than the nitrogen and oxygen peaks as shown in Fig. S4d. As a result, the central peak at 284.5 eV was due to C-C and C-H bonds [6-9]. The small peak at 286.3 eV
12
was due to C-O and C-N bonds [6-9]. The other peak at 288.8 eV was due to the O=C-O bond, as shown in Fig. S4e. The three nitrogen peaks are shown in Fig. S4f. The highest peak at 399.8 eV was for the pyridonic and pyrrolic position, like the N-C-O bond [6-8]. The small peak at 401.2 eV was due to quaternary position nitrogen[6-9]. The other small peak represented the pyridinic position, like the C-N-C bond, at 398.4 eV [6-9]. Lastly, the small oxygen peak is shown in Fig. S4g. The other individual bonds, such as the H-O-C and C-O bonds, were observed at 532.4 and 534.3 eV, respectively [6-9].
13
5. XRD and Raman spectra of the pristine Oxi-PAN spun fabric and the CSF (Dry).
Fig. S5. Comparison of the XRD and Raman spectra of the pristine Oxi-PAN fabric and the CSF (Dry) at various carbonization temperatures ranging from 700 °C to 1500 °C a The XRD spectra
of the pristine Oxi-PAN fabric and the CSF (Dry) (carbonized at temperatures ranging from 700 °C to 1500 °C) b The Full width at half maximum (FWHM) of XRD spectra of the pristine Oxi-PAN fabric and the CSF (Dry) carbonized at the various temperatures from 700 °C to 1500 °C. c ID/IG ratio of the
pristine Oxi-PAN fabric and the CSF (Dry) carbonized at the various temperatures from 700 °C to 1500 °C. d The table of ID/IG ratio of the pristine Oxi-PAN fabric and the CSF (Dry) carbonized at the
various temperatures from 700 °C to 1500 °C.
Fig. S5a-S5b shows the XRD results with integrated azimuthal profiles (2θ scans) of the raw Oxi-PAN fabric and the CSF carbonized at different temperatures. Typically, the (100) plane of pure PAN fibers leads to diffraction peaks at 17° (2θ) and 29.3° (2θ) [10]. According to the previous study, the intensity of these two pure PAN fiber peaks gradually decreased depending on the operation time of the stabilization process [2]. Moreover, the
14
broad peak at 26.2° (2θ), which corresponds to the (002) plane, was observed as a result of the prolonged stabilization process. The peak indicates that the PAN fibers have a pre-graphitic structure [10]. Thus, the XRD data of the raw Oxi-PAN spun fabric we manufactured is in agreement with that of stabilized PAN fibers [2]. We also found that the raw Oxi-PAN fabric was partly crystallized during the stabilization process.
Fig. S5a-S5b indicates the normalized XRD spectra (Based on (002) plane) of the CSFs carbonized at different temperatures. As a result, we found the intensity of the peak at 25.2~25.6° (2θ) near the (002) plane sharply increased with increasing the temperature from 700 °C to 1500 °C. As to the peak at 17° (2θ), we found that it was almost disappeared in contrast to that of the raw Oxi-PAN spun fabrics. We found the peak positions of our CSFs were in accordance with that of commercial carbon fibers [2, 10]. Thus, we believe that the CSFs could be consist of a turbostratic carbon structure.
Furthermore, we confirmed that the decreasing trend of the width at half maximum (FWHM) of the peaks at 25.2~25.6° (2θ) near the (002) plane, based on the normalized XRD spectra of the CSFs carbonized at different temperatures. The FWHM trend, which is decreased with increasing the carbonization temperature, indicates the increase of the degree of graphitization [11]. Consequently, the degree of graphitization in XRD spectra based on FWHM value calculated from the various CSFs carbonized at the different temperatures correspond to the trend of the degree of graphitization in XPS and Raman analysis data.
Fig. S5c-S5d shows the ratio of ID/IG in Raman spectra of CSFs at different carbonization temperatures corresponded to those of XPS results in Figure S4 and XRD results in Figure S5a-b. In order to confirm the ratio of ID/IG, we measured the Raman spectra of CSFs at different carbonization temperatures from 700 oC to 1500 oC. Then, we normalized them based on the IG peak of the Raman spectra of CSFs. At last, we calculated the ratio of ID/IG of the Raman spectra, respectively. As a result, we found that the ID/IG ratio decreased with increasing the carbonization temperature, as shown in Figure S5c and S5d. The ratio of
15
ID/IG which is decreased with increasing the carbonization temperature indicates the number of the defect sites in the samples[12, 13]. Therefore, it can be considered as the degree of graphitization. In our results, the trend of ID/IG ratio in Raman spectra corresponds to those of XPS and XRD analysis data.
16
6. Images of measuring the mechanical property of the CSF (Wale & Course direction, dry) obtained after carbonization at 1100 °C
Fig. S6. Measurement of the mechanical properties of the CSF (Dry) produced at various carbonization temperatures ranging from 700 °C to 1500 °C by means of the tensile strength tester (wale and course directions) A The picture showing the tensile strength tester B Structure of
the CSF (wale and course directions) C Pictures (a-i) taken during the measurement process of the mechanical property of the CSF (Wale Dry) carbonized at 1100 °C D Pictures (a-i) taken during the measurement process of the mechanical property of CSF (Course Dry) carbonized at 1100 °C.
17
7. Repeated bending test of the carbon spun yarn (CSY, dry) carbonized at 1100 °C
Fig. S7. Repeated bending test of the CSY (Dry) carbonized at 1100 °C a Pictures demonstrating
the 10,000 cycles repeated bending test of the CSY (Dry, 1100 °C) b Analysis of the resistance of the CSY (Dry, 1100 °C) during the bending tests ranging from 0 to 10,000 cycles c, d Variation data of the CSY (Dry, 1100 °C) during the bending test from 0 to 1,000 cycles e, f Variation data of the CSY (Dry, 1100 °C) during the bending test from 9,000 to 10,000 cycles.
18
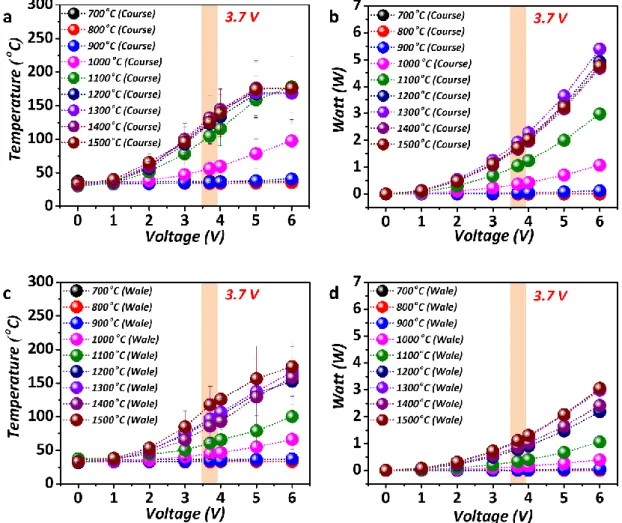
8. The thermal analysis and calculated power (SI unit: W, consumed power energy) of the CSF obtained from various carbonization temperatures.
Fig. S8. Thermal analysis and calculated values of the power (SI unit: W, the consumed power energy) of CSF a Thermal analysis of the CSF (Course Dry) at various carbonization temperatures
ranging from 700 °C to 1500 °C against voltages from 1 V to 6 V b Power analysis of the CSF (Course Dry) at various carbonization temperatures ranging from 700 °C to 1500 °C against various voltages (1 V to 6 V) c Thermal analysis of the CSF (Wale Dry) at various carbonization temperatures ranging from 700 °C to 1500 °C against various voltages (1 V to 6 V) d Power analysis of the CSF (Wale Dry) at various carbonization temperatures ranging from 700 °C to 1500 °C against various voltages (1 V to 6 V) For b and d, the power (W) was calculated by using the formula W = V × A, based on the current (A) measured throughout the experiment.
19
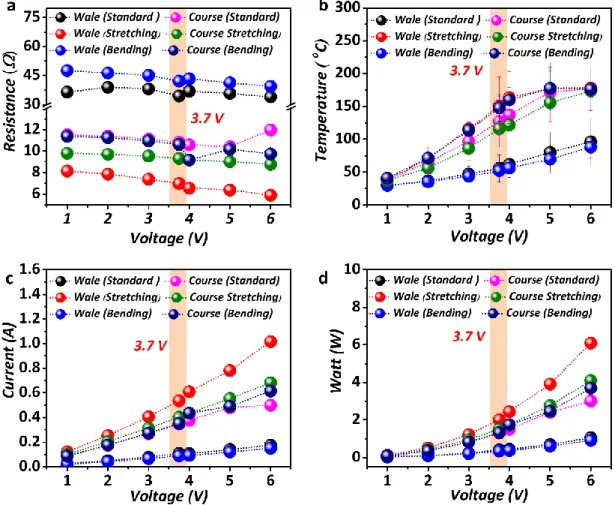
9. The measured resistance (Ω), temperature (°C), current (A), and power (W) under the standard, stretching (+40%), and bending conditions (-40%) of the CSF (wale and course direction-Dry) carbonized at 1100 °C.
Fig. S9. Data obtained under the standard, stretching, and bending conditions as a function of voltage for the CSF carbonized at 1100 °C a Resistance data of the CSF (Wale & Course direction,
dry) against the voltage (1 V to 6 V) b Thermal analysis of the CSF (Wale & Course direction, dry) against the voltage (1 V to 6 V). c The current analysis of the CSF (Wale & Course direction, dry) against the voltage (1 V to 6 V) d Power analysis of the CSF (Wale & Course direction, dry) against the voltage (1 V to 6 V) derived from the formula W = V × A (based on the current (A), which was additionally measured throughout the experiment).
20
10. The measured thermal images under the standard, stretching (+40%), and bending conditions (-40%) of the CSF (course direction-Dry) carbonized at 1100 °C.
21
Fig. S10. The thermal analysis of the CSF (Course direction, dry) carbonized at 1100°C under the standard, stretching, and bending conditions against the voltage A (a-g) Thermal analysis of
the CSF (course direction, under the standard and dry conditions) at 1100 °C against the voltage (1 V to 6 V) B (a-g) Thermal analysis of the CSF (course direction, under the stretching and dry conditions) against the voltage (1 V to 6 V) C (a-g) Thermal analysis of the CSF (course direction, under the bending and dry conditions) against the voltage (1 V to 6 V).
22
11. The measured thermal image under the standard, stretching (+40%), and bending conditions (-40%) of the CSF (wale direction-Dry) carbonized at 1100 °C.
23
Fig. S11. The thermal images obtained under the standard, stretching, and bending conditions of the CSF (Wale direction) carbonized at 1100 °C against the voltage A (a-g) Thermal analysis of
the CSF (wale direction, under the standard, and dry conditions) against the voltage (1 V to 6 V) B
(a-g), Thermal analysis of the CSF (wale direction, under the stretching, and dry conditions) against the
voltage (1 V to 6 V) C (a-g), Thermal analysis data of the CSF (wale direction, under the bending, and dry conditions) against the voltage (1 V to 6 V).
24
12. The results of the Joule heating simulations and stress simulations of the CSF course-stretching (40%) in FEA.
Fig. S12. The Joule heating simulations and stress simulations in FEA of the CSF heater (course direction) for both, the standard and 40% stretching a-d The Joule heating simulations and stress
simulations in FEA of the CSF standard (0%) and stretching (40%) c-d The calculated temperature of the CSF course stretching (40%) at 3.7 V. e-j The Joule heating simulations data of CSF course stretching (40%) from 1 V to 6 V.
25
13. The heat dissipation of the CSF and Copper (Cu) foil.
Fig. S13. The heat dissipation of the CSF and Cu foil a-b Photographs of the LED electrical circuit
on the CSF (Dry, 1100 °C) c A heat sink and the heat analysis data from the infrared thermal imaging camera on the CSF (Dry, 1100°C) d-e Photographs of the LED electrical circuit on the CSF (Dry, 1100 °C) on the commercial Cu foil f A heat sink and the heat analysis data from the infrared thermal imaging camera on the commercial Cu foil.
Fig. S13a-f demonstrates the heat dissipation of a commercial LED chip, which was mounted on the center of the CSF (Dry) carbonized at 1100 °C and on a copper foil for comparison. Fig. S13b and S13e show photographs of the fabricated electric circuit, and Fig. S13a and S13d are images of light emission. When the Cu foil was used as a heat sink, the temperature of the LED chip was 56.8 °C after 90 s.
In contrast, the CSF (Dry) yielded a temperature of 49.8 °C, i.e., approximately 7 degrees lower. This comparison highlights the excellent heat radiation and heat dissipation properties of CSFs at elevated temperatures. In particular, the heat dissipation in carbon materials, like graphene, is known to be superior to that of Cu because graphene has a better
26
thermal emissivity than Cu [14, 15]. These results corresponded to the observation reported in a previous paper [16].
The experimental results also showed that, although the heat dissipation effect in the CSF was less than that of typical carbon materials (e.g., graphene), the CSF (Dry) can replace metal heat sinks. Notably, the CSF (Dry) can be directly applied as a flexible electrode substrate, which can be used in wearable electronics, as well as a heat dissipation material. For these reasons, we expect that the CSF and CSY will have a significant impact on the development of wearable electronics in the future because the CSF has outstanding properties such as excellent flexibility, remarkable electrical conductivity, and effective heat dissipation. Due to the low power consumption, it also can be used as a flexible and portable heater in extreme environments (e.g., polar regions or space) where the highly efficient heater is required.
27
14. Virtual cross-section photograph of non-destructive 3D XRM of the CSF with 3-dimensional porous structure and the structure of the CSF/LFP composites before and after Charge/Discharge.
Fig. S14. a Virtual cross-section photograph of non-destructive 3D XRM of CSF with 3-dimensional
porous structure. b, c Virtual cross-section photograph of the CSF/LFP composites structure before and after Charge/Discharge Nc=200. dAnother virtual cross-section photograph of the structure of the
28
15. The results of AFM and KPFM analysis of the CSF/LFP composite before/after the charging and discharging.
Fig. S15. The CSF/LFP film images and line profile data by AFM a Surface morphology and b Line
profile data before the charge/discharge cycle, the scan size is 1.5 μm × 1.5 μm. The CSF/LFP images and line profile data by KPFM: c Surface morphology and d Line profile data before the
29
charge/discharge cycle, the scan size is 1.5 μm × 1.5 μm. e Surface morphology and f Line profile data after the charge/discharge cycle, the scan size is 1.5 μm × 1.5 μm. The CSF/LFP images and line profile data by KPFM: g Surface morphology and h Line profile data after the charge/discharge cycle, the scan size is 1.5 μm × 1.5 μm.
30
16. The SEM-EDS image of the CSF/LFP composite before/after the charging and discharging.
Fig. S16. a SEM image of the CSF/LFP composites and b-e The EDS elemental mapping of its
corresponding compositions of C, Fe, O and P, respectively, before the charge/discharge cycle f SEM image of CSF/LFP composites and g-k The EDS elemental mapping of its corresponding compositions of C, Fe, O and P, respectively, after the charge/discharge cycle.
31 17. XRD data of LFP nanoplatelets.
Fig. S17. XRD analysis of LFP@C nanoplatelets.
Fig. S17 indicates the XRD pattern of LFP@C nanoplatelets. All the diffraction patterns can be indexed to an orthorhombic space group without any impurity peaks, Pnma (ICSD Card No. 98-016-2282), which indicates the perfect crystalline structure of olivine LFP. Fig. S18 shows that the EDS elemental mapping and the corresponding composition analysis, the elements of Fe, P, and O are distributed homogeneously and their composition is almost the same as the theoretical stoichiometry of LFP.
Moreover, the presence of C atoms in elemental maps represents a successful carbon coating onto the LFP. The Fe 2p spectrum in Fig. S19 shows the two major peaks whose Fe 2p3/2 and Fe 2p1/2 binding energies were measured to 711.1 and 724.7 eV, respectively. The binding energy separation can be calculated to 13.6 eV, which matched well with the value of Fe2+ in LFP.
32
18. EDS mapping and composition analysis of LFP@C nanoplatelets.
Fig. S18. a STEM image of LFP@C nanoplatelets and b-e EDS elemental maps of Fe, P, O, and C,
respectively, of LFP@C nanoplatelets. f EDS profiles spectrum and their composition analysis of LFP@C nanoplatelets.
33
19. High-resolution XPS spectra of LFP@C nanoplatelets.
34
20. Electrochemical performance of the coin cell with CSF as a current collector.
Fig. S20. Cycling performance of the CSF/LFP@C electrode with a mass loading of 11 mg cm-2 at a
35
21. Electrochemical stability windows of the CSF as a current collector and Cyclic-voltammetry profiles of CSF.
Fig. S21. Electrochemical stability windows of the CSF as a current collector and Cyclic-voltammetry
36
22. Cross-sectional SEM images and the EDS elemental mapping images of Al/LFP@C and CSF/LFP@C composites electrode.
Fig. S22. Cross-sectional SEM images and the EDS elemental mapping images of a-f Al/LFP@C and g-k CSF/LFP@C composites electrode.
37
23. Charge-discharge profiles of the Cu/Fe2O3 and CSF/Fe2O3 electrode at a rate of 0.1 C and cycling performance of the CSF/Fe2O3 electrode at rate of 0.2 C.
Fig. S23 a charge-discharge profiles of the Cu/Fe2O3 and CSF/Fe2O3 electrode at a rate of 0.1 C and b
38 24. TGA curves of LFP and LFP@C.
39
25. The parameters of the Joule heating simulations in the CSF course stretching (40%). Table S1. CSF properties used for simulations.
40
* Video data
S1. Video data of the measurement process of the tensile strength of CSF (Wale-Dry) S2. Video data of the measurement process of the tensile strength of CSF (Course-Dry)
S3. Video data of the thermal analysis data for the standard, stretching (+40%), and bending conditions (-40%) of CSF (Wale & Course direction-Dry) carbonized at 1100 °C
S4. Video data on the flexibility (crumpled, folded, and twisted) test of CSF (Dry) carbonized at 1100 °C
S5. Video data on the heat insulation and flexibility (crumpled, folded, and twisted) tests of CSF (Dry) carbonized at 1100 °C
S6. Video data on virtual cross-section photograph of non-destructive 3D XRM of CSF with the 3-dimensional porous structure.
S7. Video data on virtual cross-section photograph of non-destructive 3D XRM of CSF/LFP@C composite electrode before charge/discharge
S8. Video data on virtual cross-section photograph of non-destructive 3D XRM of CSF/LFP@C composite electrode after charge/discharge Nc=200.
S9. Video data on another virtual cross-section photograph of non-destructive 3D XRM of CSF/LFP@C composite electrode after charge/discharge Nc=200.
41
Reference
[1] Donnet J-B, Bansal RC. Carbon fibers: CRC Press; 1998.
[2] Lee S, Kim J, Ku B-C, Kim J, Joh H-I. Structural evolution of polyacrylonitrile fibers in stabilization and carbonization. Advances in chemical engineering and science.
2012;2(02):275.
[3] Jeffries R. Prospects for Carbon Fibres. Nature. 1971;232:304. [4] Au K. Advances in knitting technology: Elsevier; 2011.
[5] Poincloux S, Adda-Bedia M, Lechenault F. Geometry and elasticity of a knitted fabric. Phys. Rev. X. 2018;8(2):021075.
[6] Kumar B, Asadi M, Pisasale D, Sinha-Ray S, Rosen BA, Haasch R, et al. Renewable and metal-free carbon nanofibre catalysts for carbon dioxide reduction. Nat. Commun. 2013;4.
[7] Cho H, Oh I, Kang J, Park S, Ku B, Park M, et al. Catalyst and doping methods for arc graphene. Nanotechnology. 2014;25(44):445601.
[8] Cho ES, Ruminski AM, Aloni S, Liu Y-S, Guo J, Urban JJ. Graphene oxide/metal nanocrystal multilaminates as the atomic limit for safe and selective hydrogen storage. Nat. Commun. 2016;7.
[9] How GTS, Pandikumar A, Ming HN, Ngee LH. Highly exposed {001} facets of titanium dioxide modified with reduced graphene oxide for dopamine sensing. Sci. Rep. 2014;4. [10] Mathur RB, Bahl OP, Mittal J, Nagpal KC. Structure of thermally stabilized PAN fibers.
Carbon. 1991;29(7):1059-61.
[11] Sandler J, Pegel S, Cadek M, Gojny F, Van Es M, Lohmar J, et al. A comparative study of melt spun polyamide-12 fibres reinforced with carbon nanotubes and nanofibres.
Polymer. 2004;45(6):2001-15.
42
Domain size engineering of CVD graphene and its influence on physical properties. Journal of Physics D: Applied Physics. 2016;49(20):205504.
[13] Eckmann A, Felten A, Verzhbitskiy I, Davey R, Casiraghi C. Raman study on defective graphene: Effect of the excitation energy, type, and amount of defects. Phys. Rev. B. 2013;88(3):035426.
[14] Rho H, Lee S, Bae S, Kim T-W, Lee DS, Lee HJ, et al. Three-dimensional porous copper-graphene heterostructures with durability and high heat dissipation performance. Sci. Rep. 2015;5:12710.
[15] Freitag M, Steiner M, Martin Y, Perebeinos V, Chen Z, Tsang JC, et al. Energy Dissipation in Graphene Field-Effect Transistors. Nano Lett. 2009;9(5):1883-8.
[16] Cho H, Rho H, Kim JH, Chae S-H, Pham TV, Seo TH, et al. Graphene–Carbon–Metal Composite Film for a Flexible Heat Sink. ACS Appl Mater Interfaces 2017;9(46):40801-9.