HAL Id: halshs-00195883
https://halshs.archives-ouvertes.fr/halshs-00195883
Submitted on 11 Dec 2007
HAL is a multi-disciplinary open access
archive for the deposit and dissemination of
sci-entific research documents, whether they are
pub-lished or not. The documents may come from
teaching and research institutions in France or
abroad, or from public or private research centers.
L’archive ouverte pluridisciplinaire HAL, est
destinée au dépôt et à la diffusion de documents
scientifiques de niveau recherche, publiés ou non,
émanant des établissements d’enseignement et de
recherche français ou étrangers, des laboratoires
publics ou privés.
The upward bias of markups estimated from the
price-based methodology
Hervé Boulhol
To cite this version:
Hervé Boulhol. The upward bias of markups estimated from the price-based methodology. 2005.
�halshs-00195883�
Maison des Sciences Économiques, 106-112 boulevard de L'Hôpital, 75647 Paris Cedex 13
The upward bias of markups estimated
from the price-based methodology
Hervé B
OULHOL, I
XIS-C
IB&T
EAMThe Upward Bias of Markups Estimated
from the Price-Based Methodology *
Hervé Boulhol
IXIS-CIB and TEAM (University Paris I Panthéon-Sorbonne and CNRS) [email protected]
July 2005
* I am grateful to Lionel Fontagné, Sébastien Jean and Joaquim Oliveira Martins for guidance and time. I would also like to thank David Galvin, Pamina Koenig and Daniel Mirza for their help, and the participants of the seminar at Delta, the OECD and Team for their remarks.
Résumé
Des études précédentes ont souligné que la méthodologie développée par Roeger (1995) conduit à des markups trop élevés. Cette caractéristique est confirmée ici à partir des parts du capital implicites exagérément faibles. Théoriquement, le choix de normalisation, le faible ajustement du capital et les erreurs de mesure des services et du coût du capital entraînent chacun un biais à la hausse. Par exemple, le markup estimé selon cette méthodologie est en fait le markup ajusté par les rendements d’échelle associés aux facteurs variables seulement. Suivant l’analyse empirique, chacune de ces trois sources de surestimation semble jouer un rôle.
Mots clés: Markup, Fixité du capital, Concurrence imparfaite
Abstract
Previous studies have emphasized that Roeger’s methodology generates too high markups. This feature is confirmed on the basis of the unrealistically low capital shares implied by the estimates herein. Theoretically, it is shown that the normalization choice, the slow adjustment of capital and the mismeasurement of capital expenditures, each produces an upward bias. For instance, the price-based estimated markup is in fact the markup adjusted for returns to scale on the variable inputs only. Based on the empirical analysis, each of these three sources of overestimation is very likely to play a role.
Keywords: Markup, Capital Fixity, Imperfect Competition
1. Introduction
Industrial economics is indebted to Hall (1986) for estimating markups at the sectoral levels.
Improvements have then been proposed by Basu (1995), who highlights the quantitative importance of
paying greater attention to materials, and by Roeger (1995), who derives a new methodology that
circumvents intricate endogeneity issues in Hall’s approach. The purpose of this study is to contribute
to elucidating the puzzle raised by the too high level of markups estimated by Roeger’s methodology, and noted in previous studies, including Hindriks, Nieuwenhuijsen and de Wit (2000) and Olivieira
Martins (2002). The diagnosis of overestimation is made because the capital shares implied from the
estimated markups are unrealistically low, often being even negative.
Normalization issue, capital quasi-fixity and measurement error of capital expenditures, each of these
three elements is shown to bias Roeger-type markup upwards. Normalization choice is a well known issue in the cointegration literature. In a nutshell, estimating the Lerner index, from which the markup
is deduced, or the markup directly makes a noticeable difference. The econometric relationship is such
that the Roeger’s original estimate of the Lerner index produces higher markups than its direct
estimation.
However, even after accounting for the difference due to the choice of normalization, the puzzle, albeit attenuated, remains. The mismeasurement of the capital services and of the user cost are known to
be a serious concern. Under fairly general assumptions, measurement error tends to bias Roeger’s
markup upwards. Indeed the change in capital expenditures appears on both sides of Roeger’s
equations and the coefficients applied to each side make the bias caused by mismeasurement an
amplification bias.
Without downplaying the contribution of measurement error, the latter does not seem to be sufficient to
explain the magnitude of the problem. Indeed, in most of the 129 OECD two-digit series in the sample,
Roeger’s estimated markup is not significantly different from the upper bound represented by the
inverse of the sum of average labor and material shares in output. This stylized fact is consistent with
markup over average cost (i.e. the markup over marginal cost if returns to scale are constant) but to
markup over the cost of variable inputs. Therefore, markup to marginal cost will be overestimated to
the extent that the returns to scale on the variable factors are decreasing. Although Roeger himself
notes that “Hall’s original method for estimating the markup does not require the use of capital costs
and may therefore be more robust by allowing for cases in which capital is a true fixed factor of
production”, although the slow adjustment of capital is a widespread working hypothesis in both the theoretical and empirical literature, the quantitative impact of quasi-fixity on price-based markup
measures has so far been either ignored or underestimated.
Overall, the three causes highlighted above are likely to combine and provide an explanation of the
“anomaly” noted by Hindriks et al. The paper is organized as follows. Section 2 presents the primal
approach due to Hall and the price-based or dual approach innovatively developed by Roeger. Section 3 addresses the normalization issue, whereas Section 4 treats the case of quasi-fixity. Section 5
assesses the impact of the mismeasurement of capital. Section 6 provides the empirical evidence and
finally, Section 7 concludes
2. Hall-type and Roeger-type regressions
The common framework assumes a homogeneous production function:
Y= A. F(K,L,M) (1) where Y is output, K capital, L labor, M materials and A a productivity term.
2.1. Primal approach
Noting dz the logarithm differential of any given Z variable and ei the elasticity of output with respect to factor i, differentiating (1) leads to:
da dm e dl e dk e dy= k. + l. + m. + (2)
x
denoting the returns to scale, Euler’s equation can be expressed in terms of the elasticities:x e e
ek+ l+ m = (3) Substituting in (2) the elasticity of output to capital derived from (3) entails:
da dk x dk dm e dk dl e dy= l.( − )+ m.( − )+ . + (4) Finally, using the first order profit maximization conditions on the labor and material inputs, ei =µ.ai for i = L, M, establishes Hall-type specification, where aidenotes the share of factor i in output and µ the markup to marginal cost:
da dk x dk dm a dk dl a dy=µ.[ L.( − )+ M.( − )]+ . + (5)
The important point is that equation (5) is established without assuming that the marginal revenue of
capital equates its user cost. Therefore, Hall-type equation is valid even if capital is slow to adjust.
2.2. Price-based or dual approach
Conversely, the price-based approach requires that the first-order condition on capital apply, i.e.
K
K a
e =µ. . It follows from Euler’s equation (3) that the factor shares are linked according to:
µ / x a a aK + L+ M = (6a) i.e. P.Y=ν.(R.K+W.L+Q.M) (6b) where ν ≡µ/x stands for the markup adjusted for returns to scale, P being the price of output, and R,
W and Q the factor prices. As shown by Oliveira Martins, Scarpetta and Pilat (1996), Roeger’s
specification can be obtained by differentiating (6b) and by using the capital share inferred from (6a):
dpy−drk=ν.[aL.(dwl−drk)+aM.(dqm−drk)] which is denoted dx=ν .dz (7)
with dx and dz being the respective LHS and RHS variables of equation (7). Roeger’s equation links
the markup to the sensitivity of the capital share to the changes of relative factor shares. In fact,
Roeger estimates a specification equivalent to (7) but expressed in terms of the (adjusted) Lerner
index L=1−1/ν :
What are the comparative advantages of each approach? On the one hand, the main difficulty in
Hall’s, and that Roeger’s avoids, comes from the total factor productivity growth term, da, which is
correlated to RHS variables in (5). Estimations should therefore turn to instrumental variables, but
finding an efficient and valid instrument is a cumbersome task. Another advantage of Roeger’s is that
it only requires variables in value terms whereas Hall’s needs outputs and materials in volume terms.
Moreover, contrary to Hall's, Roeger's specification is unaffected whether the technological change is Harrod-neutral or biased against labor. On the other hand, Hall’s methodology allows for the
identification of both markup over marginal cost and returns to scale, whereas Roeger’s can only
estimate their ratio which is the markup over average cost. Moreover, Hall’s does not need any
computation of rental capital cost. Finally, for our purpose, the main disadvantage of Roeger’s might
be that, contrary to Hall’s, the price-based specification is not robust to the case of capital fixity.
3. Normalization issue
The first reason why Roeger’s markups could be biased upwards is linked to a well-known
normalization issue in the cointegration analysis (see Hamilton, 1994, p.589). Roeger’s methodology
based on equation (8) assumes that the cointegrating vector [(dx-dz) , dx] is normalized to unity on
the first variable. This choice makes a material difference, the more the R² is low. Indeed, let us
compare Roeger’s ν - based markup estimated from (7), dx=ν.dz, which we denote νˆ , to the original Roeger’s estimated from (8), (dx−dz)=L.dx, which is written νˆL ≡1−1/Lˆ based on the estimates of the Lerner index Lˆ. We have the following relations based on OLS estimates without a constant term (in practice, adding a constant has no impact as it is not significant):
(
)
ν ν ˆ 1 . . . . 1 ) .( ˆ 2 2 2 2 2 2 R dz dx dz dx dz dx dz dx dz dx dx L t t t t t t t t t t t − = − = − =∑
∑
∑
∑
∑
∑
∑
where Rν2 is the R-squared from (7). Consequently, it is easy to conclude that the original Roeger’s estimates are higher than ν - based markups:
ν ν ν ν ν ˆ ˆ ˆ ˆ 1 1 ˆ 2 ⇒ > = − ≡ L L R L (9)
Even though, the fit is generally good with an average Rν2 of 0.98 across the 129 (country x sector ) couples in the data described in Section 6, the average L–based markup stands at 1.147 versus 1.123
for the average ν -based markup.1 It is important to realize that the convexity of the relation linking νˆL to Lˆ has a very minor offsetting impact. Indeed a Taylor-development around Lˆ leads to:
3 ˆ / ² ˆL L L
Eν =ν +σ ν , where σ² is the variance of L, and based on the estimates, the convexity impact 3
ˆ / ² νL
σ averages a negligible 0.001. This normalization issue highlights in fact the endogeneity of Roeger’s RHS variable. This problem is also present in the ν -based specification (7) because factor inputs are co-determined with output. However, from the spirit of the markup equation, whereby firms
choose their price as a markup over cost, the specification (7) is likely to be preferred. In any case, a
better answer is given by the approach proposed by Johansen (1988), which is beyond the scope of
this study.
4. Capital fixity in the price-based approach
Equation (6b) PY =ν.COST holds in fact for COST representing the total cost of the true variable factors used by firms to maximize profits. It is essential at this point to recall the markup equation
comes from first order conditions and captures the idea of market power, i.e. the capacity firms have to
mark up variable costs in setting their prices at the desired level. If capital is fixed, at least in the short
run, then costs related to capital will be fixed costs. They will impact overall profitability but will
disappear from the markup equation which becomes:
) . . ( . .Y WL QM P =νfix + (10) Naturally in this case, the markup is adjusted for returns to scale on the variable factors only:
LM fix µ/x
ν ≡ .2 Differentiating equation (10) leads to Roeger’s specification adapted to the case of capital fixity:
1
Hindriks et al. were the first to note this hierarchy between L- and ν -based markups, without elucidating the relationship between the two measures. They concluded that ν -based estimate is more reliable because of higher R-squared levels, which is not relevant, and also because it implies more reasonable capital shares, which is (see Section 6).
2 Equation (10) is therefore strictly correct only if the production function is homogenous in the labor and material inputs. In the
general case where θ ≡(FLL+FMM)/F=x−FKK/F is not constant, after some calculations, whether capital adjusts
] . .
.[a dwl a dqm
dpy=νfix L + M (11) Based on (10), (11) is equivalent to:
dx=νfix.dz
It is essential to note that this applies to the variables dx and dz defined in (7), i.e. including the capital
expenditures. This is because the total coefficient on drk in (7) is [1−ν.(aL+aM)] which equals zero in the case of fixity.3 It is therefore immediately clear that, if capital is fixed, even in the short term, the
estimate from Roeger’s methodology will be νfix, i.e. the markup over total variable cost, and not the markup over average cost, ν . This means that, in this case, Roeger’s markup is in fact a measure of the so-called price-cost margin defined, as Schmalensee (1989, p.960) reminds us, as the difference between revenue and variable cost, i.e. the sum of labor and material expenditures, over revenue.
Therefore, even if total returns to scale are constant, Roeger’s methodology overestimates markups to
the extent that the returns to scale on the variable factors are decreasing. To make it very clear,
consider the Cobb-Douglas case, Y =KaLbM1−a−b. Roeger’s estimates will then result in
) 1 /( a
R =µ −
µ , and even under perfect competition, Roeger’s markups will be greater than unity.
5. Measurement error in the price-based approach
Before turning to the empirical evidence that the slow adjustment of capital biases Roeger’s estimates
upwards, let us consider an alternative explanation to the puzzle identified: measurement errors of
capital services and user costs. Indeed, levels of capital services are difficult to measure and
empirically identifying the role of capital in the production function has often proved to be an unfruitful quest. However, it is believed, and difficult to deny, that the growth rate of capital services is easier to
grasp. Moreover, Burnside, Eichenbaum and Rebelo (1995) have shown that the cyclical behavior of
capital services is underestimated, although the extent of this underestimation relies on the strong
assumptions made, as stressed by the discussion following the paper.
3 Based on footnote 2, this means that Roeger’s and estimates for the case of capital fixity from (10) will only differ insofar as
F K F x− K /
=
Growth rates of capital variables, stock and user cost, are generally constructed by using a measure of
the level as the denominator. There is then a serious inconsistency in putting forward a method based
on variables expressed in changes, on the grounds that growth rates only can be used and, at the
same time, to compute these series from series in levels. Indeed, Klette (1999, footnote 40) wonders
about the advantage of estimating equation (8) rather than (6b) directly.4 Moreover, it is not so obvious
that the imprecision has less impact on estimates based on methods using growth rates than on those using levels. In any case, the intent is not to focus on this argument. However, such a reasoning is
much less convincing when applied to the user cost of capital. ∆R /R can indeed be extremely volatile, especially as R is low (consider real interest rates during the oil crisis), and therefore there is little reason to believe that ∆RK /RK is better measured than RK.
The main objective in this section is to assess how measurement issues matter for the markup
estimates based on the price-based approach. To separate the issues and because we think in terms
of an alternative explanation, only the case of capital adjusting perfectly is considered.
Start from equation (7) dx=ν.dz where the RHS variable is observed with a measurement error due to the capital variable drk , an asterisk indicating an unobserved true variable:
u dz
dz= *+ (12) Classically, the error u is assumed to be independent of dz : * E(u.dz*=0) ⇒ E(u.dz)=E(u²)≡σu2
Equation (12) implies that drk =drk*−u/(aL+aM) and therefore the observed dependent variable is:
) /(
* u aL aM
dx
dx= + + (13) The true relation dx*=ν .dz*+ε is now:
ε ν ν + − + + = u a a dz dx M L . 1 . (14)
Denoting νfix= E(1/(aL+aM)), the markup if capital were a fixed factor, and the residual
fix M L a a ν ζ =1/( + )− , equation (14) becomes:
4 More generally and related to the general focus es here, Klette (1998) highlights that “From (6b) we can directly calculate the
markup, given the assumptions maintained by Roeger that (i) constant returns to scale prevail, (ii) we can impute the rental
dx =ν.dz+
(
ν fix−ν)
.u+ζ.u+εBy assuming that the error terms ε and ζ are independent of dz , and noting νR Roeger’s ν -based markup, one gets:
θ ν ν ν ν ( ). plim R= + fix− (15) where 1 *)² ( plim 0 2 2 < + = < u u dz σ σ θ (16) The impact of measurement error of the capital variables on Roeger’s estimated markup is reflected
by θ . νR is unbiased only if θ =0, but because νfix is an upper bound to the true markup ν (due to capital expenditures), Roeger’s markup is biased upwards and towards νfix. As drk is a component of the dependent variable (with coefficient -1: dx≡dpy−drk), the measurement error bias turns out to be an amplification bias: ν <νR <νfix.
In order, to establish the relation (15), the classical independence of the measurement error with dz * is critical. However, a less stringent assumption leads to a similar result. Indeed if, instead of
2 ²) ( ) . (udz E u u
E = ≡σ , the following reasonable inequalities apply:E(u.dz)>0 and E(dz.dz*)>0, then the relation (15) holds with 0<θ =E(u.dz)/(E(u.dz)+(E(dz.dz*))<1, with the same interpretation of θ as indicating the degree of measurement error.
6. Empirical evidence
Data for this study is from the OECD STAN database and is described in the Appendix. It covers
two-digit industries of thirteen OECD countries between 1970 and 2000, that is 129 (country x sector)
series in total. The estimated ν -based markup from equation (7), νˆR, will now be showed to overestimate markups adjusted for total returns to scale. Given the econometric relationships established in Section 3, this overestimation extends a fortiori to the original Roeger L–based markup
6.1. Confirming that markups are too large in the price-based approach
The estimated markup from the equation in level (6b) is denoted νˆlevel. Aside from any measurement issue, when capital adjusts perfectly, both νR and νlevel provide an unbiased estimate of the true markup ν . Note that νˆlevel is a weighted average of the observed markups vt =PRODt /COSTt for time t. Indeed, it is straightforward that:
∑
∑
∑
= = t t t t t level COST PROD COST ν ω νˆ . . 2 , where =(
∑
)
2 2 / t t t COST COST ωEmpirically, as νˆlevel is very close to the (unweighted) average of the observed markups, the estimates will be compared to νˆlevel only.
With US manufacturing sectors as an illustrative example, Table 1 shows that Roeger’s estimates are
much greater than the estimated νˆlevel, for which Durbin-Watson statistics indicate the need to correct for auto-correlation, although once done, the estimates do not change much.5 Roeger’s markups are
greater than the average level in 11 out of 14 sectors, being perceptibly lower in 1 sector only, and
Roeger’s average stands at 5.1 points above the average level.
As can be read from Table 2, this issue proves recalcitrant to very different assumptions for
computation of capital data, referring to depreciation, interest rates and initial capital stock.6 Moreover,
the capital share in total output, based on the favored computation of capital stock and rental cost –
the first one in table 2 used to produce table 1 -, varies from 3.6% for “Leather products and footwear”
to 9.8% for “Basic metals” on average over the period, mismeasurement is likely to account, only
partially, for the magnitude of the problem.
Figure 1A plots for each of the 129 (country x sector) couples the difference between νˆR and νˆlevel. This difference averages a high 7.8 points, the gap between the respective average of 1.123 and
1.045: in other words, margins calculated from the same series appear almost three times larger in the
price-based approach. In Figure 1B, the (country x sector) couples are sorted according to the size of
5
Estimates are produced from an AR(2) process for the residuals, which corrects for auto-correlation successfully.
6
the difference. The latter is negative in eight cases only, and is in the (0.025;0.150) range for three
quarters of the 129 sectors.
Obviously, it does not yet prove that the price-based approach markups are biased upwards. Indeed, if
true capital stocks - Sub-section 6.4. extends the discussion around the notion of capital services - are
only proportional and not equal to capital stocks, νˆlevel will be biased. The important point is that νˆR is just too high in absolute terms, as shown in the following, independent of the possibility that νˆlevel underestimates the true markup.
The fact that Roeger-type markups seem too large has been highlighted by other studies based on
different database. Among those studies, Hindriks et al. note that inferred capital shares from Roeger’s
estimates are unrealistically low as a large proportion run into negative territory. Table 3 compares
effective capital shares with those inferred from aK =1/νˆ−aL−aM and indicates the frequency of negative occurrences. Roeger’s estimates lead to inferred capital shares very close to zero on
average (1.8% of output, against 6.1% in the data and 5.8% inferred from the equation in level, based
on the first capital series) and negative for 43% of the 334 observations available for the USA. Note
that these results are not very sensitive to the choice of the method for computing capital data, even
though the two selected for illustration purposes – the first and third from table 2 – generate important
variations in capital share measures. As these different studies rely on different computations of
capital expenditures, this piece of evidence seems to support the fixity assumption rather than the
measurement error assumption better.
6.2. The case of capital fixity
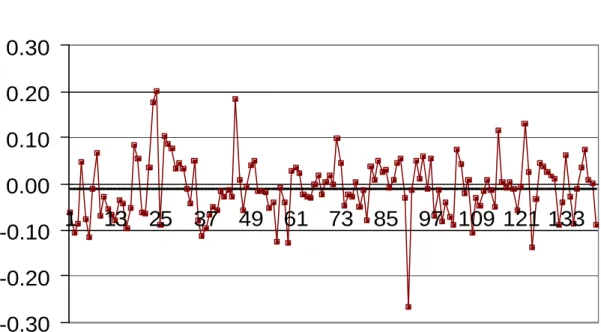
We now replicate the exercise above under the assumption of capital fixity, that is we compare νRfix from equation (11) to νlevelfix from equation (10). Figure 2A plots the difference in the two estimates for
each series in a similar way to Figure 1A. Anticipating the formal testing in Sub-section 6.3., the
difference between the two estimates is rarely significant and the average difference is -0.9 point. This
reveals that the capital series create noise in the “perfectly adjusting” case. However, the extent of that
Indeed, it is noteworthy that νR and νRfix give on average the same estimates, 1.123 and 1.120 respectively, as displayed in Figure 2B. This means that, despite the fact that νR is not sensitive to capital stock series within a multiplicative factor, drk seems to play no role in the price-based markup.
As a result, the markup estimated under the fixity assumption from the equation in level, νˆlevelfix , is very
close to Roeger’s ν - based estimated markup, νˆR. Figure 3 plots the distribution of the difference across the 129 series. The average difference is a negligible -0.3 point and the absolute difference is
lower than 2.5 points for 50% of the series, and lower than 5 points for 75%. This is a strong result
since νlevelfix represents an upper bound for any markup estimate, i.e. whatever the assumptions made.
Consequently, it is also no surprise that Roeger’s implied capital shares come out close to zero on
average.
6.3. Formal testing
The first test bluntly assesses whether equation (10) makes more sense than equation (6b). From the
following specification: u K R h M Q L W Y P. =ν.( . + . )+ .ν. . + (17) If the parameter h is not significantly different from 0 then the assumption that capital is a quasi-fixed
factor cannot be rejected. At the 95% (90% respectively) confidence level, the parameter h, is
significantly positive in only 23% (28% resp.) of the 129 sectors tested: stated differently, the fixity of
capital cannot be rejected in 77% (72% resp.) of the cases. Moreover, this result is robust to various
measures of capital stock and cost.
Table 4 and Figure 4 illustrate these results for the USA. Column 3 gives the average markup level in
the case of capital fixity: as is apparent the systematic spread with Roeger’s disappears. Then, the
estimates of equation (17) are successively reported, first bounding h between 0 and 1, and lastly
relaxing the constraints. On average, the h parameter takes a value of 0.34 and 0.22 respectively and
is almost never significantly different from 0, suggesting a very low speed of capital adjustment to the
optimal level. Moreover, the average difference between the unbounded estimate and Roeger’s mostly
is remarkable that when the initial spread between Roeger’s and level equation estimates (first two
columns) is high, the capital fixity estimate, νˆlevelfix in the third column, or the very similar unbounded
version, brings markups closer towards Roeger’s.
More importantly and more formally, the null hypothesis that the parameters νlevel, νR, fix level
ν and
fix R
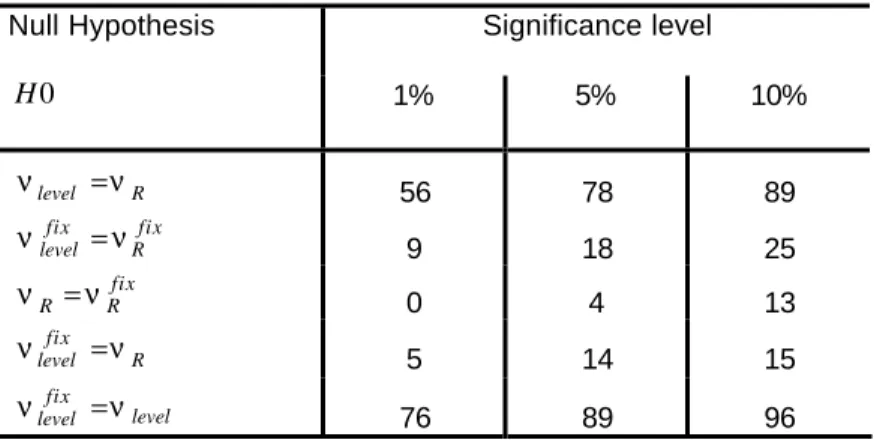
ν estimated from equations (6B), (7), (10) and (11) respectively are equal is tested, and results are reported in Table 5. At the 5% level, the equality νlevel =νR is rejected for 78 of the 129 time series.
The number of rejections falls to 18 in the fixity case (H0:νlevelfix =νRfix). More strikingly, the null
hypothesis that Roeger’s markup νR equals the upper bound νlevelfix is rejected in only 5 (15 respectively) sectors at the 1% level (10% respectively). These results are strong evidence of both the
fixity assumption and the overestimation of Roeger-type markups.
6.4. Coming back on the mismeasurement of capital services
One of the most convincing illustrations regarding the importance of properly measuring capital services, especially through the cycle, is provided by Shapiro (1993) and Burnside et al. In both cases,
the idea is that true capital services, K*, should take into account the workweek of capital, Ψ, so that: K*=Ψ.K
which entails dk*=dψ +dk
This fits well within the framework developed in Section 4, with u=(aL +aM).dψ , and is most likely to bias Roeger’s estimate towards νfix, the extent of the bias depending on the correlation between dψ
and dz . However, the bias ought not to be as large as given by θ in equation (16). The deep reason is that the approach relies on a price-based specification. The concept of the workweek of capital is
perfectly designed for the measurement of total factor productivity. However, this will have an impact
in Roeger-type equation only to the extent that additional usage of capital is more costly. In other
words, the impact of the underestimation of the changes in capital services is attenuated as concerns
the estimated price-based markup because d(rk)*−d(rk)< dψ . As Shapiro put it p.232: whether it has an impact “will depend on what the firm pays for increasing hours (of capital usage, my precision).
[…] Simple calculations based on average shift premia suggest that the incremental cost of using
capital at night is quite low. If this is the case, then the share of capital hours in cost would be low”.
7. Conclusion
The purpose of this study was to understand why markups estimated by Roeger’s methodology seem
too high, as pointed out by other studies. Normalization, i.e. the choice of which variable is the dependent in the cointegrating relationship, was shown to be one of the reasons. However, this covers
only a part of the problem. Additionally, the slow adjustment of capital and the mismeasuremement of
capital expenditures both tend to bias price-based markups upwards.
Moreover, measurement error alone could hardly account for the magnitude of the overestimation,
suggesting the three explanations combine. Finally, abstracting from mismeasurement, in the case of capital fixity, which finds strong empirical support, Roeger’s estimation leads to the markup adjusted
for returns to scale on the variable inputs only. Therefore, markup to marginal cost will be
overestimated to the extent that returns to scale on the variable factors are decreasing, a much more
likely possibility than the decreasing of the returns to scale on all production factors. This elucidates
the puzzling outcomes of previous studies pointing at negative capital shares wrongly inferred from
markup estimates.
Appendix: Data description
Data covers thirteen OECD countries: Austria, Belgium, Canada, Denmark, Finland, France, Italy,
Japan, Netherlands, Norway, Sweden, United Kingdom and United States. Two samples have been
built covering manufacturing industries at the two-digit level for the period 1970-2000 (International
Standard Industrial Classification (ISIC), third revision). One has more detailed information but is
sparse, as some sectors are missing for a number of countries, and is composed of 138 time series (a country-sector crossing). The other contains more aggregated data but is more balanced with 129
annual time series available out of a total of 143. Sector identification is given in Table A1. Note that
the averages across sectors presented in the following tables are unweighted, i.e. treating each
equally, because our prime interest lies in the mechanisms at work rather than in the impact for the
total economy.
Sectoral data come from the OECD Structural Analysis (STAN) Database. Table A1 details the 23
manufacturing sectors.
Variables
PROD: Production (Gross Output) at current prices (P.Y in the text) LABR: Labor compensation of employees (W .Lin the text)
VALU: Value added at current prices.
VALUB: Value added at basic prices. When VALUB is available, P.Y =PROD−VALU +VALUB. Materials: QM=PROD−VALU.
Capital
The price of capital, pk, used in the study is the price of investment calculated from the Gross Fixed Capital Formation at current prices (GFCF) and in volume (GFCFK). When data is not available, the
price of the GDP deflator (source OECD Economic Outlook) is chosen for pk. The user cost of capital is calculated classically according to: R= pk.(r+d−p&ka) , where r is the interest rate, d the depreciation rate and p&ka is the expected relative change in the price of capital. By default, r was chosen as the long-term interest rate (but an alternative with short-term rate was also tested), the
depreciation was fixed at 0.05 (but 0.07 was also tested, see below) and p&ka was set at the average of the price change over the last three years.
Net capital stock (NCAPK) is available directly in the data for Belgium and Italy only. For the other
countries, I calculated the series based on the Gross Fixed Capital Formation in volume (GFCFK)
according to: Kt =(1−d).Kt−1 +GFCFKt. Only, the starting point value for the net capital stock is missing to build the series. It was derived differently depending on the countries, due to data
availability. For Austria, Finland, Japan, Norway and the USA, I used the Consumption of Fixed
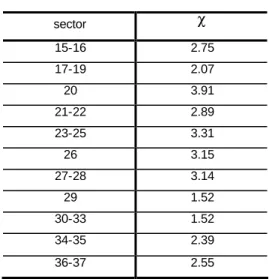
Capital (CFC) and inferred: pk0.K0 =CFC0/d for the first date. For Canada, France, the UK, the Netherlands and Sweden, I computed pk0.K0 =χ.VALU0.θ . χ is the average, for each sector across
countries for which the gross capital stock (CAPK) is available, of pk.CAPK/VALU and is reported in table A2. The parameter θ reflects the ratio of net capital stock to gross capital stock. I ran simulations based on various methodologies (double-decline, geometric, hyperbolic, see OECD, 2001)
and reasonable values of parameters to arrive at a ratio of between 0.50 and 0.85. I chose θ =0.70 by default, but compared the results with θ =0.55. Finally, as Denmark provides gross capital stock only, I used the constant ratio θ to deduce net capital stock for all dates.
I shall now detail the various computations used for the case of the USA as they appear in Table 2. K1
was calculated, as described above, from the investment flows, a depreciation rate d of 0.05 and an
initial capital stock derived from pk0.K0 =CFC0/d. K2 was calculated similarly but using d = 0.07.
With the idea of testing extreme assumptions, K3 was bluntly derived from pkt.Kt =CFCt /d for every date t and d = 0.05. K4 was calculated as K3 but with d = 0.07. I also tested as r, the average of the
References
Basu S., 1995. ‘Intermediate goods and business cycles: implications for productivity and welfare’.
American Economic Review, 85, June, 512-531.
Burnside C., Eichenbaum M., Rebelo S., 1995. ‘Capacity Utilization and Returns to Scale’. NBER
Macroeconomics Annual, 67-124, Bernanke B.S. and Rotemberg J. J. (eds), MIT Press.
Hall R.E., 1986. ‘Market structure and macroeconomic fluctuations’. Brooking Papers on Economic
Activity 2, 285-322.
Hamilton J.D., 1994. Time Series Analysis. Princeton University Press.
Hindriks F., Nieuwenhuijsen H., de Wit G., 2000.’Comparative advantages in estimating markups’.
EIM/SCALES ResearchReport, 0003/E.
Johansen S., 1988. ‘Statistical Analysis of Cointegrating Vectors’. Journal of Economic Dynamics and
Control, 12, 231-254.
Klette T.J., 1998. ‘Market Power, Scale Economies and Productivity: Estimates from a Panel of
Establishment Data’. Memorandum no. 15/98. Department of Economics, University of Oslo.
Klette T.J., 1999. ‘Market Power, Scale Economies and Productivity: Estimates from a Panel of
Establishment Data’. Journal of Industrial Economics, 4, 451-476.
OECD, 2001. Measuring capital. Available at www.oecd.org.
Oliveira Martins J., Scarpetta S., Pilat D., 1996. ‘Mark-up ratios in manufacturing industries: estimates for 14 OECD countries’. OECD Working Paper , 162.
Oliveira Martins J., 2002. ‘Mark-ups as an indicator of the degree of competition on product markets:
an overview’. Mimeo.
Roeger W., 1995. ‘Can imperfect competition explain the difference between primal and dual
productivity measures? Estimates for U.S. manufacturing’. Journal of Political Economy, 103 (2),
316-330.
Schmalensee R., 1989. ‘Inter-industry studies of structure and performance’. Handbook of
International Organisation. Chapter 16, 951-1009.
Shapiro M.D., 1993. ‘Cyclical Productivity and the Work week of Capital’. American Economic Review,
Figure 1A
Difference between Roeger-type Markup and (weighted) Average Markup Level*
level R ν νˆ −ˆ (Equations 6b and 7) -0.10 -0.05 0.00 0.05 0.10 0.15 0.20 0.25 0.30 Average difference = 0.078
(*): Each square represents one of the 129 (country x sector) couples
Figure 1B
Distribution of the Difference between Roeger-type Markup and (weighted) Average Markup Level, νˆR−νˆlevel
(% of the 129 sectors)
0%
5%
10%
15%
20%
25%
30%
<-0.05 -0.05 -0.025 -0.025 0 0 0.025 0.025 0.05 0.05 0.075 0.075 0.1 0.1 0.125 0.125 0.15 0.15 0.175 0.175 0.2 0.2 0.225 >0.225Figure 2A Case of Capital Fixity
Difference between Roeger-type Markup and (weighted) Average Markup Level* fix level fix R ν νˆ −ˆ (Equations 10 and 11)
-0.30
-0.20
-0.10
0.00
0.10
0.20
0.30
1
13
25
37
49
61
73
85
97 109 121 133
Average difference = -0.009 Figure 2BDifference between Roeger-type Markups*
Perfectly adjusting case vs capital fixity case , νˆRfix−νˆR (Equations 7 and 11)
-0.20
-0.15
-0.10
-0.05
0.00
0.05
0.10
0.15
Average difference = -0.003
Figure 3
Distribution of the Difference between Roeger-type Markup and (weighted) Average Markup Level in the Fixity Case
level fix R ν νˆ −ˆ (% of the 129 sectors) 0% 5% 10% 15% 20% 25% 30% 35% <-0.10 -0.10 -0.075 -0.075 -0.05 -0.05 -0.025 -0.025 0 0 0.025 0.025 0.05 0.05 0.075 0.075 0.1 0.1 0.125 0.125 0.15 >0.15
Difference between Roeger-type Markup and (weighted) Average Markup Level in the Fixity Case
Figure 4
Comparison between Markup Estimates (see Table 4) USA two-digit Sectors
(weighted) average markup level νˆlevel (equation 6b), Roeger’s markup νˆR (equation 7), (weighted) average markup level in the fixity case νˆlevelfix (equation 10)
0.90 1.00 1.10 1.20 1.30 15 16 19 20 21 22 23 24 25 26 27 28 34 35 Sector (ISIC number)
(weighted) average markup level, eq. (6b) Roeger's markup, eq. (7)
Table 1
Difference between Roeger’s Markups and (weighted) Average Markup Levels USA two-digit sectors, 1970-2000
Level equation (6b) (OLS) Level equation (6b) (AR2)* Roeger’s equation (7) (OLS)
Country ISIC Rev.3 νˆlevel
Durbin- Watson νˆlevel std νˆR std Durbin- Watson Roeger’s – level diffe-rence
usa 15 Food and Beverages 1.057 0.408 1.024 0.051 1.076 0.020 2.399 0,052
usa 16 Tobacco 1.130 0.970 1.124 0.029 1.227 0.041 1.667 0,103
usa 19 Leather and Footwear 1.125 0.448 1.039 0.074 1.023 0.043 2.534 -0,016
usa 20 Wood and Cork 1.098 0.720 1.096 0.011 1.219 0.036 1.885 0,122
usa 21 Pulp and Paper 1.031 0.900 1.032 0.009 1.154 0.031 1.835 0,122
usa 22 Printing and Publishing 1.075 1.045 1.075 0.007 1.140 0.035 2.799 0,065
usa 23 Coke, Ref.Petrol., Nuclear Fuel 1.041 0.615 1.037 0.018 1.026 0.033 2.194 -0,010
usa 24 Chemicals 1.126 0.133 1.143 0.040 1.169 0.032 1.438 0,026
usa 25 Rubber and Plastic 1.018 0.606 1.019 0.011 1.065 0.018 2.464 0,046
usa 26 Other Non-Metallic Mineral 1.022 0.296 1.038 0.034 1.155 0.028 2.167 0,117
usa 27 Basic Metals 0.971 0.467 1.047 0.082 1.125 0.052 2.863 0,078
usa 28 Fabricated Metal 1.080 0.162 1.078 0.013 1.105 0.021 1.263 0,027
usa 34 Motor Vehicles and Trailers 1.040 0.283 1.062 0.024 1.091 0.073 1.824 0,029
usa 35 Other Transport Equipment 0.973 1.027 0.974 0.007 0.925 0.096 2.326 -0,048
mean 1.056 1.056 0.029 1.107 0.040 0.051
(*): Estimates are produced from an AR(2) process for the residuals, which corrects for auto-correlation successfully. Standard deviations are robust to heteroscedasticity and autocorrelation.
Equation (6b): P.Y=νlevel.(R.K+W.L+Q.M)
Table 2
Robustness of the Difference across Different Measures of Capital Services and Cost* USA two-digit sectors, 1970-2000
Level equation markup estimates
level
νˆ
Difference (Roeger’s – level)
level R ν
νˆ −ˆ
Average capital share of output
sector K1 K2 K3 K4 K1 K2 K3 K4 K1 K2 K3 K4 usa 15 1.024 1.025 1.028 1.039 0.052 0.046 0.076 0.067 0.041 0.037 0.065 0.056 usa 16 1.124 1.285 1.090 1.103 0.103 -0.056 0.162 0.150 0.038 0.035 0.066 0.056 usa 19 1.039 1.038 1.053 1.072 -0.016 -0.034 0.086 0.069 0.036 0.031 0.093 0.078 usa 20 1.096 1.106 1.029 1.048 0.122 0.127 0.165 0.150 0.059 0.053 0.108 0.094 usa 21 1.032 1.038 1.015 1.031 0.122 0.127 0.105 0.089 0.086 0.081 0.095 0.082 usa 22 1.075 1.079 1.078 1.090 0.065 0.050 0.027 0.013 0.053 0.049 0.062 0.052 usa 23 1.037 1.039 1.030 1.038 -0.010 -0.017 0.045 0.037 0.049 0.045 0.056 0.048 usa 24 1.143 1.147 1.046 1.076 0.026 0.022 0.123 0.092 0.085 0.078 0.140 0.119 usa 25 1.019 1.022 1.015 1.025 0.046 0.038 0.020 -0.001 0.059 0.056 0.056 0.048 usa 26 1.038 1.050 1.027 1.044 0.117 0.115 0.117 0.102 0.085 0.077 0.084 0.072 usa 27 1.047 1.055 1.000 1.009 0.078 0.080 0.045 0.034 0.098 0.082 0.073 0.063 usa 28 1.078 1.083 1.040 1.056 0.027 0.019 0.064 0.046 0.052 0.047 0.082 0.069 usa 34 1.062 1.065 1.019 1.042 0.029 0.033 0.055 0.035 0.056 0.050 0.158 0.136 usa 35 0.974 0.979 1.003 1.008 -0.048 -0.083 0.018 0.013 0.057 0.050 0.030 0.025 mean 1.056 1.072 1.034 1.049 0.051 0.034 0.079 0.064 0.061 0.055 0.083 0.071
difference / capital share correlation 0.40 0.62 0.42 0.34
(*) Capital variables are described in the Appendix. Sector description is given in Table 1.
Note
The last row of the table computes the linear correlation coefficient between the difference in the estimates νˆR −νˆlevel (second part of the table) and the average capital share from the data, for each capital series respectively. The distinct positive
correlation is consistent with the theoretical relationship found when capital is fixed in the Cobb-Douglas case (at the end of
Table 3
Implied Capital Shares from aK =1/νˆ−aL−aM
USA two-digit sectors, 1970-2000
Capital computation : K1 Capital computation : K3 Frequency of Labor +Materials shares greater than 1 Frequency of negative implied capital share
Average capital share Frequency of negative implied
capital share
Average capital share
Coun-try Sec-tor data level level νˆ Roeger R
νˆ data level Roeger level Roeger data level Roeger usa 15 0.00 0.00 0.21 0.041 0.066 0.018 0.00 0.52 0.065 0.062 -0.004 usa 16 0.00 0.04 0.71 0.038 0.069 -0.006 0.00 0.78 0.066 0.097 -0.024 usa 19 0.00 0.00 0.00 0.036 0.112 0.126 0.00 0.39 0.093 0.099 0.030 usa 20 0.00 0.00 0.87 0.059 0.063 -0.029 0.00 0.73 0.108 0.122 -0.012 usa 21 0.00 0.00 0.83 0.086 0.083 -0.020 0.00 0.39 0.095 0.099 0.007 usa 22 0.00 0.00 0.25 0.053 0.060 0.007 0.00 0.00 0.062 0.058 0.034 usa 23 0.00 0.08 0.00 0.049 0.057 0.067 0.00 0.35 0.056 0.064 0.026 usa 24 0.00 0.04 0.42 0.085 0.050 0.030 0.00 0.39 0.140 0.130 0.031 usa 25 0.00 0.00 0.13 0.059 0.054 0.012 0.00 0.00 0.056 0.058 0.039 usa 26 0.00 0.03 0.87 0.085 0.066 -0.032 0.03 0.77 0.084 0.076 -0.024 usa 27 0.00 0.17 1.00 0.098 0.019 -0.047 0.00 0.13 0.073 0.063 0.020 usa 28 0.00 0.00 0.29 0.052 0.045 0.023 0.00 0.26 0.082 0.079 0.024 usa 34 0.00 0.21 0.42 0.056 0.020 -0.004 0.04 0.35 0.158 0.061 0.009 usa 35 0.21 0.13 0.04 0.057 0.047 0.101 0.21 0.26 0.030 0.017 0.000 mean 0.015 0.050 0.430 0.061 0.058 0.018 0.020 0.380 0.083 0.077 0.011
Table 4
Blunt Test of the Capital Fixity Assumption
u K R h M Q L W Y P. =ν.( . + . )+ .ν. . + level AR(2) Roeger’ s level AR(2) level AR(2) level AR(2) h = 1 h = 0 0< h < 1 unbounded h (1) (2) (3) (4) (5)
country sector νˆlevel νˆR
fix level νˆ s.d. ν h s.d. (h) ν h s.d. (h) usa 15 1.024 1.076 1.049 0.048 1.043 0.25 0.37 1.043 0.25 0.37 usa 16 1.124 1.227 1.171 0.054 1.145 0.57 1.10 1.145 0.57 1.10 usa 19 1.039 1.023 1.050 0.076 1.039 1.00 0.00 1.037 1.26 1.56 usa 20 1.096 1.219 1.170 0.014 1.170 0.00 0.00 1.187 -0.22 0.39 usa 21 1.032 1.154 1.141 0.010 1.140 0.00 0.00 1.180 -0.33 0.22 usa 22 1.075 1.140 1.146 0.005 1.141 0.07 0.51 1.141 0.07 0.51 usa 23 1.037 1.026 1.027 0.027 1.027 0.00 0.00 1.042 -0.93 0.84 usa 24 1.143 1.169 1.158 0.049 1.149 0.18 0.35 1.149 0.18 0.35 usa 25 1.019 1.065 1.038 0.038 1.029 0.20 0.32 1.029 0.20 0.32 usa 26 1.038 1.155 1.084 0.064 1.084 0.00 0.00 1.098 -0.21 0.37 usa 27 1.047 1.125 1.073 0.016 1.073 0.00 0.00 1.123 -0.44 0.09 usa 28 1.078 1.105 1.100 0.021 1.080 0.96 0.33 1.080 0.96 0.33 usa 34 1.062 1.091 1.110 0.018 1.081 0.56 0.60 1.081 0.56 0.60 usa 35 0.974 0.925 1.032 0.009 0.974 1.00 0.00 0.932 1.79 1.05 mean 1.056 1.107 1.096 0.032 1.084 0.34 1.091 0.22
Table 5 Formal Tests:*
Number of sectors for which the equality of the parameters can be rejected out of the 129 (country x sector) time series
Null Hypothesis Significance level
0 H 1% 5% 10% R level ν ν = 56 78 89 fix R fix level ν ν = 9 18 25 fix R R ν ν = 0 4 13 R fix level ν ν = 5 14 15 level fix level ν ν = 76 89 96
(*):Standard deviations used are robust to heteroscedasticity and autocorrelation.
Equations ) . . . ( . .Y RK W L QM P =νlevel + + (6b) )] .( ) .( .[a dwl drk a dqm drk drk dpy− =νR L − + M − (7) ) . . ( . .Y W L QM P =νlevelfix + (10) ] . . .[a dwl a dqm dpy L M fix R + =ν (11)
Reading: The null hypothesis that the markup estimated from the equation in level (6b) equals the
markup estimated from the price-based equation (7) is rejected in 78 sectors out of the 129 in the
Table A1: ISIC Rev. 3 Classification
Sector desrciption More aggregated sample
15 FOOD PRODUCTS AND BEVERAGES 15-16
FOOD PRODUCTS, BEVERAGES AND TOBACCO
16 TOBACCO PRODUCTS 17-19
TEXTILES, TEXTILE PRODUCTS, LEATHER AND FOOTWEAR
17 TEXTILES 20 WOOD AND PRODUCTS OF WOOD AND CORK
18 WEARING APPAREL, DRESSING, DYING OF FUR 21-22
PULP, PAPER, PAPER PRODUCTS, PRINTING AND PUBLISHING
19
LEATHER, LEATHER PRODUCTS AND
FOOTWEAR 23-25
CHEMICAL, RUBBER, PLASTICS AND FUEL PRODUCTS
20 WOOD AND PRODUCTS OF WOOD AND CORK 26 OTHER NON-METALLIC MINERAL PRODUCTS
21 PULP, PAPER AND PAPER PRODUCTS 27-28
BASIC METALS AND FABRICATED METAL PRODUCTS
22 PRINTING AND PUBLISHING 29 MACHINERY AND EQUIPMENT, N.E.C.
23
COKE, REFINED PETROLEUM PRODUCTS AND
NUCLEAR FUEL 30-33 ELECTRICAL AND OPTICAL EQUIPMENT 24 CHEMICALS AND CHEMICAL PRODUCTS 34-35 TRANSPORT EQUIPMENT
25 RUBBER AND PLASTICS PRODUCTS 36-37 MANUFACTURING NEC; RECYCLING
26 OTHER NON-METALLIC MINERAL PRODUCTS
27 BASIC METALS
28
FABRICATED METAL PRODUCTS, except machinery and equipment
29 MACHINERY AND EQUIPMENT, N.E.C.
30
OFFICE, ACCOUNTING AND COMPUTING MACHINERY
31
ELECTRICAL MACHINERY AND APPARATUS, NEC
32
RADIO, TELEVISION AND COMMUNICATION EQUIPMENT
33
MEDICAL, PRECISION AND OPTICAL INSTRUMENTS
34
MOTOR VEHICLES, TRAILERS AND SEMI-TRAILERS
35 OTHER TRANSPORT EQUIPMENT
36 MANUFACTURING NEC
37 RECYCLING
Table A2: Computation of initial capital stock for each sector:
Average over time and countries (Belgium, Canada, Finland, France and Italy) of
VALU CAPK pk. / sector χ 15-16 2.75 17-19 2.07 20 3.91 21-22 2.89 23-25 3.31 26 3.15 27-28 3.14 29 1.52 30-33 1.52 34-35 2.39 36-37 2.55