HAL Id: hal-02637870
https://hal.inrae.fr/hal-02637870
Submitted on 28 May 2020
HAL is a multi-disciplinary open access archive for the deposit and dissemination of sci-entific research documents, whether they are pub-lished or not. The documents may come from teaching and research institutions in France or abroad, or from public or private research centers.
L’archive ouverte pluridisciplinaire HAL, est destinée au dépôt et à la diffusion de documents scientifiques de niveau recherche, publiés ou non, émanant des établissements d’enseignement et de recherche français ou étrangers, des laboratoires publics ou privés.
tomato and eggplant
Flora Pensec, Aurore Lebeau, Marie-Christine Daunay, Frédéric Chiroleu,
Alice Guidot, Emmanuel Wicker
To cite this version:
Flora Pensec, Aurore Lebeau, Marie-Christine Daunay, Frédéric Chiroleu, Alice Guidot, et al.. To-wards the identification of Type III effectors associated to Ralstonia solanacearum virulence on tomato and eggplant. Phytopathology, American Phytopathological Society, 2015, 105 (12), pp.1529-1544. �10.1094/PHYTO-06-15-0140-R�. �hal-02637870�
Version postprint
Version postprint
Towards the identification of Type III effectors
associated to Ralstonia
1
solanacearum virulence on tomato and eggplant
2Flora Pensec1*, Aurore Lebeau1, MC Daunay2, Frédéric Chiroleu1, Alice Guidot3, Emmanuel 3
Wicker1 4
1 CIRAD, UMR 53 Peuplements Végétaux et Bioagresseurs en Milieu Tropical (PVBMT),
5
Saint-Pierre, La Réunion, France 6
2
INRA, Centre d’Avignon, Unité de Génétique et Amélioration des Fruits et Légumes, 7
UR1052, Montfavet, France 8
3INRA, UMR 441 Laboratoire des Interactions Plantes-Microorganismes (LIPM),
Castanet-9
Tolosan, France 10
*Present address : Institut National de la Recherche Agronomique, UMR A 1131 Santé de la 11
Vigne et Qualité du Vin (SVQV), Colmar, France. Université de Strasbourg, Strasbourg, 12
France 13
14
Author for correspondence: Emmanuel Wicker. Tel +262 262 49 92 42, e-mail: 15
wicker@cirad.fr 16
Phytopathology "First Look" paper • http://dx.doi.org/10.1094/PHYTO-06-15-0140-R • posted 09/14/2015
Version postprint
Version postprint
ABSTRACT 17
For the development of pathogen-informed breeding strategies, identifying the microbial 18
genes involved in interactions with the plant is a critical step. To identify Type III effector 19
(T3E) repertoires associated to virulence of the bacterial wilt (BW) pathogen Ralstonia 20
solanacearum on Solanaceous crops, we used an original association genetics approach
21
combining DNA microarray data and pathogenicity data on resistant eggplant, pepper and 22
tomato accessions. From this first screen, twenty-five Type III effectors were further full-23
length PCR-amplified within a 35-strain field collection, to assess their distribution and allelic 24
diversity. Six T3E repertoire groups were identified, within which 11 representative strains 25
were chosen to challenge the BW-resistant eggplants “Dingras multiple Purple” and “AG91-26
25”, and the tomato Hawaii 7996. The virulence or avirulence phenotypes could not be 27
explained by specific T3E repertoires, but rather by individual T3E genes. We identified seven 28
highly avirulence-associated genes, among which ripP2, primarily referenced as conferring 29
avirulence to Arabidopsis thaliana. Interestingly, no T3E was associated to avirulence to both 30
eggplants. Highly virulence-associated genes were also identified: ripA5_2, ripU, and ripV2. 31
This study should be regarded as a first step towards investigating both avirulence or 32
virulence function of the highlighted genes, but also their evolutionary dynamics in natural R. 33
solanacearum populations.
34
Phytopathology "First Look" paper • http://dx.doi.org/10.1094/PHYTO-06-15-0140-R • posted 09/14/2015
Version postprint
Version postprint
INTRODUCTION
35Effective and durable control of plant pathogens is a critical challenge for global food 36
security. Once a pathogen has established in an area, the use of genetically resistant plants is 37
one of the most effective control approaches, particularly against bacterial pathogens for 38
which chemical control and agricultural practices remain ineffective or unpractical solutions 39
(Strange and Scott 2005). Now the central challenge of this approach is the identification of 40
broad-spectrum and durable resistance genes/QTLs. Resistance durability was first measured 41
retrospectively (see for example van den Bosch and Gilligan (2003)), but recent studies 42
demonstrated that this trait may be inferred from the resistance level and spectrum of the plant 43
R genes/QTLs and their genetic background (Palloix et al. 2009, Quenouille et al. 2014). 44
Evolutionary potential of the pathogen (McDonald and Linde 2002), and specifically 45
evolutionary forces at work on the pathogen genes involved in virulence are also important 46
traits for resistance durability. Leach’s seminal paper proposed that durability of plant R genes 47
could be inferred from the pathogen fitness penalty induced by adaptation to this gene, 48
including the loss of the cognate avirulence gene (Leach et al. 2001). 49
In the model currently describing the evolution of plant-pathogen microbes interactions (Jones 50
and Dangl 2006), pathogens secrete effectors that suppress or subvert the resistance responses 51
triggered by microbe-associated molecular patterns (MAMPs). This dichotomy between 52
MAMP-Triggered immunity (MTI) and Effector-Triggered Immunity (ETI) has been recently 53
questioned by Cook et al. (2015), who proposed to consider the plant innate immunity as “a 54
system that evolves to detect invasion”. Plant-pathogenic bacteria possess a large repertoire of 55
secreted effectors, where the Type III Secretion System (T3SS) plays a central role in 56
virulence (Kenny and Valdivia 2009). Numerous functional genetics assays have tried to 57
decipher the respective role of many individual effectors (for a review, see for example 58
Phytopathology "First Look" paper • http://dx.doi.org/10.1094/PHYTO-06-15-0140-R • posted 09/14/2015
Version postprint
Version postprint
(Chang et al. 2014, Feng and Zhou 2012)), but the association of individual effectors to an 59
avirulence or virulence phenotype remains problematic due to functional redundancy (Cunnac 60
et al. 2011). Genome-wide association mapping may be a promising alternative approach, 61
allowing to associate not only individual genes but gene repertoires to a phenotype (Falush 62
and Bowden 2006). We applied such an approach on the soilborne Beta-Proteobacterium 63
Ralstonia solanacearum, a vascular plant pathogen whose host range is particularly huge
64
(more than 54 botanical families). It induces bacterial wilt (BW) on Solanaceae but also more 65
than fifty other families (among which Zingiberaceae, Fabaceae, Myrtaceae, …), causing 66
heavy losses throughout the tropical and subtropical belt in Asia, Africa, and America. 67
Breeding efforts for resistance to this disease have been hindered for years by the lack of 68
complete resistance genitors, the strong interactions between resistance and local strains, as 69
well as by the huge genomic and phenotypic plasticity of the pathogen. Among 70
proteobacterial plant pathogens, R. solanacearum possesses a very large repertoire of genes 71
contributing to virulence, including genes involved in aero- and chimio-tactism (Yao and 72
Allen 2006, 2007), reactive oxygen species (ROS) detoxification (Flores-Cruz and Allen 73
2011), multidrug efflux pumps (Brown et al. 2007), Tat secretome (Gonzalez et al. 2007), but 74
the secreted proteins (effectors) distributed by the T3SS constitute the key virulence factors 75
(Poueymiro and Genin 2009). Whereas most proteobacterial plant pathogens possess 20-30 76
Type III effectors (or T3E), R. solanacearum meta-repertoire gathers 94 families (orthologous 77
groups) (Peeters et al. 2013), and individual strains usually carry 60-75 effectors (Deslandes 78
and Genin 2014). Genes governing specific plant-R.solanacearum interactions have been 79
identified in the model plants Arabidopsis thaliana and Medicago truncatula (for a review, 80
see Deslandes and Genin (2014)). The most documented example is the acetyltransferase 81
popP2 (Deslandes et al. 2003), recently renamed ripP2 (Peeters et al. 2013), whose interaction 82
with the A.thaliana gene RRS1-R (Deslandes et al. 1998, Deslandes et al. 2002 ) and the 83
Phytopathology "First Look" paper • http://dx.doi.org/10.1094/PHYTO-06-15-0140-R • posted 09/14/2015
Version postprint
Version postprint
cysteine protease RD19 (Bernoux et al. 2008) triggers plant immunity, making it the first 84
avirulence gene described in R. solanacearum. It was recently demonstrated that RRS1-R 85
forms a receptor complex with RPS4 (conferring resistance to Pseudomonas syringae) that 86
detect the WRKY-targeting effectors, and convert the lysine-acetylase activity of RipP2 to 87
immunity (Le Roux et al. 2015, Sarris et al. 2015). Other effectors have been identified, such 88
as the cysteine protease ripP1 that elicits a Hypersensitive Response (HR) on some Petunia 89
(Poueymiro et al. 2009, Poueymiro and Genin 2009) and tobacco species, and RipG7 which is 90
required for pathogenicity on Medicago truncatula (Angot et al. 2006). Whereas, bacterial 91
genetic factors that are critical for virulence and avirulence to cultivated species remain 92
largely unknown. The Zinc-dependent protease rip36 (Nahar et al. 2014), renamed ripAX2 93
(Peeters et al. 2013), induces a HR on Solanum torvum, a wild relative of eggplant. RipA2 94
contributes to pathogenicity to tomato, whereas ripA5 elicits a HR-like on some tobacco 95
species (Sole et al. 2012). The ripG2, ripG3, ripG6 and ripG7 effector proteins collectively 96
contribute to pathogenicity to tomato and Arabidopsis (Remigi et al. 2011). 97
By challenging reference resistance genitors of tomato, eggplant and pepper (CoreTEP) to a 98
worldwide collection of R. solanacearum strains (CoreRS2), Lebeau et al. (2011) identified 99
several cases of “incompatible interactions”, phenotyped as “no wilt and no colonization”, 100
that may be indicative of gene-for-gene interactions. One of the accessions involved in such 101
incompatible interactions was the eggplant AG91-25, which carries the ERs1 resistance gene 102
(Lebeau et al. 2013). The coreRS2 strains were hybridized on a DNA microarray (Guidot et 103
al. 2009, Remenant et al. 2010), in order to get access to their gene content. The combined 104
analysis of such genotypic and phenotypic data was carried out in order to identify phenotype-105
associated genes. 106
In this study we thus aimed to identify, by a top-down approach sensu Falush and Bowden 107
(2006), the R. solanacearum T3E gene repertoires associated with avirulence or virulence 108
Phytopathology "First Look" paper • http://dx.doi.org/10.1094/PHYTO-06-15-0140-R • posted 09/14/2015
Version postprint
Version postprint
phenotypes on resistant eggplant, pepper, and tomato cultivars. The specific questions we 109
addressed were: (i) what is the T3E distribution variability in a large strain collection ?; (ii) is 110
the virulence on Solanaceae explained by T3E repertoires, individual T3E presence/absence, 111
or individual T3E allelic differences ?; (iii) are the avirulence /virulence effectors involved in 112
interactions with several cultivars, or is there a cultivar-specificity (Lewis et al. 2014) ? 113
Phytopathology "First Look" paper • http://dx.doi.org/10.1094/PHYTO-06-15-0140-R • posted 09/14/2015
Version postprint
Version postprint
M
ATERIALS AND METHODS
114
Bacterial strains 115
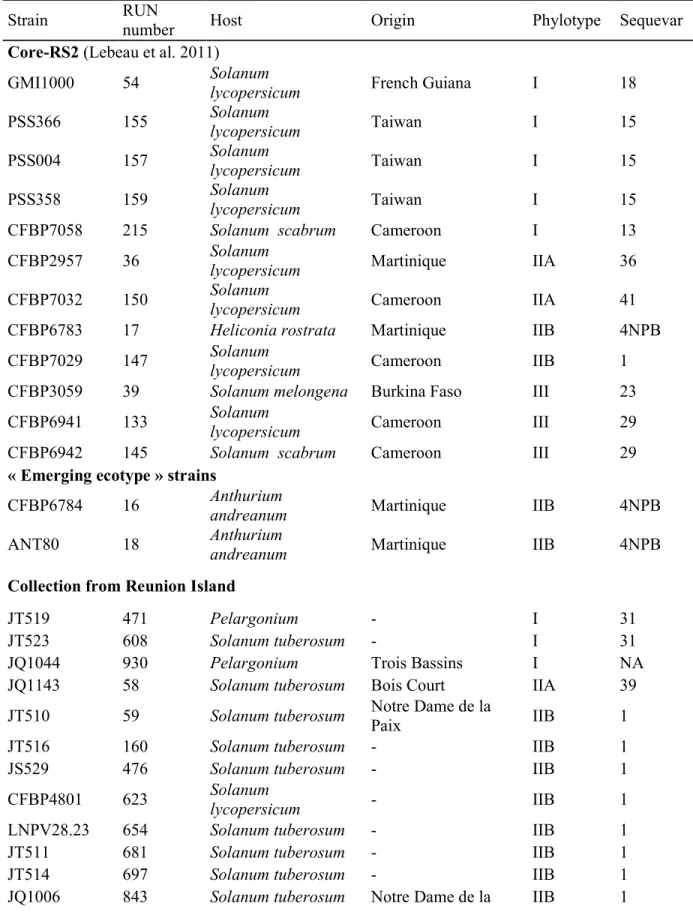
Two Ralstonia solanacearum strain collections were used for this study. A first set of 12 116
international strains called coreRS2 was selected from a global reference collection, based on 117
their aggressiveness on tomato, eggplant and pepper susceptible reference accessions (Lebeau 118
et al. 2011); this was used from the first step of this study. Two additional strains belonging to 119
the highly harmful “emerging ecotype” (Wicker et al. 2007) were added to this set but were 120
studied only from the second step of our study. The second set gathered 35 “environmental” 121
strains collected on different diseased hosts throughout Reunion Island (Table 1). Bacterial 122
strains were all stored in Cryobank beads at -80°C. They were grown first on Nutrient Broth 123
overnight at 28°C, then streaked (50 µL) on Kelman’s triphenyl tetrazolium chloride (TZC) 124
agar medium (Kelman 1954) supplemented with 1% yeast extract, and sub-cultured two days 125
at 28°C. Bacterial DNA was extracted from fresh cultures (~1.0 to 2.0 x 10⁹ cells), using the 126
DNeasy Blood and Tissue kit (QIAGEN) following the manufacturer’s instructions for Gram-127
negative bacteria; DNA solutions were then quantified with a NanoDrop ND-8000 128
spectrophotometer (NanoDrop technologies Inc., Wilmington, DE, USA), adjusted to 10 129
ng.µL-1, and stored at -20°C until use. 130
131
Plant accessions 132
Tomato, eggplant, and pepper accessions were chosen within the core-TEP according to their 133
bacterial wilt (BW)-resistance level and spectrum (Lebeau et al. 2011) (Table 2). For tomato, 134
L390 (coded T10 throughout the article) is highly susceptible (Lebeau et al. 2011, Truong et 135
al. 2008, Wang et al. 1998). The accession Hawaii7996 (encoded T5) displays the highest 136
resistance level, and controls the broadest spectrum of strains (Lebeau et al. 2011); it is also 137
the best known BW-resistant tomato accession, with several mapped quantitative trait loci 138
Phytopathology "First Look" paper • http://dx.doi.org/10.1094/PHYTO-06-15-0140-R • posted 09/14/2015
Version postprint
Version postprint
(QTLs) (Carmeille et al. 2006, Wang et al. 2013, Wang et al. 2000). For eggplant, the 139
susceptible accession chosen was MM738 (encoded E8 by Lebeau et al.(2011) and in the 140
following), given its high susceptibility (Lebeau et al. 2011) and its status of susceptible 141
parent of the mapping population MM738xAG91-25 (Lebeau et al. 2013). The resistant 142
accessions chosen display complete incompatible interactions (i.e. no wilt and no stem 143
colonization) with at least one R. solanacearum strain of the coreRS2 : (i) Dingras multiple 144
Purple, referenced as MM853 in INRA germplasm collection (E1 in this study), displays both 145
a high resistance level and a broad resistance spectrum; (ii) SM6, referenced as MM643 (E2 146
in this study), is completely resistant to phylotype IIB “emerging strains”(Deberdt et al. 2014, 147
Lebeau et al. 2011) but also IIA and III strains (detailed in table 3); (iii) Ceylan, referenced as 148
MM152 (E3 in this study), is completely resistant to phylotype I, IIA and III strains (table 3); 149
(iv) Surya, referenced as MM1811 (E4 in this study), is resistant to IIA and III strains; and (v) 150
AG91-25, referenced as MM960 (E6 in this study), is totally resistant to strain CFBP6942 151
(encoded RUN0145) and is poorly colonized by CFBP7032 (RUN0150) and PSS366 152
(RUN0155), whereas susceptible to virulent strains (N'Guessan et al. 2012). AG91-25 also 153
carries the dominant gene Ers1, the first BW-resistance gene identified in a crop (Lebeau et 154
al. 2013). For pepper, resistant accessions were (i) P687 (P2 in this study), resistant to 155
phylotype I strains, (ii) CA8, referenced as PM1580 (P6 in this study), resistant to phylotype 156
IIA strains, (iii) Perennial, referenced as PM659 (P8 in this study), resistant to phylotype III 157
strains (Table 3). 158
159
Comparative Genomic Hybridization (CGH) data 160
The DNA microarray used in these experiments, generated by C. Boucher and collaborators 161
(INRA-CNRS, Toulouse, France), consisted of 6516 65-mer and 70-mer oligonucleotides 162
representative of the genes identified within the R. solanacearum genomes GMI1000 163
Phytopathology "First Look" paper • http://dx.doi.org/10.1094/PHYTO-06-15-0140-R • posted 09/14/2015
Version postprint
Version postprint
(phylotype I), IPO1609 (phylotype IIB /clade 5/sequevar 1) and MOLK2 (phylotype IIB 164
/clade 5 /sequevar 3), as previously described (Remenant et al. 2010, Wicker et al. 2012). 165
Each gene was represented by a single oligonucleotide, except for 117 Type III effector (T3E) 166
or effector-like genes, which were represented by two to six oligonucleotides to distinguish 167
allelic forms of a given gene. Each oligonucleotide was spotted twice on a microarray. DNA 168
extraction and labelling, microarray hybridization, hybridization analyses and gene detection 169
threshold are detailed in Guidot et al.(2007) and Remenant et al.(2010). Effector data sets 170
were complete for 10 coreRS2 strains; however in the case of PSS4 (RUN0157) and PSS366 171
(RUN0155), only 65 effectors out of 117 were correctly identified. In downstream analyses, 172
these two strains were thus analyzed apart from the others. 173
174
Identification of genes associated with effector probes 175
The correspondence between original probe names and Rip T3E new nomenclature (Peeters et 176
al. 2013) was established by using the “RalstoT3E” website hosted in LIPM Toulouse 177
(https://iant.toulouse.inra.fr/bacteria/annotation/cgi/ralso_effectome/ralso_effectome.cgi). 178
179
Genotype/phenotype association Workflow 180
The whole process, articulated in three main steps, is summarized on Figure 1. 181
STEP 1: CGH screening of gene repertoires for association with virulence 182
In the literature, genes that were experimentally demonstrated as involved in R. solanacearum 183
virulence are genes encoding Type III effectors (T3E) and the T3SS (Poueymiro and Genin 184
2009), genes involved in bacterial motility (Tans-Kersten et al. 2004, Tans Kersten et al. 185
2001), aero-and chemotaxis (Yao and Allen 2006, 2007), transcription regulation, toxin 186
resistance (Brown et al. 2007, Gonzalez et al. 2007), and genes encoding extracellular 187
Phytopathology "First Look" paper • http://dx.doi.org/10.1094/PHYTO-06-15-0140-R • posted 09/14/2015
Version postprint
Version postprint
enzymes secreted through the Type II Secretion System (Denny 2006). In this work, we 188
focused on the distribution of Type III effectors or T3E-like coding sequences within the 12 189
strains of the first collection, and on their association with virulence phenotypes. Distribution 190
patterns of the other genes were investigated in a preliminary study but no correlation with 191
virulence phenotypes was found. 192
We considered 117 genes present on the 7K microarray, including 79 T3E sensu Poueymiro 193
and Genin (2009) and 10 putative T3Es, six genes (hpaB, hrpZ, hrpY, hrpX, hrpW, hrpV) 194
coding for the T3SS, and 22 coding sequences that shared homologous domains with T3E 195
from different bacterial genera, or that contained homeobox domain. Each gene or coding 196
sequence was represented by 2 to 5 probes. 197
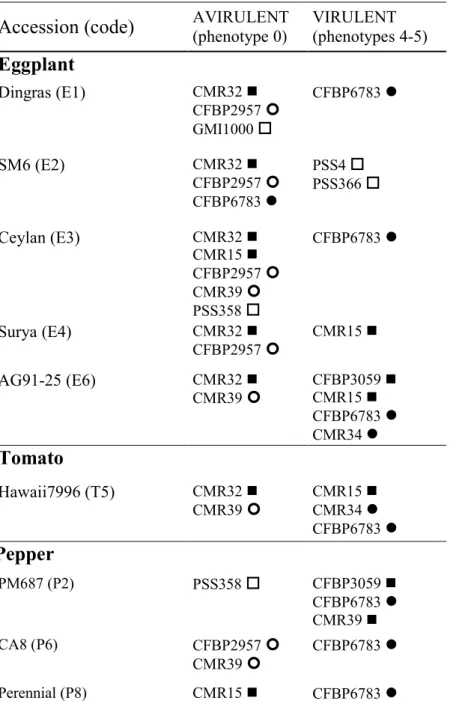
Association of Type III effectors with virulence or avirulence on Solanaceae.- To identify 198
genes associated with virulence or avirulence, we considered published phenotyping data 199
obtained on the core-collections of BW-resistant tomato, eggplant and pepper (coreTEP) 200
(Lebeau 2010, Lebeau et al. 2011). We particularly focused on plant accessions displaying 201
incompatible interactions (defined on this pathosystem as “zero wilting AND zero 202
colonization”) with at least one R. solanacearum strain, i.e. (i) eggplant lines Dingras 203
Multiple Purple (MM853), SM6 (MM643), Ceylan (MM152), Surya (MM1811), AG91-25 204
(MM960), respectively encoded here as E1, E2, E3, E4, E6, (ii) pepper lines PM687, CA8 205
(PM1580) and Perennial (PM659), respectively encoded P2, P6 and P8, and (iii) tomato 206
Hawaii7996 (encoded T5) (Lebeau et al. 2011) (Table 3).Thus, we distinguished a “avirulent 207
strains” pool and a “virulent strains” pool for each accession considered, and compared their 208
gene content as estimated from CGH data. All probes present in avirulent pool and absent in 209
virulent pool were assigned to the “putative avirulence” gene probes, whereas all probes 210
absent in avirulent pool and present in virulent pool were assigned as “putative virulence” 211
gene probes. We then assessed the association of each T3E gene with avirulence/virulence by 212
Phytopathology "First Look" paper • http://dx.doi.org/10.1094/PHYTO-06-15-0140-R • posted 09/14/2015
Version postprint
Version postprint
considering the frequency of its respective probes within “avirulent strains” and “virulent 213
strains” pools. 214
215
STEP 2: PCR genotyping on selected Type III effector genes 216
The CGH data screening allowed to retain a set of 25 genes, associated to virulence or 217
avirulence. The distribution of these 25 genes was PCR–checked within the two strain 218
collections described above. These genes consisted of two harpin genes, popW (Li et al. 2010) 219
and hrpZ (Lin et al. 2010), and 23 putative or validated Type III effectors (Peeters et al. 2013). 220
PCR primer design- Since effector gene sequences are available for only a few strains 221
belonging to our collections, we aligned determined orthologous effector sequences of 222
GMI1000 (phylotype I), CMR15 (Phylotype III), PSI07 (Phylotype IV), IPO1609, Molk2 223
(both in phylotype IIB) and CFBP2957 (phylotype IIA). Orthologous gene families were 224
defined from the T3E sequences found within the complete genome sequences harbored in the 225
Mage Web interface (http:/genoscope.cns.fr/microscope/mage) of the MicroScope platform. 226
On this platform, search for orthologous genes was performed by applying the following 227
parameters: (i) gene identity above 80%; (ii) ratios of alignment lengths computed for each 228
comparison using the BLAST software (minLrap and maxLrap) above 90%. We also used the 229
“Ralsto-T3E” website (https://iant.toulouse.inra.fr/bacteria/annotation/site/prj/T3Ev2/) to 230
assign each coding sequence to a rip family following the nomenclature proposed in the 231
reference paper of Peeters et al. (2013). 232
Based on these alignments, we identified conserved zones and designed the primers that 233
would enable to amplify putative T3E in all the strains studied. When possible, the primers 234
were designed to amplify entire genes; for gene sizes exceeding 1 kb, primers were designed 235
to amplify several gene fragments. Primer design was performed using the Primer 3 software 236
Phytopathology "First Look" paper • http://dx.doi.org/10.1094/PHYTO-06-15-0140-R • posted 09/14/2015
Version postprint
Version postprint
(http://frodo.wi.mit.edu/primer3/input.htm) following the parameters: annealing temperature 237
around 60°C and primer size between 18 and 25 nucleotides. All PCR primer sequences and 238
PCR conditions are detailed in the Table S6. 239
Gene amplification and visualization - For each strain, putative effectors were PCR 240
amplified on 20 ng sample DNA template. PCR reactions (total volume of 25µL) consisted of 241
1U of Red Goldstar Taq DNA polymerase, 25 pmol of each primer, 1X PCR buffer, 1,5 mM 242
MgCl2, 0.2 mM of each dNTPs and 1X Q-solution. The reaction was cycled in Eppendorf
243
Mastercycler Gradient or Applied Biosystems “GenAmp PCR System 9700” thermocyclers 244
with a first denaturation step at 96°C for 5 min at followed by 30 cycles of 30 s at 95°C, 60 s 245
at 56 °C, and 60 s per kb at 72°C, and a final elongation step of 10 min at 72°C. All PCR 246
products were resolved on a 2% agarose gel and visualized with UV light after ethidium 247
bromide staining (5 µg.mL-1); fragment sizes were estimated as compared with a 100 bp DNA 248
ladder (New England BioLabs). 249
250
STEP 3: Pathogenicity tests (phenotyping) with representative strains 251
Tomato (susceptible T10, and resistant T5) and eggplant (susceptible E8, resistant E1 and E6) 252
seeds were sown in a greenhouse respectively 4 and 3 weeks before inoculation and were 253
transplanted one week later into FLORADUR potting mix (9x9 cm pots). Once the stage 254
“three to four fully expanded leaves” was reached, plants were transferred (at least two days 255
before inoculation) into a high quarantine security level (NS3) growth chamber (Rotoplan), to 256
cope with inoculation of exotic strains (notably from the “emerging ecotype” [phylotype 257
IIB/clade4/sequevar 4NPB]). Climatic parameters were set at 85% relative humidity, with a 258
photoperiod of 12h, and a thermoperiod of 30°C day / 24°C night (± 2°C). Bacterial 259
suspensions of selected strains were prepared in Tris Buffer (108 cells.mL-1), and inoculated (5 260
Phytopathology "First Look" paper • http://dx.doi.org/10.1094/PHYTO-06-15-0140-R • posted 09/14/2015
Version postprint
Version postprint
mL per plant) as previously described (N'Guessan et al. 2012) after root scarification. Each 261
strain was inoculated on 15 plants from each accession. The experiment was repeated once. 262
Bacterial wilt incidence and severity were monitored every 2 to 3 days for 28 days, by using a 263
0 to 4 scale which conveys the percentage of leaves wilted (N'Guessan et al. 2012). Each plant 264
that scored 3 and 4 was considered wilted. Plants showing no symptoms at the end of the 265
experiment were harvested and sampled for latent infections as previously described (Deberdt 266
et al. 2014, Lebeau et al. 2011, N'Guessan et al. 2012). The percentage of wilted plants and 267
the colonization index (Prior et al. 1996) were thus accessed. 268
269
Data analysis 270
All statistical analyses were done using the R software, version 3.1.3 (R 2013). 271
Typologies of T3E gene repertoires (STEP 2) - For each strain, the expected PCR results 272
were (i) presence or absence of the T3E, as estimated by PCR amplification success or failure, 273
and (ii) the size of the amplified fragment. For each putative gene, class 1 corresponded to a 274
fragment amplification of the expected size, class 2 referred to no amplification, and classes 3 275
to 6 corresponded to the different alleles (band size) obtained after amplification. Each class, 276
named “allele score” further down in the paper, was considered a qualitative factor within 277
each variable (T3E gene or Coding Sequence (CDS)). The strains were then clustered on the 278
basis of each allele score for all 25 genes amplified, using an agglomerative hierarchical 279
clustering (Maechler et al. 2015) with the Euclidean distance and considering the “Ward” 280
method. We identified the variables (genes) best describing each cluster (named “Type III 281
effector Repertoire Group” [TRG] further down) by using a Chi-squared test (Husson et al. 282
2009, Husson et al. 2015). 283
Phytopathology "First Look" paper • http://dx.doi.org/10.1094/PHYTO-06-15-0140-R • posted 09/14/2015
Version postprint
Version postprint
Comparison of wilting and colonization rates across strains (STEP 3) - The effect of strain 284
and plant accession on wilting and colonization incidence, and Area Under the Disease 285
Progression Curve (AUDPC), was assessed using a generalized linear model considering 286
respectively binomial data (wilted vs. non-wilted) with Chi-square test (P=0.05), and an 287
analysis of variance with Fisher-Snedecor test (P=0.05). Incidence and AUDPC means were 288
compared within each plant accession, using a pairwise comparison test based on the Tukey’s 289
methods at level 0.05 (Hothorn et al. 2008). 290
Typologies of virulence phenotypes (STEP 3) - The combination of final wilting incidence 291
and colonization index scores allowed to calculate reference phenotypes using the “k-nearest 292
neighbor” algorithm (Venables and Ripley 2002) as previously described (Lebeau et al. 2011,
293
N'Guessan et al. 2012). Virulence phenotypes ranged from l (highly resistant) to 5 (highly 294
susceptible). The 0 class used in this study corresponded to “No wilt and no colonization”. 295
Each representative strain was thus assigned to a virulence phenotype on the different plant 296
accessions. The virulence phenotypes were considered as ordered factors ranked in ascending 297
order from 0 to 5. A phenotype clustering was constructed by using an agglomerative 298
hierarchical clustering as described above, considering each accession separately. 299
A principal component analysis based on gene presence/absence patterns and the phenotype 300
on the different resistant accessions (E1, E6, T5) was performed using the ade4 package 301
(Dray and Dufour 2007). 302
Phytopathology "First Look" paper • http://dx.doi.org/10.1094/PHYTO-06-15-0140-R • posted 09/14/2015
Version postprint
Version postprint
R
ESULTS303
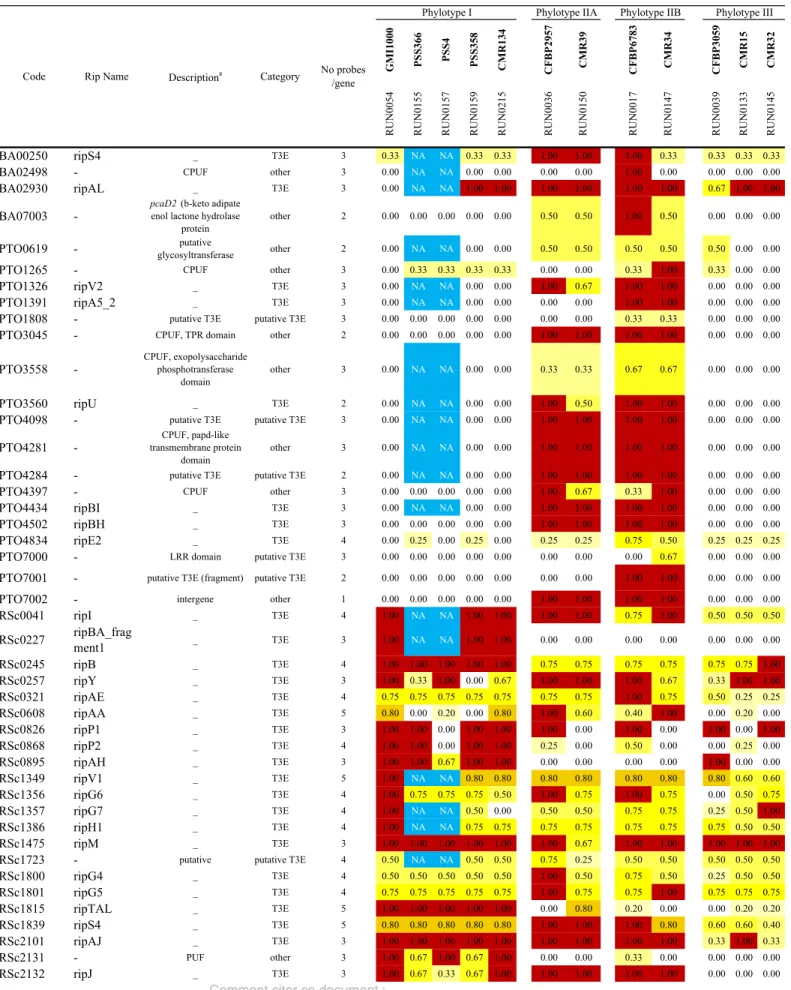
Type III Effector (T3E) distribution within the Core-RS2 as estimated by CGH 304
We first aimed to assess the distribution of 117 genes coding for proteins secreted by, or 305
constitutive of the structure of, the Type III secretion system, within the reference 12-strain 306
Core-RS2 collection. Among the 117 genes considered, 91 were T3E (78) or putative T3E 307
(13), as summarized on Table S1. Considering the 10 strains with complete validated 308
hybridization results (i.e. apart from PSS366 (RUN0155) and PSS04 (RUN0157)), the 309
distribution of the 91 T3E genes was compared (Table S1) across the CoreRS2 strains. It is 310
important to note that we considered the gene present in a strain if this strain was positive for 311
at least one probe of this gene. We also compared this CGH-based repertoire to the repertoire 312
of 26 genomes available on the “Ralsto-T3E” website (Table S3). Twenty T3E genes sensu 313
Peeters et al.(2013) were absent, or were not detected in our conditions, from this CoreRs2 314
collection:ripAF2, ripAG, ripAI (RSp0838), ripAZ2, ripBA_fragment2 (RSc0228), ripBB, 315
ripBC, ripBD, ripBF, ripBG, ripC2_Fragment 1 and 2 (RSp0593 and 0592, respectively),
316
ripF2, ripG8, ripH4, ripK, ripO2, ripP3_fragment 1 and 2 (RSc3444 and 3443, respectively),
317
ripS6, ripS7, ripS8 (RSc3447). Except ripAI which was found a core-effector (Ailloud et al.
318
2015, Clarke et al. 2015, Peeters et al. 2013) (Table S3), most of these “lacking effectors” 319
were either phylotype IV-specific (as detailed below), or found within phylotype IIB strains. 320
321
Type III effector repertoires ranged from 61 (CMR32) to 79 (GMI1000). Although there was 322
no clear relationship between phylotype and repertoire richness, phylotype III strains seemed 323
to contain fewer T3Es (61 to 67) than the other phylotypes : 74 to 78 in phylotype I, 73 to 77 324
in phylotype IIA, 74-75 in phylotype IIB (Table S2). Forty-one T3E genes and three putative 325
T3Es were common to all ten strains, among which four ripA (ripA2-5), four ripG (ripG2-5), 326
Phytopathology "First Look" paper • http://dx.doi.org/10.1094/PHYTO-06-15-0140-R • posted 09/14/2015
Version postprint
Version postprint
three ripH (ripH1-3), four ripS (ripS1-4). Conversely, ripA5_2 was the least shared T3E (20% 327
strains), as well as ripT and ripG1 (30% strains) (Table S2). To check for the effector 328
prevalence evenness within our collection, and detect eventual phylotype-specific effectors, 329
we compared the distribution of the 91 T3E genes within each phylogenetic group (phylotype 330
I: 3 strains; phylotype II: 4 strains; phylotype III: 3 strains). Effector distributions within 331
phylotypes were not significantly different from expected (Chi-square test, P-value= 0.999 to 332
1), indicating that phylotype had no detectable influence on effector distribution. Considering 333
the distribution of individual T3E across phylotypes, only ripA5_2 (PTO1391) and ripC1 had 334
a distribution different from expected (Chi-square test, P-value= 0.038 for both), the first one 335
appearing specific to phylotype II while the latter was found absent from phylotype III strains. 336
Considering the 12 strains (including PSS366 and PSS4), only 65 T3Es gave unambiguous 337
scorable results. From the comparison of T3E distribution across phylotypes (phylotype I 338
containing five strains this time), the conclusions were highly similar (no apparent phylotype-339
specific T3E composition), except that (i) ripG1 looked significantly overrepresented in 340
phylotype I, and (ii) ripBH was overrepresented in phylotype II (Chi-square test, P-341
value=0.044 and 0.020 respectively).
342
The effector prevalence evenness was also assessed on the 26 R.solanacearum genomes 343
harboured on the “RalstoT3E” website (Table S3). It is important to note that this dataset 344
included phylotype I genomes (four, including GMI1000), numerous phylotype II genomes 345
(four IIA including CFBP2957, and 14 IIB including CFBP6783), phylotype IV genomes (3), 346
but contained one single phylotype III genome (CMR15). Type III effector repertoires ranged 347
68 to 75 for phylotype I, 54 to 67 for phylotype IIA, 54 to 70 for phylotype IIB, 59 for 348
phylotype III, 46 to 62 for phylotype IV. Effector distributions within phylotypes were 349
significantly different from expected for phylotype IV and phylotype I (Chi-square test, P-350
value= 0.014 and 0.029 respectively). Considering the distribution of individual T3E across 351
Phytopathology "First Look" paper • http://dx.doi.org/10.1094/PHYTO-06-15-0140-R • posted 09/14/2015
Version postprint
Version postprint
phylotypes, 15 effectors had a distribution different from expected. Most of them were 352
significantly specific to phylotype IV (ripAF2, ripAG, ripAK, ripAZ2, ripBF, ripH4, ripO2; 353
Chi-square P-values ranging between 5.88x10⁻⁶ and 0.029), or to both phylotypes IV and I 354
(ripT, P=0.004), or specific to phylotype I (ripA1, ripAH, ripBA, ripS6, ripS8, ripTAL; P-355
values ranging from 3.25 x 10⁻⁴ to 0.025). RipG8 was specific to phylotype III (P=1.831 x10 -356
6
). We confirmed that ripG1 was significantly overrepresented within, phylotype I whereas 357
absence within phylotype II genomes (P=0.004); ripBH was found both in phylotype II and 358
phylotype IV genomes, and its distribution ws thus not different from expected (P=0.171). 359
360
Analysis of effector repertoires of the core-RS2 reveals the association of some T3Es to 361
specific virulence phenotypes 362
Comparing the presence of each probe within each couple of “avirulent” and “virulent” strain 363
panels (Table 3), we chose to rely on the ratio “present probes/total probes per gene” to infer a 364
degree of association to a particular phenotype. As an example, ripP1 was 100% associated 365
with avirulence to the eggplant “Surya” (Table 4) because all three ripP1 probes were present 366
in all avirulent strains whereas absent in all virulent strains. 367
Association with avirulence
368
Sixty genes were associated to avirulence, mainly to pepper P8 (35 genes), then eggplants E6 369
(28 genes), E2 (11 genes), E1 (10 genes), E3 (4 genes) and E4 (2 genes) (Table S4). One 370
single gene, ripAX2, was associated to avirulence to tomato T5 (Table 4, Table S4). 371
Interestingly, 20 genes were associated with avirulence to two accessions (mostly one 372
eggplant and pepper P8), and five genes were associated with avirulence to three cultivars: 373
ripA4 and ripN on E1-E6-P8; ripAS on E3-E6- P8; ripD on E2-E6-P8; ripG5 on E1-P6-P8
374
(Table S4). 375
Phytopathology "First Look" paper • http://dx.doi.org/10.1094/PHYTO-06-15-0140-R • posted 09/14/2015
Version postprint
Version postprint
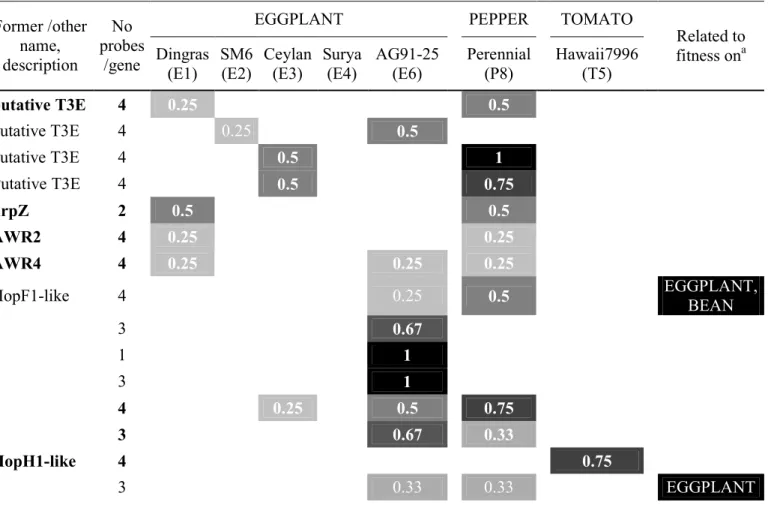
We focused on the 31 genes (one harpin, four putative T3Es, 26 T3Es among which ripAP 376
was in two fragments) whose (i) at least 50% probes (corresponding to 0.5 in Table 4 and 377
Table S4) were associated with avirulence to at least one accession, and/or (ii) were associated 378
with avirulence to E1 or E6 even with less than 50% probes (Table 4), and/or (iii) were related 379
to fitness on one or several hosts in a previous study (Macho et al. 2010). Highest association 380
scores (from 1 downto 0.67) were observed with avirulence to E6 (ripAP-ripE1, ripP2, ripAJ-381
ripAU-ripAZ1-ripP1), P8 (RSp0216, RSp0218-ripAS, ripG3), E4 (ripP1, ripAZ1), T5
382
(ripAX2). Some effectors were associated with avirulence to more than one accession. Indeed, 383
avirulence to both E1 and P8 was associated with four effectors (hrpZ, ripG4, ripS5, 384
RSc1723); avirulence to E3 and P8 with two (Rsp0216, RSp0218), like E4 and E6 (ripAZ1 385
and ripP1); avirulence to E6 and P8 was associated with ripG3 (Table 4). Three genes were 386
even associated to avirulence on three accessions: ripAS (E3-E6-P8), ripN (E1-E6-P8), ripG5 387
(E1-P6-P8) (Table S4). Effectors associated to avirulence to E1 were unexpectedly few, and 388
mildly associated (one probe/gene): hrpZ, ripG4, ripG5, ripN, ripS5, RSc1723. Only ripN 389
was associated with avirulence to both E1 and E6. 390
Association with virulence
391
Seventy-three genes (including 51 T3Es and 7 putative T3Es) were associated to virulence 392
(Table S5), mainly on pepper P8 (58 genes) and P2 (22 genes), then eggplants E2 (17 genes), 393
E3 (11 genes), tomato T5 (9 genes), eggplants E1 (7 genes), E4 (6 genes), E6 (5 genes), and 394
pepper P6 (4 genes). Focusing on the 37 genes whose at least 50% probes (score of 0.5 in 395
Table 5) were associated with virulence to at least one accession, highest association scores (1 396
downto 0.67) were observed on P8 (18 genes and one ripM fragment) and P2 (8 genes); 397
virulence on eggplants was associated with five (E2), three (E3), two (E1, E6) or the gene 398
RSp0213 (E4). Some genes were associated to virulence on several accessions: BA02498 on 399
Phytopathology "First Look" paper • http://dx.doi.org/10.1094/PHYTO-06-15-0140-R • posted 09/14/2015
Version postprint
Version postprint
E1-E3-P2-P6-P8; PTO7001 on E1-E3-E6-P2-P8-T5; PTO3558 on E1-E3-E6-P2-P8-T5; 400
ripA5_2 on E3-E6-P2-P8-T5; ripE2 on E1-E3-P2-P6-P8.
401
Association with both avirulence and virulence
402
Thirty-seven genes were both associated to avirulence and virulence, but in most cases high 403
association scores (over 50%) were with one unique phenotype, avirulence or virulence 404
(Tables S4 and S5). Some interesting cases were observed on high association scores, several 405
effectors being associated to avirulence to eggplant and virulence to pepper. Hence, ripP1 was 406
associated to avirulence to both eggplants E4 and E6, and to virulence to pepper P8; ripAZ1, 407
avirulent to E4 and virulent to P8. Conversely ripAF1 was associated to avirulence to P8 and 408
virulence to both E2 and E4; RSp0213 was associated to avirulence to P8 and to virulence to 409
E4 and P2. 410
From this first screening, the effectors associated with interaction (avirulence or virulence) to 411
eggplants E6 and E1 and tomato T5, were retained for further experiments. . Twenty five 412
T3Es and “effector-like” were thus selected (Table 6), among which 16 avirulence-associated 413
and nine virulence-associated genes. 414
415
The avirulence/virulence-associated effectors repertoire can be described in six 416
distribution patterns, some of which being phylotype-specific 417
The 25 T3Es associated with interaction to eggplants and tomato were selected based on CGH 418
results, targeting specific short regions of the gene. To assess their actual presence and size 419
within the two R. solanacearum strain collections (n=48), all these genes were PCR-amplified 420
using consensus primers. From this PCR screening, it appeared that T3Es were (i) 421
successfully amplified giving the expected gene size, (ii) not amplified despite two or three 422
Phytopathology "First Look" paper • http://dx.doi.org/10.1094/PHYTO-06-15-0140-R • posted 09/14/2015
Version postprint
Version postprint
independent replications, (iii) successfully amplified but giving a gene size different from the 423
expected one. These different “states” of each effector within each strain were used to build a 424
typology of the T3E repertoires. 425
Each strain was thus described by a pattern of 25 variables (gene) that may have up to six 426
different levels: 1= amplified at the expected size; 2=not amplified, 3 to 6= amplified at sizes 427
different from the expected one – the correspondences between alleles and amplicon sizes are 428
detailed in Table S7. The screening of the 25 T3Es in the two R. solanacearum strain 429
collections thus led to the identification of 6 main groups of strains sharing similar T3E 430
repertoire patterns, thus named “Type III effector Repertoire Groups” (TRG) (Table 7). The 431
catdes function (Husson et al. 2009) allowed identifying the variables’ levels best describing
432
each TRG (Table S8). These TRG seem to be phylotype specific, except for TRG3 and TRG6. 433
The TRG1 gathered strains of phylotype IIB, and was best characterized by BA02498 434
presence [allele 1], the absence of ripG3, ripS5 and ripP2 (P-values ranging from 2.31x10⁻⁴ to 435
9.54 x 10⁻³). TRG2 gathered phylotype IIA strains, and best characterized by BA07003-allele 436
3 , the presence of ripAS [allele 1] (P-values ranging from 2.66 x 10⁻³ to 2.63 x 10⁻²). TRG3 437
was dominated by phylotype IIB strains (n=25), and was best characterized by RipG3-allele 4, 438
the presence of PTO1265, ripV2, BA07003 [allele 1], the absence of RipN, ripAS (P-values 439
ranging from 9.86 x 10⁻¹³ to 3.31 x 10⁻⁸). TRG4 contained 80% of phylotype III strains and 440
was best characterized by RipG3-allele 3, ripW-allele 4, and ripAU-allele 1and the absence of 441
ripU, PTO3558, BA07003 (P-values ranging from 2.38 x 10⁻⁸ to 7.96x10⁻⁶). TRG5 only
442
contained phylotype I strains, and was best described by the presence of ripG3 [allele 1], 443
ripW-allele 3, ripG4, ripAZ1, ripS5 and the absence of BA07003 (P-values ranging from =
444
3.50 x 10⁻⁶ to 2.45 x 10⁻⁴) . TRG6, containing only RUN0930 (phylotype I) and RUN0657 445
(phylotype III), was characterized by ripG3-allele 5 and PTO1265-allele 3 (P= 0.042 for 446
both). 447
Phytopathology "First Look" paper • http://dx.doi.org/10.1094/PHYTO-06-15-0140-R • posted 09/14/2015
Version postprint
Version postprint
448
The TRG representatives display high variability in virulence and aggressiveness on 449
eggplants and tomato 450
To test the hypothesis that the T3E repertoire may explain the virulence phenotype, we 451
selected 11 strains representative of the six TRG to challenge the resistant tomato and 452
eggplant accessions. Considering both T3E content and phylogenetic position 453
(phylotype/clade/sequevar), we thus chose (i) RUN0017 (IIB /clade 4 /sequevar 4NPB) to 454
represent TRG1, (ii) RUN0058 (IIA /clade 2 /sequevar 39) for TRG2, (iii) RUN0059, 455
RUN0147, RUN0928 and RUN0941 (all in IIB /clade 5 /sequevar 1) for TRG3, (iv) 456
RUN0145 and RUN0523 (both in phylotype III /clade 6 /sequevar 29 and 19 respectively) for 457
TRG4, (v) RUN0054 (the reference GMI1000) and RUN0157 (both in phylotype I /clade 1 458
/sequevars 18 and 15 respectively) for TRG5; and (vi) RUN0657 (III /clade6 /sequevar 19) 459
for TRG6. 460
The strains were inoculated in two sets at different dates, with RUN0017 inoculated on both 461
dates as a control. Because the wilting incidence, colonization index and AUDPC were found 462
not significantly different across the two dates (P=0.143, 0.082, 0.615, respectively) we 463
pooled the two sets in one. After 28 days of incubation, the control susceptible accessions 464
were significantly more diseased than the resistant accessions (detailed results are shown on 465
the Figure S1). However some strains induced few symptoms on the susceptible controls. 466
RUN0523 (TRG4) induced less than 20% wilt and colonization on T10 and E8, and was thus 467
regarded a poorly aggressive strain on eggplant and tomato. RUN0058 (TRG2) induced a low 468
wilting incidence but more than 60% colonization to T10. All the other strains induced more 469
than 70% wilt and 80% colonization. On eggplant E8 the strains RUN0017 (TRG1), 470
RUN0059 and RUN0928 (TRG3), RUN0523 (TRG4), RUN0657 (TRG6) caused less than 471
Phytopathology "First Look" paper • http://dx.doi.org/10.1094/PHYTO-06-15-0140-R • posted 09/14/2015
Version postprint
Version postprint
20% wilt and colonization; highest aggressiveness (more than 80% wilt and colonization) was 472
observed for RUN0157 (TRG5), RUN0147 and RUN0941 (TRG3). The resistant eggplant E1 473
showed the highest resistance level since only RUN0147 induced more than 20% wilt on it. 474
The accession E6 was susceptible (30% wilt and 60% colonization or above) to the TRG3 475
strains RUN0147, RUN0928, RUN0941, and to the TGR5 strain RUN0157. The resistant 476
tomato T5 was most highly affected (80% wilt and colonization or above) by the TRG3 477
strains RUN0147, RUN0941, RUN0928, and by RUN0017 (TRG1). Incompatible 478
interactions (no wilt and no colonization) were observed on the couples (i) E1x RUN0523 and 479
E1 x RUN0058, (ii) E6 x RUN0054, E6 x RUN0523, E6 x RUN0145, E6 x RUN0059. 480
481
Thehe T3E repertoire is not globally descriptive of the virulence phenotype 482
The hierarchical ascending classification of the 11 strains representative of the 6 TRG built 483
based on their T3E repertoire did not clearly match with their virulence phenotypes on 484
eggplant and tomato (Figure 2). More precisely, strains RUN0058 (TRG2) and RUN0017 485
(TRG1), despite having very similar T3E repertoires, highly differed in virulence on the five 486
cultivars. Similarly RUN0147 and RUN0059 belong to the same TRG3 but the former is 487
highly virulent on E6 and T5 whereas the latter is avirulent on E6 and poorly aggressive on 488
T5. The strains RUN0157 and RUN0054, though gathered in the same TRG5, greatly differ in 489
virulence on the resistant accession E6 (Figure 2). From these results we concluded that the 490
entire T3E repertoire does not determine the phenotype of a strain. 491
492
Some T3Es are individually highly associated with avirulence or virulence 493
We performed a principal component analysis based on the presence or absence of genes, 494
regardless of their allelic state. Projecting the phenotypic classes (0 to 5) (Figure S1) and the 495
Phytopathology "First Look" paper • http://dx.doi.org/10.1094/PHYTO-06-15-0140-R • posted 09/14/2015
Version postprint
Version postprint
gene presence on the same factorial plan, we considered that genes projected in the same zone 496
as extreme phenotypes (avirulence, coded as 0; virulence; coded as 3 for E1, or 4 and 5 for E6 497
and T5) were associated to this phenotype. On the eggplant E1, the two axes opposed 498
avirulent strains (bottom- left) to virulent strains (top-right) (Figure 3A). RipA5_2 (PTO1391) 499
was associated to virulence, whereas ripAS (RSp1384), and more secondarily ripN 500
(RSp1130), were associated to avirulence. On the eggplant E6 (Figure 3B), avirulent strains 501
were in the top-left quarter of the plan, whereas virulent strains were in the top-right and 502
bottom-left quarters. PTO3558 and ripU (PTO3560), more secondarily ripA5_2 (PTO1391) 503
were associated to virulence, while ripP2 (RSc0868), ripAU (RSp1460), ripG3 (RSp0028), 504
and more secondarily ripAX2 (RSp0572) and ripP1 (RSc0826), were associated to avirulence. 505
On the tomato T5 (Figure 3C), the phenotypes were mainly separated along the first axis, 506
from quasi-avirulent strains on the left to virulent strains on the right. RipV2 (PTO1326), 507
BA07003, PTO3558 and ripU (PTO3560) were associated to virulence whereas RipP1 508
(RSc0826), RipN (RSp1130), ripAX2 (RSp0572), and more secondarily ripP2 (RSc0868), 509
ripG3 (RSp0028), RipAU (RSp1460) and ripG5 (RSc1801) were associated to avirulence.
510
Then, we followed a stringent approach, hypothesizing that the phenotype could be explained 511
by the presence or absence of key T3Es. For each resistant cultivar, we identified T3Es called 512
(i) virulence effectors that were present in virulent strains and absent in avirulent strains, and 513
(ii) avirulent effectors that were absent in virulent strains and present in avirulent strains. We 514
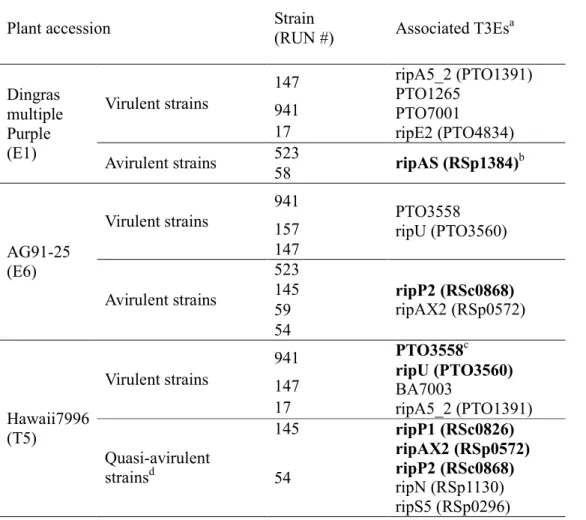
thus identified the following effectors as highly associated with strain phenotypes (Table 8): 515
ripA5_2 was associated to virulence on both eggplant E1 and tomato T5; ripE2, but also
516
PTO1265 and PTO7001 wereassociated to virulence on the eggplant E1; PTO3558 and ripU 517
associated to virulence to both E6 and T5; BA7003 was associated to virulence to tomato T5. 518
ripAS was associated to avirulence to E1, ripP2 and ripAX2 to avirulence on E6; ripP1, ripP2,
519
ripAX2, ripN, and ripS5 were associated to avirulence to T5.
520
Phytopathology "First Look" paper • http://dx.doi.org/10.1094/PHYTO-06-15-0140-R • posted 09/14/2015
Version postprint
Version postprint
D
ISCUSSION
521
Although bacterial wilt has been a major biotic stress in solanaceous crops throughout the 522
world, knowledge remains scarce about the plant genes allowing hosts to resist to R. 523
solanacearum attacks, and about the bacterial genes most contributing to adaptation to new
524
host or to a resistant accession. To prime the development of durable resistance sources, given 525
the huge genomic and phenotypic plasticity of the pathogen, it is now critical to favor 526
pathogen-informed resistance breeding. Such a strategy requires identifying the bacterial 527
genes involved in virulence to hosts and selected for that function, as well as those counter-528
selected based on detection in resistant hosts, for further exploring their diversity and 529
evolutionary dynamics in natural populations. Studies on R. solanacearum-plant interactions 530
have been focused for long on the model species Arabidopsis thaliana (Deslandes et al. 1998, 531
Deslandes et al. 2003, Digonnet et al. 2012) and Medicago truncatula (Ben et al. 2013, Turner 532
et al. 2009, Vailleau et al. 2007), but transposition of these findings to crops has been 533
problematic, some critical mechanistic differences having been identified between 534
pathogenesis to model species in one hand and to crops in the other hand (Lin et al. 2008, 535
Remigi et al. 2011). Deciphering plant-microbe interactions on crop species is thus essential. 536
Our three-step association genetics approach constituted a first published snapshot of the Type 537
III effector diversity existing in natural plant-associated R. solanacearum populations, and 538
allowed to identify avirulence and virulence candidate genes. Because population structure 539
can cause bias in the association to phenotype (Falush and Bowden 2006), we checked by 540
Chi-square test that there was no correlation between the phylotype and the effector presence. 541
A first snapshot of the T3E distribution in a large natural collection 542
This study gives a different view of the core-effectome within the Ralstonia solanacearum 543
Species Complex (RSSC (Genin and Denny 2012)). The coreRS2 core-effectome contains 40 544
Phytopathology "First Look" paper • http://dx.doi.org/10.1094/PHYTO-06-15-0140-R • posted 09/14/2015
Version postprint
Version postprint
T3Es, which does not completely match the Core-effectome identified by Peeters et al. 545
(2013). Hence, the Peeters’s core-effectors ripAO, ripE1, ripG7 were present in 90% coreRS2 546
strains; the core ripAC was present in 80% coreRS2 strains, and the core ripAA was even 547
more variable, being absent from the phylotype III strains (except CMR15) and from two 548
phylotype I strains, PSS366 and PSS358 (Table S2). The core ripC1 and ripU were found 549
also variable in our study, but we observed a discrepancy between our results and Peeters’ 550
results on CMR15 (Table S3). This absence on our dataset may be explained by technical 551
artifacts. Recent genomics studies focusing on phylotype II genomes identified core-552
effectomes of different composition, including either 14 T3Es (Ailloud et al. 2015), or 31 T3E 553
(Clarke et al. 2015); our own analysis on publicly available genomes identified 11 core-554
effectors on a quite phylogenetically unbalanced dataset (Table S3). Additional genomic 555
sequences, especially within phylotype III, are needed to approach the actual composition of 556
the RSSC core-effectome. 557
The T3E repertoires from the Reunion collection should be regarded partial since 25 T3Es 558
only were considered, but they yet give interesting insights on the prevalence and diversity of 559
these effectors. Effector distribution could indeed be described in six patterns (TRG) based on 560
effector presence but also alleles. The most polymorphic effector was ripG3, which alleles 561
were major descriptors of the different TRGs: allele 1 for TRG5, allele 3 for TRG4, allele 4 562
for TRG3, allele 5 for TRG6 (table 7). Such diversity may be a signature of the diversifying 563
selection evoked for this gene in the reference paper describing the GALA family evolution 564
(Remigi et al. 2011). 565
Some effectors were present throughout the collection, like ripA2, ripA4, ripW (Pattern 5 in 566
Table 7). ripA2 and ripA4 were monomorphic, but it is important to note that these were 567
partial sequences (3065 bp over the 3381 bp of ripA2GMI1000, and the 960 bp region of the
568
3990 bp-ripA4GMI1000). Whereas ripA2 (formerly AWR2) was primarily characterized as
569
Phytopathology "First Look" paper • http://dx.doi.org/10.1094/PHYTO-06-15-0140-R • posted 09/14/2015
Version postprint
Version postprint
contributing to virulence (Sole et al. 2012), it could be successfully amplified in the T5-570
avirulent strains. This difference could be due to sequence polymorphism, or functional 571
redundancy; it also may indicate that ripA2 plays a dual role within tomato, supporting the 572
Invasion Model (Cook et al. 2015). Whereas, ripW (formerly called popW) gave three 573
different alleles: one being widespread in the collection (1202 bp with IIB primers and 1119 574
pb with GMI1000 primers), another (allele 4: 1202 bp with IIB primers only) being specific to 575
TRG 4, composed of phylotype III strains, and a third one (allele 3: 1119 pb with GMI1000-576
primers only) specifically found in the TRG5 (phylotype I strains) (Tables S7 and S8). We did 577
not find correlation between these alleles and an avirulence phenotype. ripW was previously 578
characterized as a two-domain protein (Li et al. 2010), whose harpin activity (detected on 579
tobacco) resides in its N-terminal domain (first 159 residues), and which doesn’t significantly 580
contribute to virulence on tomato. The analysis of a 20-strain collection, covering six 581
countries but whose phylotypes were not determined, allowed the identification of six alleles 582
ranging from 1131 to 1155 bp. The range of variation that we observed was thus higher, and it 583
may be interesting to determine the critical residues involved in the harpin activity on tobacco 584
and solanaceous. 585
An approach with rich outputs, but with some limitations 586
Although most of the associations detected in STEP 3 were consistent with those found in 587
STEP 1, some distortions should be evoked and discussed. Indeed, ripAP, ripE1,and ripAJ, 588
though associated with avirulence to E6 from STEP1 (Table 5), were not retained in the 589
downstream analyses. RipAP is present in two fragments in the GMI1000 genome, and 590
experiments established that it is not secreted by the T3SS (A.C Cazalé and N. Peeters, 591
personal communication 2014). Moreover, the associations found in STEP 1 were not always 592
confirmed in STEP 3 (Table 9). Main discrepancies concerned avirulence to Hawaii 7996 593
(T5): several associations found on full-length gene analysis (for ripAU, ripG3, ripN, ripP1 594
Phytopathology "First Look" paper • http://dx.doi.org/10.1094/PHYTO-06-15-0140-R • posted 09/14/2015
Version postprint
Version postprint
and ripP2, ripG5, and ripS5) were not primarily detected from probe data analysis. Avirulence 595
to eggplant detected in STEP 1 was mostly confirmed on STEP 3, with some exceptions. The 596
E6- avirulence of RipAX2 was found only in STEP3, whereas this of ripN was not confirmed 597
in STEP 3; ripAS, primarily associated to avirulence on E3 and E6, was found avirulent to E1 598
only from STEP 3. Regarding virulence effectors, the virulence of ripE2 on E1, ripA5_2 on 599
E6, and ripV2 on T5, were confirmed, whereas ripU, virulent to T5 from the STEP1, was 600
found virulent to T5 but also E6 in the STEP3. It is thus strongly recommended to combine 601
both approaches, and to favor full-length gene analysis for the choice of candidate genes. 602
Avirulence and virulence phenotypes are not explained by repertoires, but rather by 603
individual effectors which constitute promising candidates interacting with eggplant and 604
tomato 605
Strains of identical phylotype and TRG displayed very different virulence phenotypes (see 606
RUN0054 and RUN0157 as an example), whereas other strains displaying identical 607
phenotypes were in different TRG (see RUN0157 (TRG5) and RUN0941 (TRG3)). The 608
“repertoire-for-repertoire” hypothesis, stated to explain the Xanthomonas host specificity 609
(Hajri et al. 2009), does not match the Ralstonia solanacearum situation. 610
Collectively, the final principal component analysis and the stringent analysis have allowed to 611
define a short list of avirulence- and virulence-associated effectors to be further investigated. 612
Among avirulence effectors, ripP2 is one of the best candidates, associated to both eggplant 613
E6 and tomato T5. Then follow ripAU and ripG3, as well as ripP1 and ripAX2 (also for 614
avirulence to E6 and T5). Then we identify ripN (avirulence to E1 and T5), ripAS (avirulence 615
to E1 only). Since ripG5 is only associated to avirulence to T5, and because it is expressed in 616
operon with ripG4, we chose not to keep it in our short list. 617
Among virulence effectors, most promising candidates are PTO3558 and ripU (virulence to 618
both E6 and T5), then ripA5_2 (virulence to both E6, E1, and T5), then ripV2 and BA07003 619
Phytopathology "First Look" paper • http://dx.doi.org/10.1094/PHYTO-06-15-0140-R • posted 09/14/2015
Version postprint
Version postprint
(virulence to T5). It will be critical first to check the expression and secretion of PTO3558 620
and BA07003 by the T3SS. This short list of effectors is now nominated for further 621
experiments that may validate their avirulence or virulence function. 622
ripP2 (former popP2) has been the first described R solanacearum avirulence gene to
623
Arabidopsis thaliana Nd1 (Deslandes et al. 2003), whose functions have been most
624
thoroughly investigated (see the review of Deslandes and Genin (2014), as well as (Le Roux 625
et al. 2015, Sarris et al. 2015)). Amplifying the 8-989 bp region (over 1464 bp in total), we 626
identified two alleles: 982 bp (allele 1) being found within almost all phylotype III strains and 627
two phylotype I strains (RUN0054 and RUN0215), and 950bp (allele 3) found in most 628
phylotype IIA and IIB strains, three phylotype III strains (RUN0039, RUN0145, RUN0133) 629
and two phylotype I strains (RUN0155, RUN0471). To our knowledge, this is the first 630
published paper describing ripP2 diversity. Whether these ripP2 alleles keep their enzymatic 631
functions and their ability to be detected within plant (their “invasion pattern” sensu (Cook et 632
al. 2015)) remains to be tested (Tasset et al. 2010). It is now tempting to speculate that the 633
interaction Eggplant AG91-25 / ripP2 may follow the Arabidopsis RRS1-R/ripP2 model 634
(Bernoux et al. 2008, Deslandes et al. 1998, Deslandes et al. 2002 , Deslandes et al. 2003, Le 635
Roux et al. 2015, Sarris et al. 2015). According to this model, the AG91-25 major resistance 636
gene ERs1 (Lebeau et al. 2013) could be homologous of RRS1-R, or coupled to a RPS4 637
homologue. However, preliminary BLAST search of RRS1-R on the eggplant sequence 638
genome (Hirakawa et al. 2014) returned no hit (S. Salgon and C. Sauvage, personal 639
communication 2015). Recently, ripP2 was demonstrate to specifically interact with a new 640
eggplant resistance protein, RE-BW (Xiao et al. 2014); it remains to be determined whether 641
this gene co-localizes with ERs1. 642
ripAX2, also called rip36 (Peeters et al. 2013, Poueymiro and Genin 2009), codes for the other
643
demonstrated avirulence effector, eliciting HR on Solanum torvum (Nahar et al. 2014), a wild 644
Phytopathology "First Look" paper • http://dx.doi.org/10.1094/PHYTO-06-15-0140-R • posted 09/14/2015
Version postprint
Version postprint
relative of eggplant. This paper gives first insights on the diversity on this poorly known 645
effector, whose prevalence looks highest in phyloypes III and I strains. 646
ripP1 (former popP1), whose protein was demonstrated as an avirulence factor on Petunia
647
(Lavie et al. 2002) and HR-elicitor on Nicotiana glutinosa (Poueymiro et al. 2009), was only 648
detected in phylotypes I and III, giving a single allele of 1088 bp (over the 1104 bp total 649
gene), and its presence was quite variable, even within phylotype I strains (absent in two over 650
six strains). This variability was also reported in a Japanese phylotype I 22 strain-collection, 651
but popP1 presence was not correlated with HR on tobacco (Liu et al. 2009). Its homolog in 652
Xanthomonas perforans, XopJ4, was also reported as avirulence protein recognized by the
653
Solanum penelli RXopJ4 gene (Sharlach et al. 2013).
654
ripA5_2 (former AWR5-2), in the other hand, was not reported as a virulence effector in the 655
literature. AWR5 was indeed recognized by Arabidopsis and induced an HR on Nicotiana 656
tabacum (Sole et al. 2012). It remains to assess the actual expression and the respective roles
657
of the two ripA5 paralogs in plant-pathogen interactions. 658
Potential candidate effectors in interaction with other species 659
Because the resistance levels observed were highest on eggplant, we focused our quest on this 660
species. But scientists should also use these results to further investigate the pepper-R. 661
solanacearum molecular interactions. One should focus on the role, distribution, diversity and
662
evolution of the 2 harpins hrpZ and ripW and the 10 effectors associated to avirulence to both 663
eggplant and the pepper Perennial (P8). Among these are two members of the ripA family 664
(former AWR family) ripA2 and ripA4 (Sole et al. 2012), three members for the ripG family 665
(former GALA family), ripG3, ripG4, ripG5, whose functions remain unknown on pepper. 666
Furthermore, some cases of eggplant-pepper differential phenotypes may deserve further 667
investigation. ripP1 and ripAZ1 were associated to avirulence to eggplant “Surya”(E4) and 668
virulence to pepper “Perennial”(P8). Interestingly, this host –specific differential function has 669
Phytopathology "First Look" paper • http://dx.doi.org/10.1094/PHYTO-06-15-0140-R • posted 09/14/2015