HAL Id: hal-00296182
https://hal.archives-ouvertes.fr/hal-00296182
Submitted on 27 Mar 2007
HAL is a multi-disciplinary open access
archive for the deposit and dissemination of
sci-entific research documents, whether they are
pub-lished or not. The documents may come from
teaching and research institutions in France or
abroad, or from public or private research centers.
L’archive ouverte pluridisciplinaire HAL, est
destinée au dépôt et à la diffusion de documents
scientifiques de niveau recherche, publiés ou non,
émanant des établissements d’enseignement et de
recherche français ou étrangers, des laboratoires
publics ou privés.
specific absorption during the Mexico City Metropolitan
Area (MCMA) 2003 field campaign
J. C. Barnard, E. I. Kassianov, T. P. Ackerman, K. Johnson, B. Zuberi, L. T.
Molina, M. J. Molina
To cite this version:
J. C. Barnard, E. I. Kassianov, T. P. Ackerman, K. Johnson, B. Zuberi, et al.. Estimation of a
”radia-tively correct” black carbon specific absorption during the Mexico City Metropolitan Area (MCMA)
2003 field campaign. Atmospheric Chemistry and Physics, European Geosciences Union, 2007, 7 (6),
pp.1645-1655. �hal-00296182�
© Author(s) 2007. This work is licensed under a Creative Commons License.
Chemistry
and Physics
Estimation of a “radiatively correct” black carbon specific
absorption during the Mexico City Metropolitan Area (MCMA)
2003 field campaign
J. C. Barnard1, E. I. Kassianov1, T. P. Ackerman1,*, K. Johnson2,**, B. Zuberi2,***, L. T. Molina2, and M. J. Molina2,** 1Pacific Northwest National Laboratory, Richland, WA, USA
2Massachusetts Institute of Technology, Cambridge, MA, USA *now at: University of Washington, Seattle, WA, USA
**now at: University of California, San Diego, CA, USA ***now at: GEO
2Technologies, Woburn, MA, USA
Received: 1 April 2005 – Published in Atmos. Chem. Phys. Discuss.: 23 June 2005 Revised: 9 February 2007 – Accepted: 19 March 2007 – Published: 27 March 2007
Abstract. During the Mexico City Metropolitan Area (MCMA) field campaign of 2003, measurements of the shortwave radiation field allowed the inference of the black carbon (BC) specific absorption, αλ, defined as the monochromatic absorption cross section per unit mass (with units of m2/g). The averaged values of αλ derived from the method here are either 8.9 m2/g or 8.2 m2/g at 500 nm, de-pending upon the physical and optical parameters assumed for BC. These results are reasonably consistent with those of Schuster et al. (2005), 9.5 m2/g, and Baumgartner et al. (2002), 7.0 m2/g, both measured at 550 nm. The αλ val-ues reported in this paper should only be considered effec-tive, “radiatively correct” values because when used in ra-diative transfer calculations the calculated irradiances match the measured irradiances at 500 nm. The specific absorption so defined can assume a wide range of values, depending upon: (1) the assumptions made prior to the retrieval (e.g., shell/core aerosol configuration), and (2) values chosen for BC density and refractive index. The range of possible val-ues is large, corresponding to a “worst case” uncertainty of about±70%, assuming that all errors are additive and of the same sign so that no error cancellation occurs.
1 Introduction
Black carbon is found throughout the atmosphere, is mostly of anthropogenic origin, and is thought to be the most
im-Correspondence to: J. C. Barnard
portant contributor to aerosol absorption of solar radiation. A key measure of the absorption efficiency of BC is the spe-cific absorption, αλ, defined as the monochromatic absorp-tion cross secabsorp-tion per unit mass, typically given in units of m2/g. The specific absorption is a function of wavelength, as indicated by the subscript λ. Over the years, the litera-ture has reported a large range for values of αλ, from as low as 2 m2/g to as high as 25 m2/g (e.g., Waggoner et al., 1981; Horvath, 1993; Liousse et al., 1993; Petzold et al., 1997; Penner et al., 1998; Moosm¨uller, 1998; Marley et al., 2001; Arnott et al., 2003; Schuster et al., 2005). As suggested by Liousse et al. (1993) this wide variation may be caused by differences in the aerosol mixing state, with the smaller val-ues favoring external mixtures, while larger valval-ues indicate internal mixing of BC. Estimates of aerosol radiative forcing attributable to BC are influenced dramatically by the mixing state of BC, and because of the relationship between mixing state and αλ, these estimates depend on the value of αλ as well (e.g., Ackerman and Toon, 1981; Chylek et al., 1995; Fuller et al., 1999; Jacobson, 2000; Jacobson, 2001; Chung and Seinfeld, 2002; Lesins et al., 2002; Riemer et al., 2003; Sato et al., 2003).
Because of the importance of αλin determining the magni-tude of aerosol radiative forcing, atmospheric measurements of this quantity are critical. In this paper, we present esti-mates of αλbased on the observed shortwave radiation field, made within the Mexico City basin during the MCMA field campaign undertaken in April and May of 2003. This basin is an ideal place to study BC aerosols because of the high BC emissions; the high altitude, which enhances the aerosol scattering signal over that of molecular scattering; significant
variations in relative humidity, from very dry to saturated conditions; and the unique meteorology of the Mexico City basin, which under the right meteorological conditions, may flush pollutants out of the basin on a daily basis (Fast and Zhong, 1998; Gaffney et al., 1999; Whiteman et al., 2000; Molina et al., 2002).
2 Methodology
2.1 Measurements
The primary instrument used for this analysis is the Multi-Filter Rotating Shadowband Radiometer (MFRSR, Harrison et al., 1994). This instrument, as well as most of the other in-struments involved in the MCMA campaign, was deployed at the National Center for Environmental Research and Train-ing (Centro Nacional de Investigaci´on y Capacitati´on Am-beintal, abbreviated as CENICA), on the Iztapalapa campus of the Unversidad Aut´onoma Metropolitana (UAM). This site is located at a latitude and longitude of 19.36 N and 99.07 W, respectively, and is atop a building and removed from direct exposure to automobile exhaust. As noted by Johnson et al. (2005), this site is in a mixed commercial-residential area with relatively few industries or congested roads. It is about 9 km southeast from La Merced, a market area often filled with dense traffic, and 2 km south of a large food market frequented by delivery trucks in the morning hours. Given the apparent lack of major aerosol sources in the near vicinity of the site, we assume that the BC aerosols observed here will have had some chance to age compared to those freshly emitted in traffic.
The MFRSR is, as the name implies, a shadowband ra-diometer that measures two components (diffuse and total) of the shortwave radiation field at the six wavelengths: 415, 500, 615, 673, 870, and 940 nm. The third component of the field – the direct component – is found from the total and dif-fuse components by subtraction combined with a correction for the cosine response of the instrument. Because all three radiation components are measured with the same sensor, if one component can be calibrated accurately, the other two components will share similar calibration accuracies. Typi-cally, the direct component of the irradiance is calibrated in the field using the Langley method with a calibration accu-racy that approaches 1% (Michalsky et al., 2001).
Aerosol optical thicknesses, τλ, are derived from the direct component, provided that the path between the sun and the instrument is not obscured by clouds. Whether this criterion is met is easily determined using the ˚Angstr¨om exponent, ˚a (Seinfeld and Pandis, 1998; Schuster et al., 2006). The sin-gle scattering albedo, ̟0,λ, is the probability (0≤̟0,λ≤1)
that an aerosol scatters, rather than absorbs, a photon that impinges on it. Formally it is the ratio of the aerosol scat-tering coefficient, bscat (m−1), to the aerosol extinction
co-efficient, which is the sum of the bscatand absorption
coef-ficient, babs (m−1), or ̟0,λ=bscat/(bscat+babs). The single
scattering albedo can be retrieved from the diffuse and total irradiances using the algorithm of Petters et al. (2003), Kas-sianov et al. (2005), or Goering et al. (2005). These algo-rithms work best for large optical thicknesses (e.g., τλ>0.25 at 500 nm), a condition that is frequently met in the Mexico City basin. For the work reported here, we tested both the Petters and Kassianov algorithms and obtained nearly simi-lar results for retrieved single scattering albedos, suggesting that the results presented below are independent of the algo-rithm chosen. These algoalgo-rithms can only be used if the sky is completely free of clouds, a criterion that was verified us-ing the method of Long and Ackerman (2000). Durus-ing the entire MCMA campaign, there were only seven periods that satisfied the cloud-free criterion. The dates and time of these periods are listed in the first column of Table 1.
The average value of ̟0,λ over these seven cases is
0.90. For the same days, the average ̟0,λderived from the
AERONET (Aerosol Robotic Network; Holben et al., 1998) sun photometer located in Mexico City is 0.89 at 500 nm, as determined by linear interpolation between inferred single scattering albedos at 441 nm and 673 nm. It is also possi-ble to derive ̟0,λ from surface measurements.
Baumgart-ner et al. (2000) measured bscatand babsusing a
nephelome-ter and particle soot absorption photomenephelome-ter (PSAP), respec-tively. Before these measurements were made, the aerosols were heated to ensure that the relative humidity was less than 40%. Atmospheric soundings that bracket the time period over which inferences of ̟0,λwere made indicate that the
boundary layer was quite dry, with relative humidities below the aerosol mixing height generally less than 30%. For such low humidities, the aerosol is likely to be dry. This dry con-dition permits the use of Baumgartner et al.’s surface mea-surements without concern for humidity effects. Using these measurements, given in Fig. 2 of Baumgartner et al. (2000), and including only values for relative humidities less than 30%, ̟0,λ is found to be 0.88 at 550 nm. The agreement
between these three different ways of finding ̟0,λsuggests
that our ̟0,λare credible.
2.2 Determination of αλ
The method used here to estimate αλis based on a technique first discussed by Schuster et al. (2005), with an important difference mentioned below. The method relies on the simple equation: αλ = (1− ̟0,λ)τλ MBC = τλ,abs MBC (1) where τλ,absis the aerosol absorption optical depth. The ma-jor assumption underlying this equation is that BC is the only atmospheric absorber at the wavelength λ, which is generally valid outside the UV and near-UV spectral ranges (Heintzen-berg et al., 1997). The aerosol optical thickness is inferred from the MFRSR direct normal irradiances, and ̟0,λ is
Table 1. The seven case studies selected for retrievals of αλ(for λ=500 nm) and the results from BC physical and optical parameter sets I and II.
Date,
time period (hours, LST) τλ ˚a ̟0,λ CV=Cf+Cc (µm3/µm2) fV I II MBC (mg/m2) I/II αλ (m2/g) I/II Re[m˜s] I/II 14 April 2003 (08:26–10:19) 0.313 1.73 0.901 0.1443 0.01136 0.01369 3.3/4.0 9.5/8.7 1.33/1.33 15 April 2003 (07:33–10:26) 0.331 1.50 0.889 0.1350 0.01600 0.01936 4.3/5.2 8.5/7.8 1.40/1.40 16 April 2003 (08:02–10:27) 0.375 1.57 0.859 0.1569 0.01938 0.02347 6.1/7.4 8.7/8.0 1.39/1.39 18 April 2003 (08:19–10:32) 0.267 1.48 0.965 0.1461 0.00375 0.00448 1.1/1.3 8.5/7.9 1.32/1.32 26 April 2003 (07:36–10:40) 0.390 1.69 0.901 0.1300 0.01621 0.01971 4.2/5.1 9.2/8.4 1.46/1.46 27 April 2003 (07:49–11:59) 0.310 1.69 0.924 0.1354 0.00984 0.01191 2.7/3.2 8.8/8.1 1.39/1.39 30 April 2003 (07:54–11:00) 0.335 1.58 0.886 0.1208 0.01724 0.02093 4.2/5.1 9.2/8.4 1.44/1.44 average 0.332 0.904 3.7/4.5 8.9/8.2 1.39/1.39
found from the diffuse and total MFRSR irradiances and the single scattering albedo algorithms mentioned above. It then remains to find MBC.
To find this quantity, we must make the following assump-tions: (1) the aerosol is spherical and internally mixed in a shell/core manner (Jacobson, 2000; Bond et al., 2006), with the core of the aerosol consisting of BC. This shell/core configuration differentiates our method from that of Schus-ter et al. (2005), which handled inSchus-ternal mixing using the Maxwell-Garnett approximation; (2) the physical and opti-cal properties (density, ρBC; refractive index, m˜BC) of the
BC are known; (3) the shell is non-absorbing; (4) the colum-nar aerosol volume distribution of the aerosol is known; and (5) the mass fractions of the various aerosol chemical con-stituents do not vary with the aerosol size. The first assump-tion of an internal mixture is difficult to verify although elec-tron micrographs of the aerosol, as well as a single-particle chemical analysis of the aerosols, indicate that the soot is in-ternally mixed with other substances (Johnson et al., 2005). Given the complexity of aerosol shapes and mixing config-urations depicted in Johnson et al., the spherical shell/core model of internal mixing is a simplification but is necessary for conventional Mie theory calculations of the aerosol’s op-tical properties. In regard to the second assumption, the re-ported values for the physical properties and optical of BC vary widely, as reported by Bond and Bergstrom (2006) and Fuller et al. (1999). Lacking in situ measurements we as-sume plausible values for these properties, discussed below. Assumption three, that the shell does not absorb, is tanta-mount to assuming that BC is the only absorber at 500 nm. As mentioned above, this is consistent with the assertion of Heintzenberg et al. (1997).
The columnar aerosol volume distribution, required by the fourth assumption, is obtained from the AERONET database for the specific days in question. The volume distribution found by the AERONET algorithm is expressed as dV/dlnr with units (µm3/µm2), such that the integration over all
aerosol radii (or more properly, the logarithm of the aerosol radius) yields the total volume concentration of the aerosol per unit area of the atmospheric column, CV (with units
µm3/µm2). The inversion method leading to the aerosol
vol-ume distribution, as well as the assumptions inherent to the inversion (e.g., spherical particles, various smoothing con-straints), have been discussed in Dubovik and King (2000). Formally, the volume distribution is the sum of two lognor-mal distributions that represent the fine (f ) and coarse modes (c) of the total distribution (Dubovik et al., 2002),
dV (r) d ln r = CV ,f √ 2π σf exp " −(ln r− ln rV ,f) 2 2σf2 # +√CV ,c 2π σc exp " −(ln r− ln rV ,c) 2 2σ2 c # (2) In this equation, r is the particle radius, and rV and σ are the volume median particle radius and the standard de-viation, respectively, for either the fine or coarse mode. (The conventional geometric standard deviation, σg, is lated to the standard deviation listed above by the re-lationship, σ =lnσg.) Typical values of these quantities for the MCMA field experiment are for the fine mode:
CV ,f=0.075 µm3/µm2, rV ,f=0.13 µm, σf=0.43; and for the coarse mode: CV ,c=0.063 µm3/µm2, rV ,c=3.6 µm, σc=0.62. The fifth assumption – constant aerosol composition re-gardless of aerosol size – is at least partially satisfied. Black
carbon emitted from traffic sources is submicron in size. That these small soot particles make their way to larger particles is clearly seen in the scanning electron micrographs shown in Fig. 5 of Johnson et al. (2005), which show internally mixed soot contained in particles that are larger than 1 µm in size.
Finding MBCbegins with the equations
(1− ̟0,λ)τλ= ∞ Z 0 dn(r) dr σabs(m˜s,m˜BC, r, fV)dr (3) and τλ= ∞ Z 0 dn(r) dr σext(m˜s,m˜BC, r, fV)dr (4)
where dn(r)/dr is columnar number distribu-tion obtained from the volume distribution (e.g.,
dV/dlnr=r(4/3π r3)dn(r)/dr); σabs(m˜s,m˜c, r, fV) and
σext(m˜s,m˜c, r, fV) are the absorption and extinction cross
sections as a function of the (complex) refractive indices of the shell,m˜s, and the BC core,m˜BC; r is the total radius of
the particle, and fV (0≤fV≤1) is the volume fraction of the aerosol that consists of BC. Invoking assumptions two and three mentioned above, we assume values form˜BC and the
complex part ofm˜s, denoted as Im[m˜s] (these values will be discussed below); dn(r)/dr is known from the AERONET retrievals, and from the MFRSR measurements we can infer
τλ and ̟0,λ. With these known factors, Eqs. (3) and (4)
become integral equations for fV and the real part of m˜s, Re[m˜s]. Once fV is known, MBC follows immediately,
MBC=CVfVρBC, where again, we use assumption (2) and
choose a plausible value for ρBC, discussed below.
Solving Eqs. (3) and (4) for fV and the real part of m˜s is a straightforward, iterative process. First, we take Im[m˜s]
as−10−7i. The small imaginary part of the shell refractive
index implies negligible absorption and is representative of a sulfate-like compound (Toon et al., 1976), and/or organic compounds that do not absorb at 500 nm. Next, the shell/core Mie code of Ackerman and Toon (1981) is used to compute
σabs(m˜s,m˜c, r, fV) and σext(m˜s,m˜c, r, fV) for ranges of r
that encompass the limits of dn(r)/dr and plausible values of
fV. Equation (3) and (4) are integrated numerically, com-pared with (1−̟0,λ)τλ and τλ, respectively, and this pro-cess is repeated until the left- and right-hand sides of the equations are equal. This iteration is robust and converges rapidly.
When solving Eqs. (3) and (4), assumptions regarding spe-cific values ofm˜BCand ρBCmust be made. Measurements of
the density of diesel soot (Park et al., 2004; Wu et al., 1997), and the discussion provided in Fuller et al. (1999) and Schus-ter et al. (2005) suggest a plausible range of ρBC from 1.7 to 2.1 g/cm3. Bond and Bergstrom (2006) suggest a more lim-ited range of 1.7 to 1.9 g/cm3. Although measured density values less than 1.7 g/cm3have been reported, an important
consideration favoring the higher density values is the need to correlate carbon mass emissions with climate impact. As noted by Fuller et al. and references therein, for this cor-relation to be meaningful, the density of the tiny spherules that compose soot clusters is important, and not some aver-age density of a soot cluster, which contains voids. Within the 1.7 g/m3to 2.1 g/m3range, however, we cannot pretend to know the density exactly and consequently, we chose the value, 2.0 g/m3, so the results may be compared with Schus-ter et al. (2005). For this same reason we takem˜BC=2.0–1.0i
(Soot G, Fuller et al., 1999).
It is instructive, however, to repeat the specific absorption calculations using the refractive indices and densities as re-ported by Bond and Bergstrom (2006). In this paper, an ex-haustive review and analysis of the literature was undertaken to determine suggested ranges of these quantities. Consider-ing these ranges to be the most credible and updated values for use in radiative transfer calculations, we again find αλby taking ρBCto be 1.8 g/m3andm˜BCas 1.95–0.79i. The
den-sity is the midpoint of the suggested range of 1.7 to 1.9 g/m3, whilem˜BCis the highest of the suggested values and implies
a minimal void volume in the carbon. To distinguish between these two sets of calculations, we label them as I – for com-parison with the results of Schuster et al. (2005); and II – using Bond and Bergstrom “best estimate” values. For the sake of explicitness, the refractive indices and densities of these two sets of calculations are shown in Table 2.
2.3 Specific absorption values
The technique described above was applied to 7 cases during which the sky was free from clouds. Table 1 shows the results for both sets I and II, as well as values of τλ , ˚a, and ̟0,λ
averaged over the indicated clear sky periods. All results are for a wavelength of 500 nm. It is again important to reiterate that the derived values of αλare only appropriate for the time periods when the skies are clear because this requirement is necessary to derive ̟0,λ. These time periods occur in the
morning hours, before a convective boundary layer develops that encourages the development of convective cloudiness.
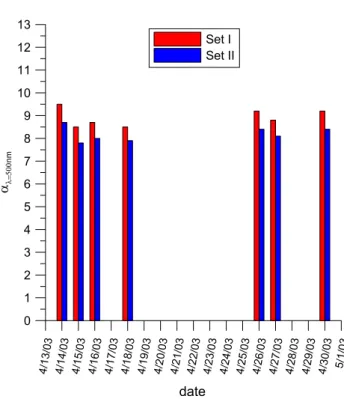
For the seven cases considered here and for the BC pa-rameter sets I and II, the eighth column in Table 1 shows αλ, while the last column shows Re[m˜s]. The specific absorp-tions are depicted by the bar chart in Fig. 1, which shows that the results of set I are larger than set II, but nonetheless fairly close. When averaged over the 7 cases, the averaged values, shown in the bottom row of Table 1, are 8.9 m2/g and 8.2 m2/g, for sets I and II respectively, a difference of about 9%.
When averaged over all days, Re[m˜s] is equal to 1.39 for both sets. That Re[m˜s] is virtually the same for both sets is related to the fact that the extinction (τλ) depends mostly on the real part of the (effective shell/core) refractive index (King et al., 1978). Furthermore, our value is quite close to the real part of the refractive index obtained from the
Table 2. BC properties used in the two sets of calculations considered here.
Set I – for comparison with the results of Schuster et al. (2005)
Set II – using “best es-timate” values from Bond and Bergstrom (2006) Refractive index of BC,m˜BC 2.0–1.0i 1.95–0.79i
Density of BC, ρBC 2.0 g/m3 1.8 g/m3
AERONET retrievals, 1.40, when averaged over the same days. An effective shell refractive index of this magnitude suggests the presence of water in the shell, but the bound-ary layer was very dry and the aerosols were likely to be dry. However, a Re[m˜s] of this magnitude may be congruent with the large organic carbon (OC) content of the MCMA aerosol. As noted in Salcedo et al. (2006), the average mass composition of OC in the aerosol was about 55%. We do not know exactly which compounds compose the OC content of the MCMA aerosol, nor do we know their refractive indices. To get around a similar problem, Schnaiter et al. (2003) esti-mated the refractive index of secondary organic aerosols by using known refractive indices of two OC compounds sim-ilar to those that might be found in these aerosols. These two values reported by Schnaiter et al. are 1.43 to 1.45. Ja-cobson (1999) has tabulated the real part of refractive index of many organic compounds; these range from about 1.33 to 1.63. Given these range of values, Re[m˜s] is consistent with a significant OC component in the MCMA aerosol.
Schuster et al. (2005) report values of αλ at many AERONET locations using retrievals of aerosol properties from the AERONET sun photometers. The methodology be-hind their results closely parallels our method, and our set I assumes the same values for the physical properties of BC. The major difference between the two methods is our use of a shell/core model to represent aerosol mixing properties versus Schuster et al.’s use of the Maxwell-Garnett (MG) ef-fective medium approximation (Lesins et al., 2002; Bohren and Huffman, 1983) to find an “effective” refractive index of the aerosol mix. When Schuster at al. used this approxima-tion, the volume fractions of BC and ammonium sulphate, contained in a water host, are iterated until the difference be-tween the calculated and observed (AERONET) values of the index of refraction is minimized. Once the volume fraction is known, MBCis easily calculated.
For Mexico City, Schuster et al. (2005) quote a value of
αλof 9.5±0.9 m2/g when averaged over the years 2000 and 2001, for a wavelength of 550 nm. Recall that for set I, we used the same BC physical parameters as Schuster et al. For this set, our value 8.9 m2/g has been derived for a wavelength of 500 nm, and to compare these two values, we must adjust our value to a wavelength of 550 nm. From measurements of aerosol absorption taken at different wavelengths, Bergstrom et al. (2002) show that the wavelength dependence of BC
4/1 3/0 3 4/1 4/0 3 4/1 5/0 3 4/1 6/0 3 4/1 7/0 3 4/1 8/0 3 4/1 9/0 3 4/2 0/0 3 4/2 1/0 3 4/2 2/0 3 4/2 3/0 3 4/2 4/0 3 4/2 5/0 3 4/2 6/0 3 4/2 7/0 3 4/2 8/0 3 4/2 9/0 3 4/3 0/0 3 5/1 /03 date 0 1 2 3 4 5 6 7 8 9 10 11 12 13 αλ=500 n m Set I Set II
Fig. 1. Bar chart summarizing the values of αλ, for λ=500 nm, over the course of the MCMA field campaign. Results from sets I and II are shown.
absorption is best described by the well-known relationship
λ−1 over a wavelength range of 0.4 to 1.0 µm. Kirchstet-ter et al. (2004) suggest that, for motor vehicle aerosols that have a relatively large BC component, the wavelength de-pendence is also about λ−1in the visible range. These stud-ies indicate that, for our wavelength extrapolation from 500 to 550 nm, the relationship λ−1is appropriate. With this in mind, converting our “set I” value to 550 nm gives 8.1 m2/g [=8.9 m2/g(550 nm/500 nm)−1], which is lower than Schus-ter et al.’s value by about 15%. Our set II value at 550 nm is 7.4 m2/g.
All values mentioned above are less than 10 m2/g, a value commonly accepted for αλat a wavelength of 550 nm. Bond et al. (2006) suggest that aged (i.e., coated) BC aerosols have an (specific) absorption amplification factor of up to 1.5. (Larger values are possible but only for conditions which are unlikely to occur in the atmosphere.) Using Bond
and Bergstrom’s (2006) uncoated value of 7.5±1.2 m2/g (550 nm), the range in αλ from uncoated to coated extends from 7.5±1.2 m2/g up to 11.3±1.8 m2/g, and our values, as well as those of Schuster et al. (2005) lie in this range. Our values are also consistent with Fuller et al. (1999) who suggest that the “canonical” value of 10 m2/g is too large. They arrived at this conclusion by explicitly calculating αλ for randomly spaced BC occlusions within a host sulphate aerosol, and over a wide range of plausible BC mass mix-ing ratios, the calculations indicate that αλ>10 m2/g occurs only when two conditions are met: most of the BC is in-ternally mixed, and the host aerosols are sufficiently large, defined as Rg>0.06, where Rgis the geometric mean radius of the size distribution. Our retrievals of Rg for the MCMA based on the algorithm of Kassianov et al. (2005), indicate that Rgis about 0.035 µm. Alternatively, using the fine com-ponent of the AERONET volume distribution yields an Rg of about 0.032 µm. Both of these radii are smaller that the 0.06 µm limit, suggesting that αλshould be less than 10 m2/g at 550 nm.
2.4 MBC, fv
In addition to αλ, Table 1 provides other aerosol charac-teristics that are derived from our methods, such as MBC.
For both sets I and II the averaged MBC values are about
4 mg/m2. These are large BC loadings. As shown in Schuster (2004), columnar BC concentrations in an urban area (God-dard Space Flight Center [GSFC] near Washington, D.C., USA) inferred from AERONET measurements, can range as high as about 7 mg/m2, although most values are less than 3 mg/m2. That the BC columnar concentrations are larger than those typically found at the GSFC seems intuitively credible, given the very large population and emissions of the MCMA.
2.5 Uncertainties
Quantification of the uncertainties associated with the method described here is possible, but still subject to some educated guesswork. Because our method is similar to that discussed by Schuster et al. (2005), much of the uncertainty analysis contained in Schuster et al. is applicable to our method as well. The sources of uncertainty discussed in Schuster at al. include the obvious ones: the physical and optical properties of carbon and the host aerosol, mixing as-sumptions, and the contamination of the results by absorbing species other than BC. Because these various sources of un-certainty have already been thoroughly discussed in Schuster et al., we will summarize them here. We will also estimate the uncertainty due to the error in the retrieved volume dis-tributions, the departure of the aerosol shape from spherical, and errors in the retrieval of ̟0,λ and τλ. In the discus-sion below, we shall just consider the uncertainties associated with set I; similar arguments would hold for set II. Although
the magnitude of the uncertainties might be somewhat dif-ferent between each set, we must be mindful that these un-certainties cannot be pinned down with exactitude, and an uncertainty estimated for either set is likely to representative of the other set as well.
2.5.1 Density of BC
Considering the discussion of Fuller et al. (1999) plausi-ble bounds for BC density range from 1.7 g/m3to 2.1 g/m3. Bond and Bergstrom (2006) state that the upper end of the plausible range is only 1.9 g/m3. For our set I calculations, we assume a value of 2.0 g/m3for comparison of the results of Schuster et al. (2005). Assuming that the density of BC in the MCMA is bracketed by 1.7 g/m3to 2.1 g/m3, the error bounds on αλare +18% to−5%. That is, αλcould be 18% higher or 5% lower than the values we calculate. Schuster et al. estimated±5%; we think this is a little too low.
2.5.2 Optical properties of BC
The value chosen for the refractive index is 2.0–1.0i, and this is somewhat above the upper end of reported refractive indices (Bond and Bergstrom, 2006) for both the real and imaginary parts. Reducing either the real or imaginary part of the refractive index from the chosen value reduces the cal-culated value of αλ. For example, using a refractive index of 1.85–0.71i (a value employed by Bond et al., 2006, and in the middle of the range suggested by Bond and Bergstrom, 2006), in place of 2.0–1.0i , reduces the αλby about 22%. Even lower values for the imaginary part of the refractive in-dex can significantly reduce αλ. As noted by Schuster at al., using the OPAC (Optical Properties or Aerosols and Clouds) refractive index for soot, 1.75–0.44i, lowers αλby a factor of two, outside the range which is thought plausible. Additional evidence suggests that the OPAC refractive index is not “dark enough” and should be retired (Bond and Bergstrom, 2006), and our results support this assertion. Because the chosen values of both the real and imaginary parts of the refractive index are near the upper bounds thought likely, we estimate a possible positive uncertainty of +10%.
2.5.3 Mixing assumptions and aerosol shape
Scanning electron micrographs of soot-containing particles shown in Johnson et al. (2005) show that the soot is inter-nally mixed. The particles shapes are tortured, and are any-thing but perfect spheres. Because it is impossible to model the optical properties of such aerosols exactly, we must per-force approximate the aerosols as spheres. Given that we as-sume a spherical shape, a concomitant issue is the rules that govern the mixing of the BC within the sphere. In our case, we chose a concentric sphere (CS) model with carbon in the center. Other mixing scenarios are possible. Some lead to unrealistic results; for example, Bond et al. (2006) strongly advise against using volume averaging of refractive indices
because this mixing model overestimates absorption. For in-ternal mixtures, Lesins et al. (2002) examined shell/core con-figurations and refractive index mixing rules such as MG. Optical properties derived from these two scenarios, for the same volume fraction of BC, were typically within 5% of one another. For the fV of the MCMA aerosol, less than 0.03, calculations done by Fuller et al. (1999) of BC absorp-tion – and shown in their Fig. 12 – indicate that the CS model provides nearly identical absorption to a case where the BC inclusion is randomly distributed throughout the host aerosol, or when the inclusion is located just below the surface. Using this as a guide, we estimate any error in using a CS model to be slightly negative (i.e., the actual absorption could be slightly less than our calculations), but close to zero. This estimate is only justifiable for small BC mixing ratios and spherical aerosols.
That the aerosols are not spherical induces some error into our calculation. Recent work using exact calculations of the optical properties of fractal-like soot aggregations in ran-dom orientations (Liu and Mishchenko, 2005) provides some guidance on the extent that aerosol morphology influences
αλ. For example, when the fractal dimension varies from 1.5 (chain-like structures) to 2.4 (more compact and sphere-like), αλ decreases by about 10%. These results are not strictly applicable to our study because, among other things, Liu and Mishchenko focused only on aggregations of soot monomers, and not the more realistic situation of soot mixed with other compounds. Nonetheless, given these results, we speculate that aerosol shape issues introduce an uncertainty of about±10%.
2.5.4 Contamination of results by other absorbing species The air and aerosols in the MCMA contain substances, aside from BC, that absorb sunlight. Surface observations of NO2
concentrations that occur in the morning hours in Mexico City (Rainer Volkamer, personal communication) show that it is large enough (>40 ppb) to be a significant absorber. These high concentrations would contaminate the retrievals of ̟0,λ at wavelengths where there is significant NO2
ab-sorption (440 nm for the AERONET sun photometer and 415 nm for the MFRSR). The effect of this absorption is to reduce the inferred value of ̟0,λcompared to the value that
would be inferred if the NO2absorption were properly taken
into account. The OC content of the MCMA aerosol is sig-nificant (Salcedo et al., 2006) and this large amount of OC could contribute to increased absorption at the UV and near-UV wavelengths (Jacobson, 1999; Kirchstetter et al., 2004), adding to the contamination of ̟0,λ retrievals. Similarly
dust is known to absorb in the UV and near-UV wavelengths (Sokolik and Toon, 1999). The net effect of this contami-nation, if not accounted for, is to attribute the absorption of NO2, OC, and dust to BC. This would tend to increase our
retrieved values of αλ.
We have been able to minimize this error by making re-trievals at a wavelength equal to 500 nm, where the absorp-tion of NO2is small, and the absorption of OC is expected
to be very small (Jacobson, 1999; Kirchstetter et al., 2004). Plots of single scattering albedo versus wavelength reveal a definite dust signature in dusty areas (Dubovik et al., 2002), and this signature is absent in the MCMA data, indicating that dust absorption is not likely to be large. Schuster esti-mated the total contamination bias to be about−10%, that is, the true αλvalues could be lower than calculated by up to this amount. In our case, we estimate that the error is less
than−5% because of the use of the 500 nm wavelength, and
the apparently small dust loading of the MCMA. 2.5.5 Uncertainties in volume distribution retrievals According to Dubovik et al. (2002), for intermediate parti-cles sizes where the bulk of the partiparti-cles reside, the retrieval errors of the volume distribution do not exceed 10% in the maxima of the volume distribution. If we assume that the uncertainty of the retrieved aerosol volumes (i.e., integration of the volume distribution) is the same magnitude, then the derived volumes listed in column five, Table 2 would be un-certain to±10%. (This is a conservative estimate of the error because it does not account for canceling errors during the integration of the volume distribution.) If we again do the calculations and vary the aerosol volume by±10%, the
cal-culated specific absorptions change by about 4%. 2.5.6 Uncertainties in the retrieval of ̟0,λand τλ
The uncertainty in the retrieval of ̟0,λ, 1̟0,λ, and an
uncertainty in τλ, 1τλ, contribute directly to the overall uncertainty of αλ, 1αλ, in the following manner: αλ +
1αλ=(1−(̟0,λ+1̟0,λ))( τλ+1τλ)/MBC, where the
un-certainties in ̟0,λand τλcan be of either sign. Michalsky et al. (2001) states that 1τλis±0.01, while 1̟0,λis about
±0.03 (Dubovik et al., 2002; Georing et al., 2005).
Assum-ing that the real ̟0,λis about 0.9, and the real τλis about 0.33 (the average values for the MCMA campaign), we ob-tain uncerob-tainties of about±30%. For single scattering albe-dos that approach one (e.g., the case of 18 April 2003 with
̟0,λ=0.965), the uncertainty would be much larger.
2.5.7 Summary of errors
Considering all these factors except particle shape, Schus-ter et al. (2005) estimated the overall error in MBCretrievals
to range from−40% to +15% by simply summing the in-dividual uncertainties together. That is, MBC may be
over-estimated by 40% or underover-estimated by 15% and (approxi-mately) visa versa for αλbecause of the inverse relationship between MBC and αλ. Summarizing our uncertainty anal-ysis for αλ gives the following values: (a) density,−5% to 18%; (b) optical properties of BC, +10%; (c) mixing assump-tions and particle shape,±10%; (d) contamination by other
6 7 8 9 10 11 12 13 14 15 16 17 1 time (hours, LST) 8 0 0.1 0.2 0.3 0.4 0.5 0.6 0.7 0.8 0.9 1 AO T ( 5 0 0 n m ) AERONET MFRSR
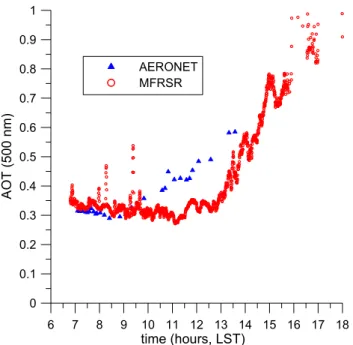
Fig. 2. Aerosol optical thickness (AOT) at 500 nm derived from the
MFRSR and AERONET sun photometer in Mexico City. The date is 27 April 2003.
species,−5% to 0%; (e) uncertainties in the retrievals of the
volume distribution, ±4%; and (f) uncertainties in the re-trievals of ̟0,λand τλ,±30%. A simple addition of these uncertainties, which emphasizes the worst case scenario be-cause no errors are allowed to cancel, yields an overall un-certainty of from about−55% to about +75%. For conve-nience, we simply take uncertainty to be±70%. For a spe-cific absorption of 8.9, this maps into error bars of magnitude of about±6.2 m2/g. Most of the overall uncertainty stems from the large uncertainty in retrieving the single scattering albedo.
3 Discussion
When the αλvalues are converted to 550 nm using the con-version rule, λ−1, and when averaged over all seven cases, our method yields 8.1 m2/g and 7.4 m2/g for sets I and II, respectively. On the other hand, Schuster et al. (2005) de-rived a value of 9.5 m2/g. Baumgartner et al. (2002) mea-sured αλat 550 nm equal to 7.0±0.5 m2/g at the surface using optical methods to measure aerosol absorption and thermal methods to determine EC mass. These values span a plau-sible range as enunciated in Fuller et al. (1999) and Bond et al. (2006). Fuller et al. states that for isolated carbon spheres,
αλis about 5 m2/g, while for aggregates of graphitic carbon grains, αλis about 7 m2/g or less, and for occluded carbon, αλis unlikely to exceed 10 m2/g, except for large, internally mixed aerosols. (Of course, the exact values of these bound-aries depend on the size distribution of the aerosol, as well as
the optical constants assumed for BC.) As mentioned above, assuming an absorption amplification factor of 1.5 (Bond et al., 2006), it can be inferred from Bond and Bergstrom (2006) that the range in αλ extends from 7.5±1.2 m2/g (un-coated) to about 11.3±1.8 m2/g. The evidence from John-son et al. (2005) suggests that the aerosols are internally mixed, yet the aerosols over the MCMA are probably not large enough to expect αλ>10 m2/g. Our results, along with those of Schuster et al. and Baumgartner et al., all lie in a range of about 7–10 m2/g at 550 nm and are therefore con-sistent with the findings of Fuller et al. (1999) and Bond et al. (2006).
The difference in αλ values between the results of Schus-ter et al. (2005) and our method is not large compared to the range of values reported in the literature. However, because our method uses the same BC physical/optical constants and the same volume distributions as Schuster et al., it is inter-esting to investigate why the observed difference exists. It cannot be completely explained by the different ways of deal-ing with the internal mixture, e.g., shell/core versus MG. Us-ing an aerosol volume distribution appropriate for the GSFC, Schuster et al. found that shell/core and MG approaches are similar, except for lower volume fractions of BC, fV<0.2. For very small fV(<0.05), the shell/core method gave higher specific absorptions than MG by at least 10%. These findings indicate that our results should be about 5–10% larger than Shuster et al.’s αλvalues. However, our shell/core values are smaller than Schuster et al.’s values.
It is possible that the short sample period of 7 days during the field campaign does not allow us to sample the full range of conditions found in Schuster et al.’s analysis. Had we been able to perform the analysis over several years as was done in Schuster at al., our values may have become closer to their values. We also must be cognizant of spatial sampling dif-ferences. The spatial sampling could be problematic because the distance between the MFRSR and the AERONET instru-ments is about 16 km, and the possibility that the instruinstru-ments observe different types of aerosols, different aerosol size dis-tributions, etc., cannot be dismissed. For example, Fig. 2 shows simultaneous observations of aerosol optical thickness at 500 nm, taken at the MFRSR and AERONET sites on 27 April 2003. In the morning hours, these optical thicknesses are similar, but diverge as the day progresses. This increas-ing discrepancy can be explained by the meteorology of the MCMA (modelled by Fast and Zhong, 1998): the winds that arise during the morning often blow the pollution towards the AERONET site, and this pollution runs into the mountains and would tend to be recirculated over the site, thus increas-ing the optical thickness at this site over that at the MFRSR site. Whether this increasing optical thickness is associated with a change in aerosol intensive properties (e.g., ̟0,λ)
4 Conclusions
Using data from the MFRSR, as well as aerosol volume dis-tributions obtained from the AERONET sun photometer, we calculated αλ during the MCMA-2003 field campaign, for a wavelength of 500 nm. The method described here uses inferences of the aerosol optical thickness, τλ, and aerosol single scattering albedo, ̟0,λ, obtained from the MFRSR
to estimate the absorption optical thickness, τλ,abs. Once this quantity is estimated, all that is needed is an estimate of columnar concentration of BC, MBC. This method also
relies on the AERONET volume distribution appropriate for the day in question, the assumption of a shell/core model of internal mixing, and specific choices of BC density and re-fractive index to find MBC. For these quantities, we chose
two sets (I and II) of values as listed in Table 2. For set I, the BC physical and optical properties are those stated in Fuller et al. (1999) under the category “Soot G”. These values were chosen so that our results could be compared with those of Schuster et al. (2005). The second (II) comes from “best estimates” of these quantities found in Bond and Bergstrom (2006), as listed in Table 2. When averaged over 7 clear peri-ods of the MCMA-2003 field campaign, consisting of a total of about 10 h in the morning over the month of April 2003, the values of αλ are 8.9 m2/g (I) or 8.2 m2/g (II) at 500 nm. The estimated level of worst case uncertainty for our method
is±70%. This estimate assumes all errors are additive and
of the same sign.
When converted to a wavelength of 550 nm using a λ−1 conversion rule, the values of αλ are 8.1 m2/g and 7.4 m2/g, for sets I and II, respectively. For the aerosol size dis-tributions observed in the MCMA, these values lie within the range of likely αλ values as demarcated by Fuller et al. (1999), Bond and Bergstrom (2006), and Bond et al. (2006).
Schuster et al. (2005) have derived an αλvalue of 9.5 m2/g at 550 nm using methods similar to our method, and Baum-gartner et al. (2002) report a surface value of 7.0±0.5 m2/g at 550 nm, obtained using an entirely different technique. All reported values, including our own, lie in a range between about 7 and 10 m2/g for aerosols that are moderately aged. Refining the optically based αλvalues discussed in this pa-per will require more precise information about the refractive indices and densities of BC, and/or a method of finding the BC load throughout the vertical extent of the atmosphere. As noted by Schuster et al. results such as those presented here have not been validated by elemental carbon measurements throughout the atmospheric column.
It cannot be underemphasized that these results can only be considered as effective, “radiatively correct” results, meaning that given the assumptions discussed in Sect. 2.2, the αλ and MBC values are those required to force
calcu-lated irradiances to be identical with measured irradiances at 500 nm. Using a different set of assumptions would result in different values of αλand MBC, but these values would still
be consistent with the requirement that calculated and mea-sured irradiances match. It must be noted, however, that to obtain specific absorption values far outside the range speci-fied above would require rather dubious assumptions regard-ing the physical and optical properties of BC. For example, if for case 6 (αλ=8.8 m2/g), we assume that the refractive index is 2.1–1.2i in place of 2.0–1.0i, then to obtain a spe-cific absorption at the upper end of the expected range (about 13 m2/g), the chosen density value would have to be about 1.4 g/m3 (assuming no other source of uncertainties). This value, as well as the refractive index value, lie outside the ranges thought plausible.
Acknowledgements. The authors are grateful to the other
par-ticipants in the MCMA-2003 field campaign for their useful discussions regarding this work. The authors also thank J. Hubbe for setting up the MFRSR in Mexico City and Ben deFoy of MIT for providing us the relative humidity sounding data. We would also like to thank the AERONET program for the collection and analysis of sun photometer data, which led to the aerosol volume distributions and aerosol single scattering albedos used in this study. Discussions with C. Doran and G. Schuster are also greatly appreciated. The comments of the reviewers were also very useful. This research was sponsored in part by the U.S. Department of Energy’s Atmospheric Science Program (ASP) under Contract DE-AC06-76RLO 1830 at Pacific Northwest National Laboratory. The Pacific Northwest National Laboratory is operated for the U.S. Department of Energy by the Battelle Memorial Institute. The MIT team would like to acknowledge financial support from the National Science Foundation (Award No. ATM-0308748) and the Mexico City Environmental Commission.
Edited by: U. P¨oschl
References
Ackerman, T. P. and Toon, O. B.: Absorption of visible radiation in atmosphere containing mixtures of absorbing and non-absorbing particles, Appl. Opt., 20, 3661–3668, 1981.
Arnott, W. P., Moosm¨uller, H., Sheridan, P. J., Ogren, J. A., Raspet, R., Slaton, W. V., Hand, J. L., Kreidenweis, S. M., and Collett, J. L.: Photoacoustic and filter-based ambient aerosol light absorption measurements: Instrument comparisons and the role of relative humidity, J. Geophys. Res., 108(D1), 4034, doi:10.1029/2002JD002165,2003.
Baumgartner, D., Raga, G., Kok, G., Ogren, J., Rosas, I., Baez, A., and Novakov, T.: On the evolution of aerosol properties at a mountain site above Mexico City, J. Geophys. Res., 105, 22 243– 22 253, 2000.
Baumgartner, D., Raga, G., Peralta, O., Rosas, I., Cas-tro, T., Kuhlbusch, T., John, A., Petzold, A.: Diagnos-ing black carbon trends in large urban areas usDiagnos-ing carbon monoxide measurements, J. Geophys. Res., 107(D21) 8342, doi:10.1029/2001JD000626, 2002.
Bergstrom, R. W., Russell, P. B., and Hignett, P.: Wavelength de-pendence of the absorption of black carbon particles: Predictions and results from the TARFOX experiment and implications for
the aerosol single scattering albedo, J. Atmos. Sci., 59, 567–577, 2002.
Bohren, C. F. and Huffman, D. R.: Absorption and scattering of light by small particles, John Wiley & Sons, New York, 1983. Bond, T. C. and Bergstrom, R. W.: Light absorption by
carbona-ceous particles: An investigative review, Aerosol Sci. Technol., 40, 27–67, 2006.
Bond, T. C., Habib, G., and Bergstrom, R. W.: Limitations in the enhancement of visible light absorption due to mixing state, J. Geophys. Res., 111, D20211, doi:10.1029/2006JD007315. 2006. Chung, S. H. and Seinfeld, J. H.: Global distribution and climate forcing of carbonaceous aerosols, J. Geophys. Res., 107(D19), 4407, doi:10.1029/2001JD001397, 2002.
Chylek, P., Videen, G., Ngo, D., Pinnick, R. G., and Klett, J. D.: Ef-fect of black carbon on the optical-properties and climate forcing of sulfate aerosols, J. Geophys. Res., 100(D8), 16 325–16 332, 1995.
Dubovik, O. and King, M. D.: A lexible inversion algorithm for retrieval of aerosol optical properties from Sun and sky radi-ance measurements, J. Geophys. Res., 105(D16), 20 673–20 696, 2000.
Dubovik, O., Holben, B., Eck, T. F., Smirnov, A., Kaufman, Y. J., King, M. D., Tanr´e, D., and Slutsker, I.: Variability of absorption amd optical properties of key aerosol types observed in world-wide locations, J. Atmos. Sci., 59, 590–608, 2002.
Fast, J. D. and Zhong, S. Y.: Meteorological factors associated with inhomogeneous ozone concentrations within the Mexico City basin, J. Geophys. Res., 103(D15), 18 927–18 946, 1998. Fuller, K. A., Malm, W. C., and Kreidenweis, S. M.: Effects of
mix-ing on extinction by carbonaceous particles, J. Geophys. Res., 104(D13), 15 941–15 954, 1999.
Gaffney, J. S., Marley, N. A., Cunningham, M. M., and Doskey, P. V.: Measurements of peroxyacyl nitrates (PANS) in Mexico City: implications for megacity air quality impacts on regional scales, Atmos. Environ., 33(30), 5003–5012, 1999.
Goering, C. D., L’Ecuyer, T. S., Stephens, G. L., Slusser, J. R., Scott, G., Davis, J., Barnard, J. C., and Madronich, S.: Simulta-neous retrievals of column ozone and aerosol optical properties from direct and diffuse solar irradiance measurements, J. Geo-phys. Res., 110, D05204, doi:10.1029/2004JD005330, 2005. Harrison, L., Michalsky, J., and Berndt, J.: Automated
multifil-ter rotating shadow-band radiomemultifil-ter: an instrument for optical depth and radiation measurements, Appl. Opt., 33, 5118–5125, 1994.
Heintzenberg, J., Charlson, R. J., Clarke, A. D., Liousse, C., Ramaswamy, V., Shine, K. P., Wendisch, M., and Helas, G.: Measurements and modeling of aerosol single-scattering albedo: Progress, problems, and prospects, Beitr. Phys. Atmosph., 70, 249–263, 1997.
Holben, B. N., Eck, T. F., Slutsker, I., Tanre, D., Buis, J. P., Set-zer, A., Vermote, E., Reagan, J. A., Kaufman, Y., Nakajima, T., Lavenu, F., Jankowiak, I., and Smirnov, A.: AERONET – A fed-erated instrument network and data archive for aerosol character-ization, Remot. Sens. Environ., 66, 1–16, 1998.
Horvath, H.: Atmospheric light-absorption – a review, Atmos. En-viron., 27(3), 293–317, 1993.
Jacobson, M. Z.: Isolating nitrated and aromatic aerosols and ni-trated aromatic gases as sources of ultraviolet light absorption, J. Geophys. Res., 104(D3), 3527–3542, 1999.
Jacobson, M. Z.: A physically-based treatment of elemental carbon optics: Implications for global direct forcing of aerosols, Geo-phys. Res. Lett., 27(2), 217–220, 2000.
Jacobson, M. Z.: Strong radiative heating due to the mixing state of black carbon in atmospheric aerosols, Nature, 409(6821), 695– 697, 2001.
Johnson, K. S., Zuberi, B., Molina, L. T., Molina, M. J., Iedema, M. J., Cowin, J. P., Gaspar, J. D., Wang, C., and Laskin, A.: Processing of soot in an urban environment: case study from the Mexico City Metropolitan Area, Atmos. Chem. Phys., 5, 3033– 3043, 2005,
http://www.atmos-chem-phys.net/5/3033/2005/.
Kassianov, E. I., Barnard, J. C., and Ackerman, T. P.: Retrieval of aerosol microphysical properties using surface MFRSR data: Modeling and observations, J. Geophys. Res., 110, D09201, doi:10.1029/2004JD005337, 2005.
King, M., Byrne, D., Herman, B., and Reagan, J.: Aerosol size distribution obtained by inversion of spectral optical depth mea-surements, J. Atmos. Sci., 35, 2153–2167, 1978.
Kirchstetter, T. W., Novakov, T., and Hobbs, P. V.: Evidence that the spectral dependence of light absorption by aerosols is affected by organic carbon, J. Geophys. Res., 109, D21208, doi:10.1029/2004JD004999, 2004.
Lesins, G., Chylek, P., and Lohmann, U.: A study of internal and external mixing scenarios and its effect on aerosol optical prop-erties and direct radiative forcing, J. Geophys. Res., 107(D10), 4094, doi:10.1029/2001JD00973,2002.
Liousse, C., Cachier, H., and Jennings, S. G.: Optical and thermal measurements of black carbon aerosol content in different en-vironments - variation of the specific attenuation cross-section, sigma (sigma), Atmos. Environ., 27(8), 1203–1211, 1993. Liu, L. and Mishchenko, M. I.: Effects of aggregation on scattering
and radiative properties of soot aerosols, J. Geophys. Res., 110, D11211, doi:10.1029/2004JD005649, 2005.
Long, C. N. and Ackerman, T. P.: Identification of clear skies from broadband pyranometer measurements and calculation of down-welling shortwave cloud effects, J. Geophys. Res., 105(D12), 15 609–15 626, 2000.
Marley, N. A., Gaffney, J. S., Baird, C., Blazer, C. A., Drayton, P. J., and Frederick, J. E.: An empirical method for the determination of the complex refractive index of size-fractionated atmospheric aerosols for radiative transfer calculations, Aerosol Sci. Technol., 34(6), 535–549, 2001.
Michalsky, J. J., Schlemmer, J. A., Berkheiser, W. E., Berndt, J. L., Harrison, L. C., Laulainen, N. S., Larson, N. R., and Barnard, J. C.: Multi-year measurements of aerosol optical depth in the atmospheric radiation measurement and quantitative links pro-grams., J. Geophys. Res., 106(D11), 12 099–12 107, 2001. Molina, M. J., Molina, L. T., West, J., Sosa, G., Sheinbaum-Pardo,
C., San-Martini, F., Zavala, M. A., McRae, G.: Air pollution sci-ence in the MCMA: Understanding source-receptor relationships through emissions inventories, measurements, and modeling, in: Air Quality in the Mexico Megacity: An Integrated Assessent, edited by: Molina, M. J. and Molina, L. T., Kluwer Academic Publishers, Dordrecht, The Netherlands, 2002, pp. 137–202. Moosm¨uller, H., Arnott, W. P., Rogers, C. F., Chow, J. C., Frazier,
C. A., Sherman, L. E., and Dietrich, D. L.: Photoacoustic and filter measurements related to aerosol light absorption during the Northern Front Range Air Quality Study (Colorado 1996/1997),
J. Geophys. Res., 103(D21), 28 149–28 157, 1998.
Park, K., Kittleson, D. B., Zachariah, M. R., and McMurry, P. H.: Measurement of inherent material density of nanoparticle ag-glomerates, J. Nanoparticle Res., 6, 267–272, 2004.
Penner, J. E., Chuang, C. C., and Grant, K.: Climate forcing by carbonaceous and sulfate aerosols, Clim. Dyn., 14(12), 839–851, 1998.
Petters, J. L., Saxena, V. K., Slusser, J. R., Wenny, B. N., and Madronich, S.: Aerosol single scattering albedo re-trieved from measurements of surface UV irradiance and a radiative transfer model, J. Geophys. Res., 108(D9), 4288, doi:10.1029/2002JD002360, 2003.
Petzold, A., Kopp, C., and Niessner, R.: The dependence of the specific attenuation cross-section on black carbon mass fraction and particle size, Atmos. Environ., 31(5), 661–672, 1997. Riemer, N., Vogel, H., Vogel, B., and Fiedler, F.: Modeling
aerosols on the mesoscale-gamma: Treatment of soot aerosol and its radiative effects, J. Geophys. Res., 108(D19), 4601, doi:10.1029/2003JD003448, 2003.
Salcedo, D., Onasch, T. B., Dzepina, K., Canagaratna, M. R., Zhang, Q., Huffman, J. A., DeCarlo, P. F., Jayne, J. T., Mor-timer, P., Worsnop, D. R., Kolb, C. E., Johnson, K. S., Zuberi, B., Marr, L. C., Volkamer, R., Molina, L. T., Molina, M. J., Car-denas, B., Bernab´e, R. M., M´arquez, C., Gaffney, J. S., Marley, N. A., Laskin, A., Shutthanandan, V., Xie, Y., Brune, W., Lesher, R., Shirley, T., and Jimenez, J. L.: Characterization of ambi-ent aerosols in Mexcico City during the MCMA-2003 campaign with Aerosol Mass Spectrometry: Results from the CENICA su-persite, Atmos. Chem. Phys., 5, 925–946, 2006,
http://www.atmos-chem-phys.net/5/925/2006/.
Sato, M., Hansen, J., Koch, D., Lacis, A., Ruedy, R., Dubovik, O., Holben, B., Chin, M., and Novakov, T.: Global atmospheric black carbon inferred from AERONET, Proceedings National Academy Sci. US, 100, 6319–6324, 2003.
Schnaiter, M., Horvath, H., M¨ohler, O., Naumann, K.-H., Saathoff, H., and Sch¨ock, O. W.: UV-VIS-NIR spectral optical properties of soot and soot-containing aerosols, J. Aerosol Sci., 34, 1421– 1444, 2003.
Schuster, G. L.: Inferring the specific absorption and concentration of black carbon from AERONET aerosol retrievals, Ph. D. thesis, The Pennsylvania State University, 2004.
Schuster, G. L., Dubovik, O., Holben, B. N., and Clothiaux, E. E.: Inferring black carbon content and specific absorption from AERONET retrievals, J. Geophys. Res., 101, D10S17, doi:10.1029/2004JD004548, 2005.
Schuster, G. L., Dubovik, O., and Holben, B. N.: Angstrom ex-ponent and bimodal aerosol size distributions, J. Geophys. Res., 111, D07207, doi:10.1029/2005JD006328, 2006.
Seinfeld, J. H. and Pandis, S. N.: Atmospheric Chemistry and Physics, John Wiley & Sons, New York, 1998.
Sokolik, I. N. and Toon, O. B.: Incorporation of mineralogical com-position of aerosols into models of radiative properties of min-eral aerosol from the UV to IR wavelengths, J. Geophys. Res., 104(D8), 9423–9444, 1999.
Toon, O. B., Pollack, J. B., and Khare, B. N.: Optical constants of several atmospheric aerosol species – ammonium sulfate, alu-minum oxide, and sodium chloride, J. Geophys. Res., 81(33), 5733–5748, 1976.
Waggoner, A. P., Weiss, R. E., Ahlquist, N. C., Covert, D. S., Will, S., and Charlson, R. J.: Optical characteristics of atmospheric aerosols, Atmos. Environ., 15(10–1), 1891–1909, 1981. Whiteman, C. D., Zhong, S., Bian, X., Fast, J. D., and Doran, J. C.:
Boundary layer evolution and regional-scale diurnal circulations over the Mexico Basin and Mexican plateau, J. Geophys. Res., 105(D8), 10 081–10 102, 2000.
Wu, J.-S., Krishnan, S. S., and Feath, G. M.: Refractive indices at visible wavelengths of soot emitted from buoyant turbulent diffusion flames, J. Heat Transfer, 119, 230–237, 1997.