HAL Id: hal-00577785
https://hal.archives-ouvertes.fr/hal-00577785
Submitted on 18 May 2017
HAL is a multi-disciplinary open access
archive for the deposit and dissemination of
sci-entific research documents, whether they are
pub-lished or not. The documents may come from
teaching and research institutions in France or
abroad, or from public or private research centers.
L’archive ouverte pluridisciplinaire HAL, est
destinée au dépôt et à la diffusion de documents
scientifiques de niveau recherche, publiés ou non,
émanant des établissements d’enseignement et de
recherche français ou étrangers, des laboratoires
publics ou privés.
continental margin: insights from wide-angle seismic
data
L. Watremez, S. Leroy, S. Rouzo, E. d’Acremont, P. Unternehr, C. Ebinger, F.
Lucazeau, A. Al-Lazki
To cite this version:
L. Watremez, S. Leroy, S. Rouzo, E. d’Acremont, P. Unternehr, et al.. The crustal structure of the
north-eastern Gulf of Aden continental margin: insights from wide-angle seismic data. Geophysical
Journal International, Oxford University Press (OUP), 2011, 184 (2), pp.575 - 594.
�10.1111/j.1365-246X.2010.04881.x�. �hal-00577785�
Geophys. J. Int. (2011) 184, 575–594 doi: 10.1111/j.1365-246X.2010.04881.x
GJI
Geo
dynamics
and
tectonics
The crustal structure of the north-eastern Gulf of Aden continental
margin: insights from wide-angle seismic data
L. Watremez,
1,∗S. Leroy,
1,2S. Rouzo,
1E. d’Acremont,
1P. Unternehr,
3C. Ebinger,
4F. Lucazeau
5and A. Al-Lazki
61ISTeP, UPMC University Paris 06, 75252 Paris Cedex 05, France. E-mail: [email protected] 2ISTeP, CNRS - UMR 7193, France
3Total, Exploration-Production, Geosciences, Paris La Defense 92078, France 4Department Earth and Environmental Sciences, University of Rochester, USA 5Geosciences Marines, IPGP-CNRS, 4 place Jussieu, Paris Cedex 05 75252, France 6University Sultan Qaboos, PO Box 50, Al-Khod, Muscat, PC123, Oman
Accepted 2010 November 2. Received 2010 October 28; in original form 2010 March 31
S U M M A R Y
The wide-angle seismic (WAS) and gravity data of the Encens survey allow us to determine the deep crustal structure of the north-eastern Gulf of Aden non-volcanic passive margin. The Gulf of Aden is a young oceanic basin that began to open at least 17.6 Ma ago. Its current geometry shows first- and second-order segmentation: our study focusses on the Ashawq–Salalah second-order segment, between Alula–Fartak and Socotra–Hadbeen fracture zones. Modelling of the WAS and gravity data (three profiles across and three along the margin) gives insights into the first- and second-order structures. (1) Continental thinning is abrupt (15–20 km thinning across 50–100 km distance). It is accommodated by several tilted blocks. (2) The ocean–continent transition (OCT) is narrow (15 km wide). The velocity modelling provides indications on its geometry: oceanic-type upper-crust (4.5 km s−1) and continental-type lower crust (>6.5 km s−1). (3) The thickness of the oceanic crust decreases from West (10 km) to the East (5.5 km). This pattern is probably linked to a variation of magma supply along the nascent slow-spreading ridge axis. (4) A 5 km thick intermediate velocity body (7.6 to 7.8 km s−1) exists at the crust-mantle interface below the thinned margin, the OCT and the oceanic crust. We interpret it as an underplated mafic body, or partly intruded mafic material emplaced during a ‘post-rift’ event, according to the presence of a young volcano evidenced by heat-flow measurement (Encens-Flux survey) and multichannel seismic reflection (Encens survey). We propose that the non-volcanic passive margin is affected by post-rift volcanism suggesting that post-rift melting anomalies may influence the late evolution of non-volcanic passive margins.
Key words: Controlled source seismology; Continental margins: divergent; Crustal structure;
Indian Ocean.
1 I N T R O D U C T I O N
Continental break-up is an important process in forming a new plate boundary. It proceeds by continental extension associated with magmatism and/or tectonic deformation and it leads to continen-tal margins formation and oceanic spreading. Many fundamencontinen-tal questions remain unsolved about the way the lithosphere evolves during the continental rifting and the effects on rift evolution of key parameters such as crustal thickness, composition, extension rate and temperature.
∗Now at: Department of Oceanography, Dalhousie University, Halifax, NS,
Canada, B3H 4J1.
Continental extension begins with extensional stresses applied to the lithosphere until it breaks apart, culminating in crustal rupture and accretion of the new oceanic lithosphere. Continental break-up is a complex process distributed in time and space (P´eron-Pinvidic & Manatschal 2009). Realistic rheologies, inducing depth-dependent stretching and focussing of the deformation, have been suggested to explain the evolution of the deformation during extension of the continental lithosphere (e.g. Brun & Beslier 1996; Davis & Kusznir 2004; Lavier & Manatschal 2006; P´erez-Gussiny´e et al. 2003; Reston 2007; Huismans & Beaumont 2008).
Continental rifted margins are usually classified into volcanic and non-volcanic margins:
(1) Non-volcanic margins are characterized by a block-faulted basement, no clear evidence of magmatism during the rifting and
a transition between the thinned continental crust and the oceanic crust (ocean–continent transition, OCT, e.g. Chian et al. 1995; Dean
et al. 2000; Funck et al. 2003) of variable width (30 to 200 km)
and ambiguous nature. A high seismic velocity structure can be observed in the OCT. On the West Iberia margin, drillings, dives and dredges have revealed serpentinised peridotites of a zone of exhumed continental mantle. The OCT have been also interpreted as serpentinised peridotite in the Labrador sea (Chian et al. 1995) and the Newfoundland margins (Reid 1994). The limited magmatism of these non volcanic margins has been attributed to ultra-slow opening rates and cold mantle conditions (i.e. ragged oceanic crust, Cannat
et al. 1995).
(2) Volcanic margins are mostly characterized by seaward dipping reflectors (SDRs) related to tilted basalt floods (e.g. Mutter et al. 1982; Geoffroy 2005), a thick lower crust featuring a higher than normal velocity sometimes called underplating and a thick oceanic crust, (e.g. White & McKenzie 1989; Holbrook et al. 1994b). The very sharp transition between continental and oceanic domains occur below the SDRs (e.g. Mjelde et al. 2005, 2007) and some authors talk about a continent–ocean boundary (COB, e.g. Bauer et al. 2000; Hopper et al. 2003). Normal faults are ob-served on volcanic margins, but there is no well-organized tilted blocks (e.g. Veevers & Cotterill 1978; Menzies et al. 2002). The excess of melt leading to the large amount of effusive and igneous material at the COB and early oceanic crust is primarily related to a high mantle temperature anomaly (Bown & White 1994; White & McKenzie 1989; Holbrook et al. 2001).
Thus, the volcanic or non-volcanic character of a passive mar-gin may be inferred by the OCT nature and crustal thicknesses.
Multi-channel seismic (MCS) provides information on superficial structures whereas wide-angle seismic (WAS) and gravity provide crustal thicknesses and indirect information on the OCT nature. Combining these two sets of data allows a good knowledge on the structures and evolution of rifted margins and the location and sug-gested nature of the OCT (e.g. Horsefield et al. 1994; Holbrook
et al. 1994a,b; Chian et al. 1995; Hopper et al. 2003; Funck et al.
2004; Greenroyd et al. 2008). The accurate boundary location of the OCT and its nature are still discussed in areas where there are no samples, such as in the north-eastern Gulf of Aden.
Three second-order segments are described between Alula–Fartak and Socotra–Hadbeen fracture zones (Fig. 1), with different geometries (Fig. 2, Leroy et al. 2010b). This WAS/ gravity study, coincident with MCS data, focusses on the western second-order segment: Ashawq–Salalah segment to image the structures formed during the rift. The velocity models show the great variability of the crustal structures of the Ashawq–Salalah segment up to the western edge of the Taqah one. Magmatism is evidenced below the OCT and oceanic crusts, suggesting a post-rift magmatic activity of the margin, in agreement with the MCS study (Autin et al. 2010).
2 G E O L O G I C A L S E T T I N G S O F T H E G U L F O F A D E N
The Gulf of Aden is a young oceanic basin which separates Arabia from Somalia (Fig. 1). It exhibits volcanic margins in the western part (Tard et al. 1991) related to the Afar hotspot activity and magma-poor margins in the eastern part (d’Acremont et al. 2005). The mean orientation of the Gulf of Aden (N75◦E), oblique to the
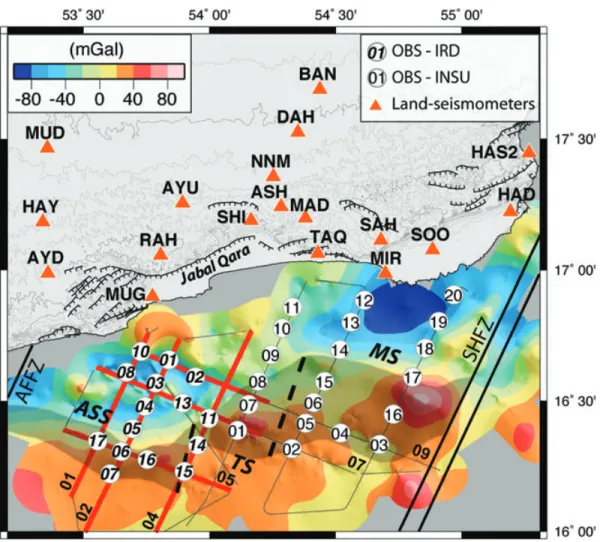
Figure 1. Location of the study area in the eastern Gulf of Aden. AFFZ, Alula–Fartak fracture zone; CR, Carlsberg ridge; DB, Danakil Block; GT, Gulf
of Tadjoura; OFZ, Owen fault zone; SHFZ, Socotra-Hadbeen fracture zone; SSFZ, Shukra-el-Sheik fracture zone. The direction of extension of the Gulf is highlighted by the black arrows, full extension velocity in the eastern part of the Gulf of Aden is about 2.34 cm yr−1(Jestin et al. 1994), and coastlines and oceanic spreading axis are underlined by continuous lines. Relief is compiled from SRTM topography data (Rodriguez et al. 2005) and Sandwell & Smith (1997) predicted bathymetry.
C
Crustal structure of the NE Gulf of Aden 577
Figure 2. Free-air gravity anomaly map on the Oman margin with locations of OBS, land-stations and wide-angle seismic lines during the Encens experiment.
Gravity data are 100 m gridded from the Encens-Sheba and Encens experiments (Leroy et al. 2004, 2010b). Grey lines are wide-angle ship track; seismic lines shown in this study are located by red bold lines. AFFZ, Alula–Fartak fracture zone; SHFZ, Socotra–Hadbeen fracture zone; ASS, Ashawq–Salalah segment; TS, Taqah segment; MS, Mirbat segment. Bold dashed lines are segments boundary. Location of the map is shown as a dashed rectangle on the regional map, Fig. 1. Shaded area is OCT inferred from the compilation of geophysical observations (for the Ashawq–Salalah segment; multi-channel/wide-angle seismics, magnetism and heat flow, Autin et al. 2010; Leroy et al. 2010b). OBS were provided by IRD and INSU institutions. IRD ones (thick numbers) were four components (geophone, vertical and two horizontals) and INSU were two components (geophone and vertical).
direction of extension is N26◦E induces a high segmentation of the margins.
Between the Gulf of Tadjoura and the Owen fracture zone, the spreading axis, named Sheba ridge then Aden ridge, is segmented by three main fracture zones, namely the Shukra-el–Sheik fracture zone, the Alula–Fartak and the Socotra–Hadbeen transform faults (Fig. 1). Spreading rates increase from West, close to the Shukra-el-Sheik discontinuity (1.6 cm yr−1, azimuth N025◦E), to East between Alula–Fartak and Socotra–Hadbeen fracture zones (2.34 cm yr−1 azimuth N027◦E; Fournier et al. 2001; Vigny et al. 2006).
The rifting which started 35 Ma ago (Roger et al. 1989; Bott
et al. 1992; Watchorn et al. 1998), coincides with the climax of
the Afar hotspot activity (Hofmann et al. 1997; Ebinger & Sleep 1998; Kenea et al. 2001; Leroy et al. 2010a) and the onset of the seafloor spreading occurred at least 17.6 Ma ago in the eastern part (Leroy et al. 2004; d’Acremont et al. 2006; Leroy et al. 2010b). Previous studies of the eastern Gulf of Aden, between Alula–Fartak and Socotra–Hadbeen fracture zones, show that the passive mar-gins are non-volcanic (no SDRs are observed) and outcrops on land (in Southern Oman in Dhofar and Socotra, Roger et al. 1989;
d’Acremont et al. 2005; Bellahsen et al. 2006; Autin et al. 2010; Leroy et al. 2010b, Fig. 1).
The north-eastern Gulf of Aden OCT inferred from seismic flection data and magnetic and gravity data has been accurately re-mapped with the new data set of MCS, WAS, gravity, magnetism and heat flow measurements recorded during the Encens and Encens-Flux cruises (Leroy et al. 2010b). The OCT is relatively narrow (<15 km wide) in the Ashawq–Salalah segment (Autin et al. 2010) and widen toward the east in the Taqah (from 15 to 50 km) and Mirbat segment (50 km, Leroy et al. 2010b) and is characterized continentward by the last occurrence of syn-rift wedges of sedi-ments, by a lowering of the free-air gravity anomaly continentward (Fig. 2), by a generally quiet magnetic zone with local anomalies, and by the oldest identified oceanic magnetic anomaly, oceanward. Autin et al. (2010) show that the formation of the OCT on this seg-ment of the margin is the result of a long and complex interaction of tectono-metamorphic and magmatic events.
Crustal thicknesses of the Dhofar margin inferred offshore from gravity and onshore from receiver function analysis, ranges from 36.6 km in the North and 25.6 km on the coastline to 16 km and less
to 2 km in the deep part of the north-eastern Gulf of Aden (Leroy
et al. 2004; d’Acremont et al. 2006; Tiberi et al. 2007). Crustal
thinning is accommodated by several tilted blocks (d’Acremont
et al. 2005; Autin et al. 2010; Leroy et al. 2010b) and on land, a
thinning of about 11 km occurs in 30 km.
In the Ashawq–Salalah segment, a deep offshore volcano was discovered by heat-flow values as high as 890 mW m−2(Lucazeau
et al. 2009) on the top of a volcano, imaged by MCS (Autin et al.
2010). The study of MCS profiles suggests that the volcano was active after the continental break-up, during the post-rift (Autin et al. 2010) and at least until 100 000 yr ago (Lucazeau et al. 2009). The late volcanic activity is proposed to be related to a melting anomaly observed in the western segment of the present-day Sheba ridge (d’Acremont et al. 2010) and explained by the channelized flow of Afar plume material along the Aden–Sheba ridges system (Leroy
et al. 2010a). These observations and the evidence of the presence
of molten upper-mantle beneath the Dhofar (Basuyau et al. 2010) tend to extend the influence of the Afar plume farther eastward into the Gulf of Aden than believed by previous studies (e.g. H´ebert
et al. 2001).
3 D AT A A C Q U I S I T I O N A N D M O D E L L I N G P R O C E D U R E 3.1 Encens cruise
One of the two part of the Encens cruise was dedicated to the WAS (Leroy et al. 2006). A total of 35 OBS and 21 land-seismometers recording ca. 8000 shots were deployed along six profiles parallel and perpendicular to the direction of opening (Fig. 2). The mean distance between OBS is 15 km. OBS data are corrected for the clock drift during the deployment and positions are relocated to correct the possible drift during deployment through inversion of the direct waves arrival times.
The source consists of an array of 18 airguns (seven Bolts and 11 G-guns) of variable volume (1.2 to 16 l, setting a total volume of 138, l at immersion depth of 22–25 m) tuned so that the second bubble pulse of each gun is synchronized, providing a powerful low-frequency source (‘monobulle’ source, Avedik et al. 1993). The shot interval is set to 150 m using differential GPS positioning (approximately 1 min at a speed of 5 knots). Shots were only fired offshore (Fig. 2).
The vertical component of the receivers is chosen for this analysis. Records are of very good quality (e.g. Fig. 3) and no particular processing is required except an offset-dependant gain. A few land-seismometers needed a gentle band-pass filtering to remove low frequency noise. Distinct seismic events are identified at offsets up to 80 km (OBS) and 210 km (landstations).
3.2 Velocity modelling
The 2-D ray tracing algorithm Rayinvr (Zelt & Smith 1992) is used to model the wide-angle seismic data. The model consists in a succession of layers of similar velocities (model parameters are velocity and interface nodes). Traveltimes of the P-waves are picked on records as a set of reflected and refracted phases con-straining the different layers (see the correspondence between the seismic phases and the geological units and interfaces in Table 1 and Fig. 3). A forward modelling method is adopted, following a top to bottom layer-stripping strategy (Zelt 1999). The velocity model is built layer after layer, with a trial and error approach, minimiz-ing the time-gap between observed and synthetic traveltimes. The
uncertainty is evaluated for each pick, depending on the signal to noise ratio, following the parameterization of Zelt & Forsyth (1994). A misfit parameter (χ2) close to 1 warrants that the data are well
exploited, with no over-interpretation (Bevington 1969; Zelt 1999). The number of picks, RMS traveltime residuals andχ2 are listed
for each line in Table 2 and for each phases and whole-models in Table A1.
Reinterpretation of the data may be needed during the process. To achieve the simplest model that account for the data, modelling is carried out introducing as few parameters as possible (velocity and interface nodes). However, the sea bottom and, to a lesser extent, the top-basement interfaces were imaged by the coincident MCS profiles, they are thereby described by a larger number of interface nodes. Eventually, 11 phases are identified, constraining up to six geological units (Table 1).
The velocities of the most superficial structures are prescribed by the two-way traveltimes, converted interfaces (mainly the acoustic basement) and the stack velocities inferred from MCS processing (Autin et al. 2010).
3.3 Gravity modelling
Gravity data were continuously acquired during the Encens cruise along MCS and/or WAS profiles using a relative gravimeter (KSS31) (Fig. 2, Leroy et al. 2010b).
Modelling of the free-air gravity anomaly provides a valuable control on the velocity structure. An empirical velocity-density re-lationship is used to infer the density model from velocity distri-bution (Ludwig et al. 1970). The contridistri-bution to the anomaly of each block of constant density is estimated using the Talwani et al. (1959) method, assuming a 2.5D geometry.
4 R E S U L T S 4.1 Velocity
The interpretation and modelling of the WAS data lead to the ve-locity models shown in Figs 4 (across-margin lines, i.e. ENCR01, 02 and 04) and 5 (along-margin lines, i.e. ENCR05, 07, 09). Ve-locities are colour-coded. Note that segments of velocity models interfaces constrained by wide-angle reflections are shown using a thicker black line and surfaces effectively sampled by seismic rays are highlighted using brighter areas (Figs 4 and 5).
The main features of the velocity models are summarized below, according to the major units.
4.1.1 Sedimentary layers
Although sediments have few imprint in the WAS records, two sedimentary layers limited by an interface are discriminated above the basement in the deepest basins. Typical velocities range from 1.6 to 2.5 km s−1in the upper sedimentary layer and reach 4.2 km s−1in the deep basins (ENCR02, Fig. 4). Velocities are uniform along the lines and from profile to profile. Sediments thickness varies from 1 to 2 km. It locally reaches 3 km in the deeper graben (ENCR01 at 57 km and ENCR02 at 52 and 78 km, Fig. 4). The upper layer relies mostly on syn-OCT and post-rift sediments whereas the lower layer, when observed using WAS data, relies on syn-rift sediments in the thinned continental domain (ENCR01 and 02). The second sedimentary layer is the deep infill of basins; it is constrained by wide-angle reflections and refractions. Its top coincides with a major
C
Crustal structure of the NE Gulf of Aden 579
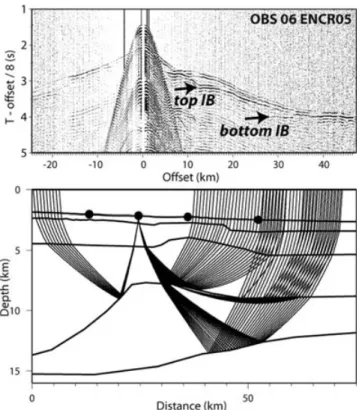
Figure 3. (A) OBS 06 record of shots along ENCR05 profile. A reduction velocity of 8.0 km s−1is applied. Red line corresponds to the bathymetry and black
stars are OBS positions along the profile. Note the high amplitude wide-angle reflections. (B) Picks with variable uncertainties over the seismic record; colour code refers to interpreted phases (see Table 1). (C) Synthetic traveltimes from wide-angle modelling (black dots) superimposed to the picked traveltimes (same colour code as in B). (D) Corresponding ray tracing (same colour code as in B).
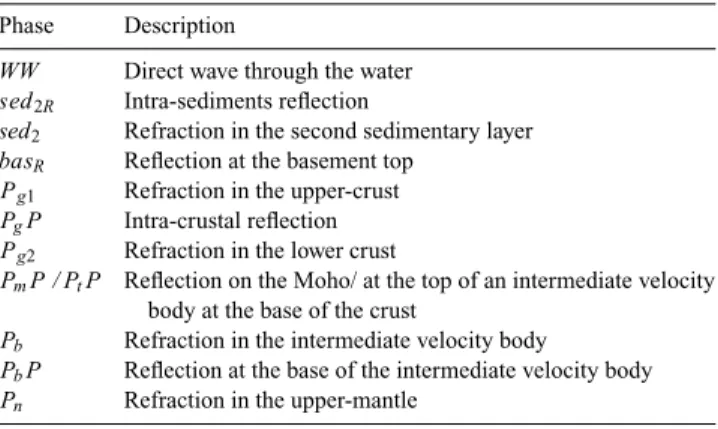
Table 1. Glossary of seismic phases.
Phase Description
WW Direct wave through the water
sed2R Intra-sediments reflection
sed2 Refraction in the second sedimentary layer
basR Reflection at the basement top
Pg1 Refraction in the upper-crust
PgP Intra-crustal reflection
Pg2 Refraction in the lower crust
PmP / PtP Reflection on the Moho/ at the top of an intermediate velocity
body at the base of the crust
Pb Refraction in the intermediate velocity body
PbP Reflection at the base of the intermediate velocity body
Pn Refraction in the upper-mantle
Table 2. Modelling statistics for each wide-angle seismic lines (N ,
number of observations to which rays were successfully traced, and RMS is the root mean square misfit between picked and synthetic traveltimes.) Line N RMS (s) χ2 ENCR01 1978 0.137 1.703 ENCR02 4964 0.123 1.358 ENCR04 2493 0.063 2.509 ENCR05 2638 0.045 0.876 ENCR07 2796 0.102 1.195 ENCR09 4173 0.123 3.504
reflection in the MCS, the passage from syn-rift to syn-OCT/post-rift sediments (U1 and U2-5, Figs 6 and 7).
The bottom of these syn-to-post rift sediments is the top of the acoustic basement imaged by MCS lines (Autin et al. 2010). Top
Figure 4. P-wave velocity models of across strike lines of the margin (ENCR01, ENCR02 and ENCR04 profiles). The mini-map shows the location of these 3
shots-lines. The upper panel is free-air gravity measured (black crosses) and modelled (red lines). In the lower panel, velocities are showed using a colour scale. The colours are saturated in areas effectively crossed by seismic rays. Purple to blue colours are typical velocities for sediments, green to yellow layers are likely the crust (continental as well as oceanic). Orange layer (ENCR02, and 04) velocities are neither typical crustal velocities nor upper-mantle velocities), and orange to red colours are typical of the upper-mantle. Thin continuous black lines are model interfaces. Thick black segments are the portions of interface effectively hit by wide-angle reflections. Dashed lines are isovelocity lines every 1 km s−1, up to 6 km s−1, and every 0.5 km s−1above. Black numbers within layers are representative velocity values. Blue values on white labels are layers densities (in kg m−3). Gravity modelling provide extra constrains on the structures of the velocity models where there is no WAS coverage. OBS and landstations are shown by red circles at the surface. The instruments (OBS and landstations) are labelled only if used in the WAS modelling. Vertical grey dashed lines indicates intersections with other profiles. All models are presented at the same scale (vertical exaggeration: 2.67).
C
Crustal structure of the NE Gulf of Aden 581
Figure 5. P-wave velocity models for along strike lines (ENCR05, ENCR07 and ENCR09 profiles). Same comments as in the caption of Fig. 4.
of the acoustic basement imaged here corresponds to pre-rift/syn-rift interface in continental domain and L1/L2 interface in oceanic domain.
4.1.2 Upper and lower acoustic basements
The top of the acoustic basement corresponds to a major velocity jump seen on all WAS records (from 4.2 to 5.5 km s−1in the conti-nental domain and from 2.2–4 to 4.5 km s−1in the oceanic domain). The velocity below is significantly higher than the faster sediments. In the WAS, the middle crust interface shape the acoustic base-ment top. In the MCS, several structural highs shape the top of the crust, both in the continental slope and in the transitional domain (Fig. 6). The highs have a strong signature in the shape of all the refracted Pg1and Pg2phases (Fig. 8). The velocity of the volcano
edifice (5.5 km s−1, Fig. 4) is slightly higher than the surrounding (5 km s−1). Note that velocities observed in the volcano are com-patible with common volcanic structures (e.g. Klingelhoefer et al. 2001; Lizarralde et al. 2002).
The transition between continental and oceanic crusts appears gradually on the velocity models. The oceanward limit of the OCT is not a bias from the OBS positions. Indeed, it is determined by the identification of the A5d magnetic anomaly which is totally
independent. More OBS were planned to be deployed oceanward, but some technical issues did not allow these deployments. Thus we chose to keep a lot of OBS on the margin to have a better reso-lution there. However, the structure of the oceanic crust is imaged with some rays traced in the oceanic domain (over 10 to 40 km distance for all models showing oceanic crust, see bright areas on Figs 4 and 5, profiles ENCR01, 02, 04 and 05) and gravity mod-elling. Along the continental slope, the velocity below the top of basement interface is commonly 5 to 5.5 km s−1whereas it is not higher than 4.5 km s−1oceanward (Figs 4 and 5). This variation is correlated with the contrasted nature of the crust in the oceanic and continental domains (respectively assumed as oceanic layer 2; L2; and pre-rift sediments). Indeed, oceanic layer 2 is known to have
P-wave velocities ranging from 3.25 to 6.25 km s−1for a context of slow spreading ridge (Atlantic Carlson & Raskin 1984) whereas limestones can show velocities up to 6.1 km s−1, depending on the compaction (Gaviglio 1989). Pre-rift sediments in the Gulf of Aden are known to be mostly Cretaceous to Lower Tertiary limestone (e.g. Roger et al. 1989; Brannan et al. 1997). Thus, the pre-rift sediments are probably strongly compacted, showing a high P-wave velocity (5.5 km s−1) which can be higher than the oceanic L2 ve-locity. Locally in the transition zone, the upper-crust velocity can be even lower (cf. ENCR01 at 34 km, Fig. 4). Reflected as well as refracted events differentiate a lower crust oceanward, in which
Figure 6. Comparison of MCS and wide-angle data along the coincident profile. Upper panel: ENC32 MCS profile and its interpretations. U1 are syn-rift
sediments unit, U2 are syn-oct sediments unit and U3 and U4-5 are post rift-sediments units defined by Autin et al. (2010). Lower panels: wide-angle seismic coincident line ENCR01 recorded by OBS 10 (top) and landstation MUG (bottom). The map on the right-hand side shows the location of the profile, as well as the two stations for which records are shown below (orange area is the extent of the OCT, cf. Fig. 2).
the velocity is higher than 6 km s−1(ENCR01, 02, 04 and 05). The velocity in the lower crust shows a bimodal distribution: the veloci-ties are significantly higher in the oceanic and transitional domains (>6.5 km s−1) whereas the lower continental crust is characterized by lower velocities (∼6 km s−1). This oceanward velocity increase
in the deep crust appears to be relatively sharp for ENCR01 and 02 (over less than 20 km) and more progressive along ENCR04 (Fig. 4).
The depth of the interface between the upper and lower crusts is approximately 5 km in the OCT and oceanic domains; it is well constrained by wide-angle reflections on ENCR04 and 05 (Figs 4
and 5). Continentward, these reflections and refractions vanish. The wide-angle seismic data do not support any velocity jump, differ-entiating a faster lower unit. Accordingly, the velocity is set contin-uous across this interface. This ghost interface is used to ascribe a stronger velocity gradient in the upper continental crust where fast events are observed at near-offset (Fig. 4, ENCR02 velocity model, below the continental slope). Wide-angle reflections constrain the thickness of the continental crust to 35 km (Fig. 4, ENCR02).
The oceanic crust (oceanward the A5d magnetic anomaly) is characterized by the typical velocity structures of layers 2 and 3 (White et al. 1992). Vertical gradient of upper oceanic crust is
C
Crustal structure of the NE Gulf of Aden 583
Figure 7. Comparison of ENC34 depth-migrated MCS (Autin et al. 2010) and wide-angle on the coincident ENCR02 profile. Blacks lines are line drawings
of the seismic line ENC34 and white lines are ENCR02 model interfaces. The thickest white interface is the WAS top of basement. Colour scale is the same as in Fig. 4.
Figure 8. Upper panel shows a detail of the OBS 14 seismic record
(reduc-tion velocity of 8 km s−1) along ENCR04 shot line and lower panel shows a detail of the coincident velocity model. Note the expression of the basement relief on the apparent velocities on the seismic section. Colour scale is the same as Fig. 4.
about 0.5 to 1 s−1 while lower oceanic crust one is only 0.1 to 0.2 s−1, which is typical from oceanic layers 2 and 3 (0.65 s−1for L2 and 0.18 s−1for L3; White et al. 1992). The oceanic lower crust thickness is thinner along ENCR02 and 04 (3 to 3.5 km, half the thickness of ENCR01 oceanic lower crust).
4.1.3 Lower crustal intermediate velocity body
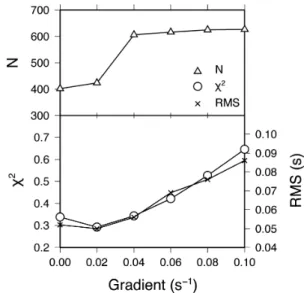
A striking feature of the deep velocity structure along ENCR02, 04 and 05 is the presence of a double reflector encapsulating a 7.6–7.8 km s−1 body below the transitional domain. Fig. 3 is the record of ENCR05 by OBS 06, showing the reflected and refracted phases constraining this intermediate velocity body. The choice of the vertical velocity gradient in this structure is led by an analysis of the statistics for models testing this parameter (Fig. 9). The velocity in the upper part of this structure is set by the interpretations of the Pb refracted phase. The shape of the interface at the base of
this body is determined by the interpretation of the PbP
wide-angle reflections and the testing of the velocities at its base. This
Figure 9. Analysis of modelling statistics (N , χ2and RMS) for ray tracing
for the phases Pband PbP, i.e. in the intermediate velocity/density body, as
a function of the velocity gradient in this structure. Note that the number of rays traced is higher for a velocity gradient of 0.04 s−1, with low values of
χ2and RMS.
double reflector and the seismic rays constraining it are shown in greater details in Figs 10 and 11 and data are shown in Fig. 12. This body reaches a thickness of more than 5 km below the volcano. It is important to note that the thicker oceanic crust found along ENCR01 is compatible with the presence of this intermediate body: no internal reflection is observed along this line, but the line is unfortunately not long enough oceanward to provide the proper offsets. The thickening of the crust and the intermediate body are indeed observed below OBS 17 on ENCR05, at the intersection with ENCR01 (Figs 4 and 5). This suggests the presence of the intermediate body below the OCT and oceanic domains on the ENCR01 profile.
4.1.4 Moho and upper mantle
Numerous PmP phases constrain the base of the crust interface
be-low the continental slope and the transitional domain (thick black segments of interfaces on Figs 4 and 5). The layer below is charac-terized by velocities close to 8 km s−1, suggesting that the mantle
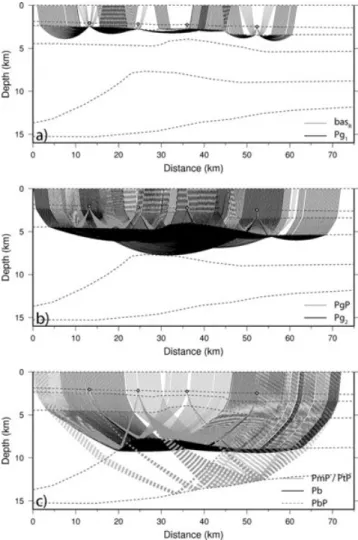
Figure 10. (a) Ray coverage of the upper crust along ENCR04 (every second
ray). (b) Same as (a) but for the lower crust. (c) Same as (a) but for the high-velocity lower crust or low-high-velocity upper mantle body and upper mantle layer.
is reached. On profiles ENCR01, 02, 07 and 09, mantle velocities are uniformly low, with values ranging from 7.8 to 7.9 km s−1. The relatively low values for the expected mantle are constrained by Pn
phases expending on a wide range of offsets and along independent directions.
4.2 Models resolution
Theχ2and RMS parameters provide a first quantitative information
on the ability of the velocity model to account for the interpretation of the traveltimes (Tables 2 and A1). Further, the fits between picked and synthetic traveltimes give a qualitative information (Fig. A1).
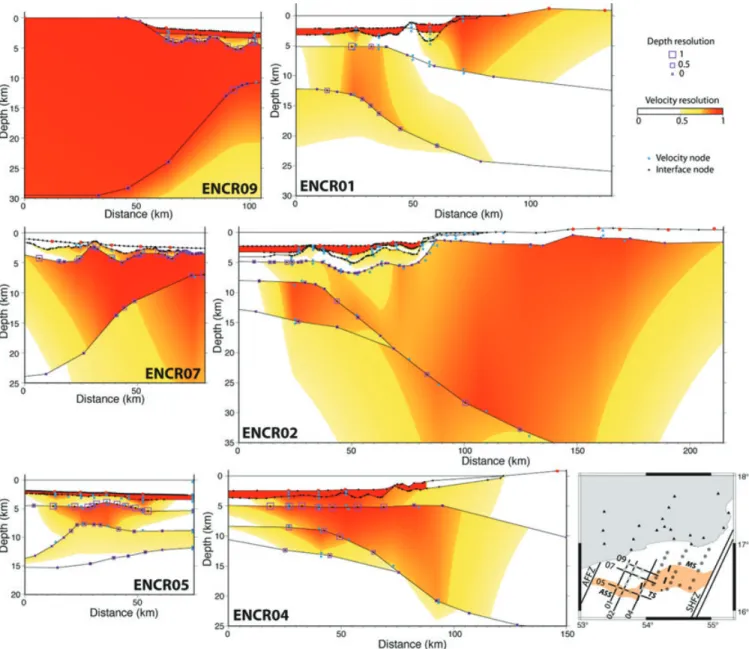
Ray coverage highlights areas densely crossed by seismic rays and unconstrained areas (Figs 10 and 11). One checks that the features of the velocity models are supported by numerous rays of different OBS, with different offsets, providing the appropriate redundancy. Further, the quality of the velocity model can be estimated using the resolution parameter (Zelt & Smith 1992). Fig. 13 shows the diagonal value of the resolution matrix for all velocity nodes. It is an estimate of the number of rays constraining the considered velocity node; it is therefore dependant on node density. The resolution varies from 0 to 1; a value higher than 0.5 is considered as a good resolution. As post-rift sediments were picked on coincident MCS
Figure 11. Same as Fig. 10 but for ENCR05.
for all profiles except ENCR07, resolution for this layer is arbitrarily set to 1. Crustal layers are generally well resolved, as well as the intermediate body (Fig. 13). With a total of 1592 rays refracted in the intermediate body and 590 rays reflected at its base, this structure is well constrained.
A low resolution is observed in the basement high along ENCR01 (in Fig. 4 abscissa 54 km and over the basement high observed in MCS data, Fig. 6). This basement high corresponds to a shadow zone in the WAS data, possibly resulting from a highly tectonised unit (Fig. 6) where seismic energy is diffracted. This shadow zone is only observed on this high of basement on ENCR01 and not obvious on the eastward continuation of the high (ENCR02 and 04). This may be due to the fact that the high of basement is covered by sediments on ENCR02 and 04 and not in the profile ENCR01. Seismic energy may be diffracted where the impedance contrast is too high.
The resolution in the crust along profiles ENCR07 and 09 is good thanks to the limited number of velocity nodes involved (more ve-locity nodes do not improve significantly the data fit). Furthermore, the velocity in the continental crust is apparently well resolved but only constrained by shots in one direction, as there were no shots fired on land.
The fit of the velocities and depth of interfaces at the intersection of cross-cutting profiles is almost always good. The misfit between interfaces is usually lower than 1 km.
C
Crustal structure of the NE Gulf of Aden 585
Figure 12. Upper panel: OBS 06 record section on ENCR05 shot line. IB:
intermediate velocity body reflections. Lower panel: Ray tracing diagram for top of the intermediate body reflections, refractions in the intermediate body and reflections on the base of the intermediate body.
4.3 Density distribution
With a misfit generally lower than 20 mGal, the observed and com-puted gravity anomalies are in reasonable agreement without any
ad-hoc density adjustment in the crust. Local gravity highs closely
match the basement highs, showing that the main source for the short wavelengths originates in the top of the basement topography (Figs 4 and 5), suggesting that the mere velocity–density conversion law of Ludwig et al. (1970) is appropriated in the crustal layers. Longer wavelengths mainly correlate to the crust/mantle interface structure. The densities have been hand-edited below the crust to improve the fit to the longer wavelengths. An overall value of 3100–3250 kg m−3 gives the best fit, with a density as low as 2900–3000 kg m−3in the intermediate velocity body (Figs 4 and 5). Thus, both velocity and density in the mantle of the OCT area are found lower than the com-monly observed values (respectively 8 km s−1 and 3300 kg m−3). However, the modelling of gravity anomaly suggests that the mantle density tends to increase to 3300 kg m−3continentward, beyond the seismic lines.
5 D I S C U S S I O N
5.1 The intermediate velocity/density body at the crust–mantle interface
Structures with velocities ranging from 7.2 to 8 km s−1 are fre-quently observed below passive continental margins and are related to various geodynamical contexts. (1) On magma-poor rifted mar-gins, this intermediate velocity layer can be more than 5 km thick and extend up to 200 km below the thinned continental crust and oceanic crust (Lau et al. 2006). Drilling demonstrated the partially serpentinised nature of continental and oceanic mantle, likely
re-sulting from the fracturation and seawater percolation (e.g. Boillot
et al. 1989; Cannat 1993; Beslier et al. 1996). Laboratory
exper-iments show that 10 per cent serpentinised mantle may result in a P-wave velocity as slow as 7.5 km s−1 (Horen et al. 1996). The entire crust becoming brittle for stretching factors ranging between 3 and 5, seawater may penetrate into depth along the faults and serpentinise the upper-mantle (P´erez-Gussiny´e & Reston 2001). (2) On the opposite, volcanic margins commonly feature an intermedi-ate velocity body. They are usually interpreted as underplating of mafic rocks trapped at the base of the crust, but no direct evidence of igneous materials could confirm this statement so far (e.g. Geoffroy 2005).
Table 3 gathers some physical characteristics of intermediate velocity structures observed on various margins. It suggests that the vertical velocity gradient may be relevant to discriminate between serpentinised upper-mantle versus mafic body. Gradients higher than 0.08 s−1 are typical serpentinite, while gradients lower than 0.05 s−1may characterize mafic body. Moreover, mafic bodies cor-relate with greatest thicknesses. According to the few examples shown in Table 3, 5 to 6 km could be the threshold value. The inter-mediate velocity body observed in the study area shows a maximum thickness of 5 km for velocities ranging from 7.6 to 7.8 km s−1; it leads to a vertical velocity gradient of 0.04 s−1, which supports the mafic body hypothesis.
Furthermore, Minshull (2009) compiles the WAS studies on mar-gins, pointing out the differences in terms of seismic velocity: the serpentinised mantle thickness is restricted to ca. 6 km by ther-mal conditions, whereas the underplated bodies can be thicker. The seismic crust above the serpentinised mantle is slow and thin, while the crust above the underplating is generally thick and faster than the continental crust. Eventually, the underplated body is expected to exhibit a double reflector in the wide-angle records, related to the velocity jumps at the top and bottom of the mafic body (abrupt changes in the mineralogy). Minshull et al. (2008) also suggests that the double reflector should not be observed at partially serpentinised mantle margin because the velocity contrast at the crust–mantle in-terface is attenuated and the serpentinisation rate is expected to decrease progressively downward, providing no abrupt change in the physical properties. However, a double reflector has been ob-served in some supposed serpentinised upper-mantle (Table 3, Reid 1994; Chian et al. 1995; Funck et al. 2004). Velocity models along these profiles show a velocity jump at the base of these bodies, implying abrupt changes in mineralogies. This may result from the sealing of faults, due to the increase of volume associated to the serpentinisation process (e.g. Schroeder et al. 2002).
In our study, a double reflector is clearly identified along several profiles, encapsulating the intermediate velocity body, featuring a low velocity gradient and a thickness of approximately 5 km. The double reflector together with the low velocity gradient, promotes the mafic body interpretation.
Three ways to produce igneous material at the base of the crust are possible: (1) high initial asthenospheric temperatures cause in-trusions in the lower crust and volcanic activity at the surface during the thinning of the lithosphere (e.g. White et al. 1987; Morgan et al. 1989; Barton & White 1997; Funck et al. 2008), (2) magma pound-ing due to adiabatic decompression of asthenosphere beneath the stretched lithosphere, the material rises to the surface at the time of the final continental rupture (e.g. Keen 1987; Morgan et al. 1989), or (3) small scale convection cells induced by high temperature gradi-ent and enhanced by the break-up process, adding igneous material to the oceanic crust (e.g. Mutter et al. 1988; Morgan et al. 1989; Holbrook et al. 1994a,b; Bauer et al. 2000).
Figure 13. Resolution diagrams for the six velocity models. Resolution of velocity nodes is shown by the white to red colour-scale. Orange to red gradation
areas are considered very well resolved (resolution between 0.75 and 1) and yellow areas (resolution between 0.5 and 0.75), well resolved. Resolution of the depth for each interface nodes is shown by the purple squares. The larger is the square, the better is the resolution. Velocity and interface nodes are highlighted by blue circles and black dots, respectively. Red circles correspond to OBS and land-seismometers positions.
The volcano at the intersection of ENCR02 and 05 is located above the thickest part of the intermediate velocity body. It is there-fore sensible to relate the volcano to this structure. Autin et al. (2010) show that volcanism occur just after the emplacement of the OCT basement and the post-rift sediments. We show here wide-angle reflections both at the top and bottom of this structure beneath the OCT crust and the earliest oceanic domain. Thus, as in the Autin
et al. (2010) paper, the extent of the intermediate body underneath
the oceanic and transitional crusts suggests that its emplacement is late or goes on immediately after the onset of oceanic accretion.
A discussion often concerns whether the mafic body is trapped at the base of the crust for rheological or density reasons, or if it in-trudes the lower crust as sills (Funck et al. 2008). The observations of the post-rift sediments recorded by the MCS (Autin et al. 2010, see Fig. 7 for location) shows a post-rift magmatic activity, with a post-rift growth of an OCT ridge. Thus, the volcanic structure is early post-rift to post-rift, as corroborated by Lucazeau et al. (2009)
and Autin et al. (2010). Ashawq–Salalah segment is close to the ma-jor Alula–Fartak fracture zone that separates thick continental crust in the West from the distal margins of the Ashawq–Salalah segment. Gregg et al. (2007) suggest that fracture zones along ridges may increase thermal anomalies by small-scale convection. Moreover, observations on bathymetry, gravity and magnetism suggest the presence of melting anomaly located in this segment (d’Acremont
et al. 2010) that shows typical characteristics of plume-ridge
in-teraction (Leroy et al. 2010a). In summary, the intermediate body may be interpreted as underplated body coming from a small-scale convection processes due to edge effect of the continental margin on Alula–Fartak fracture zone, or from channelling plume-ridge in-teraction (Leroy et al. 2010a) as early as the beginning of seafloor spreading, or from both. The body maximum thickness is approxi-mately 5 km, which is lower than the thicknesses of typical syn-rift underplated bodies observed along volcanic margins (Table 3). Fur-thermore, this underplated magma may partly intrude the lower
C
Crustal structure of the NE Gulf of Aden 587
Table 3. Comparison of intermediate velocity/density bodies characteristics and natures from various margins. Rows are
sorted by decreasing gradients. T h. is for the the maximum intermediate body thickness, Gr ad. is the the vertical velocity gradient of the structure, S.U.M. is for serpentinised upper-mantle and M.B. is for mafic body. Note that higher velocity gradients are for serpentinised mantle.aindicates that wide-angle reflections are observed at the base of the intermediate
body.
References Location Line VP(km s−1) T h. (km) Gr ad. (s−1) Interpretation
Van Avendonk et al. (2009) Newfoundland Screech-II 5.3–8.1 5 0.560 S.U.M. Lau et al. (2006) Newfoundland Screech-III 6.4–7.8 3 0.460 S.U.M. Chian et al. (1995) Labrador 90R1 6.4–7.7 5 0.260 S.U.M.a
Dean et al. (2000) S.I.A.P. IAM-9 7.3–7.9 3.5 0.171 S.U.M. Reid (1994) Newfoundland Line 7 7.2–7.6 4 0.100 S.U.M.a
Funck et al. (2003) Flemish Cap Screech-I 7.6–8.0 5 0.080 S.U.M. Funck et al. (2004) Nova Scotia Line 1 7.2–7.6 5 0.080 S.U.M.a
Barton & White (1997) Edoras Bank Cam 77 7.2–7.6 8 0.050 M.B. Bauer et al. (2000) Namibia Transect 1 7.6–7.8 7 0.029 M.B.a
Hirsch et al. (2009) SW Africa Springbok 7.0–7.4 16 0.025 M.B.a
Holbrook et al. (1994a) Virginia Line 801 7.1–7.5 18 0.022 M.B.a
Minshull et al. (2008) Arabian Basin Ø 7.4–7.6 11 0.018 M.B.a
Funck et al. (2008) Faroe Islands Line A 7.3–7.4 6 0.017 M.B.a
Morgan et al. (1989) Hatton Bank Ø 7.3–7.4 14 0.007 M.B.
crust during the post-rift as for the syn-rift volcanism observed on volcanic margin (e.g. Geoffroy 2005).
5.2 Thinning of the continental crust
Thinning of the continental crust from 35 to approximately 8 km is accommodated by three or four tilted blocks bounded by normal faults, featuring syn-rift, fan-like deposits within the continental slope (d’Acremont et al. 2005). These tilted blocks are imaged on MCS sections (Autin et al. 2010; Leroy et al. 2010b), WAS and gravity data offshore (Figs 7 and 8) and observed onshore (Fig. 2). Most of the thinning occurs over 50 to 100 km (ENCR01 and ENCR02, respectively, Fig. 14). A margin is defined as hard when the thinning occurs on less than 150 km (Davison 1997; Reston 2009). As the conjugate margin is twice larger and asymmetric (Leroy et al. 2004; d’Acremont et al. 2005, 2006), we may propose that the conjugate is soft, implying an asymmetry in the deep struc-ture, and thus (1) an asymmetric rifting process leading to mantle exhumation (simple shear, Wernicke 1985; Boillot & Froitzheim 2001), or (2) a migration of the rifting location due to slow rifting (Kusznir & Park 1987; Bassi 1995). Table 4 shows the thinning values for some volcanic and non-volcanic passive margins. The higher thinning values for non-volcanic passive margins may be explained by the fact that (1) rifting processes are hotter along vol-canic margins, implying that less thinning is needed to break the continental lithosphere (Hopper & Buck 1996; Buck 2004) and (2) some igneous material is brought to the base of the crust, leading to a thickening of the crust and a lower apparent thinning value.
For this study, theβ factors are calculated from the Tiberi et al. (2007) maximum on land crustal thickness value (36.6 km) and the crustal thicknesses calculated from WAS. Crustal thicknesses are the differences between the top of the acoustic basement and the base of the crust, intermediate body excluded (as it is a post-rift structure, added after the thinning process). The maximum thinning factors (at the OCT boundary) are 3.2 for ENCR01 (minimum value as the intermediate body is not defined on this profile), 5.3 for ENCR02 and 4.8 for ENCR04. These later values are maximum values, as the intermediate body may partly intrude the lower crust. Crustal thinning is thereby particularly abrupt which is characteristic of magma-poor margins (Table 4). Thinning values along this margin range from 3.2 to 5.3, allowing the crust to become totally brittle and
thus serpentinisation to reach the upper-mantle (P´erez-Gussiny´e & Reston 2001).
Thus, β factor values indicate a magma-poor margin context with potentially serpentinised upper-mantle. Autin et al. (2010) propose that the late volcanic activity may has erased the evidences of serpentinisation that could explain why we observe no evidence of serpentinised upper-mantle on the data: no S-reflector on the MCS, no high velocity gradient on WAS, and no serpentinisation-related magnetic anomaly (Leroy et al. 2010b).
5.3 Thickness of the oceanic crust
Fig. 15 shows representative vertical velocity profiles across the oceanic crust for ENCR01 to 05. Velocity values and gradients are typical of oceanic layers 2 and 3.
Along the 3 across margin profiles, the thickness of the oceanic crust, intermediate body excluded, varies from 10 km maximum in the West (centre of the Ashawq–Salalah segment, ENCR01) to less than 5.5 km on the East (in the Ashawq–Salalah segment and close to the Ashawq-Salalah/Taqah segment boundary, ENCR02 and 04) over a distance of ca. 10 km (ENCR05). The thickness variation affects both the lower crust and the upper crust, but most of the increase is accounted by the lower crust.
Previous WAS studies including data from worldwide normal oceanic crust (away from fracture zones or hotspot influences) show a mean thickness of 7.1± 0.8 km and extreme values of about 5.0 and 8.5 km for slow spreading rates (lower than 20 mm yr−1, White et al. 1992; Bown & White 1994). The oceanic crust mean thickness is about 10.3± 1.7 km where upper mantle is hotter than normal and it can reach values higher than 20 km where the ridge interacts with a hotspot (White et al. 1992). The oceanic crust produced at volcanic passive margin is significantly thicker than 7 km (e.g. Morgan et al. 1989; Eldholm & Grue 1994; Barton & White 1997; Bauer et al. 2000). At smaller scale, the crust produced at the mid-oceanic ridges shows variable thickness. In the vicinity of ridge axis discontinuities, the oceanic crust is thinner, whereas the centre of segments usually shows the thickest crust (Rommevaux
et al. 1994). Actually, the lower the spreading rate, the higher the
variation of the crustal thickness (Salisbury & Christensen 1978; Bown & White 1994).
Figure 14. Top panel shows β factors calculated as the ratio maxCC/CT h with CTh the final crustal thickness and maxCCthe maximum crustal thickness
inferred by receiver functions (36.6 km, Tiberi et al. 2007). Curves areβ factors excluding the intermediate velocity/density body of the crust thickness. The three lower panels are models interfaces. Bold interfaces are used for estimating crustal thickness. Dotted lines correspond to ENCR01, continuous lines to ENCR02 and dashed lines to ENCR04. This code is the same for the whole figure. The ‘0’ distance value is constrained by the continentward OCT boundary (Autin et al. 2010; Leroy et al. 2010b).
Table 4. Comparison ofβ factors from various margins. Rows are sorted by decreasing β factors. N.V. and V. is for non-volcanic and volcanic margins, respectively. Note that higherβ factors are for
non-volcanic margins.
References Location Line β factors Margin type Van Avendonk et al. (2009) Newfoundland Screech-II 10 N.V. Funck et al. (2004) Nova Scotia Line 1 5.5 N.V. Contrucci et al. (2004) NW Morocco Sismar profile 4 5 N.V.
Reid (1994) Newfoundland Line 7 5 N.V.
Bullock & Minshull (2005) Goban Spur WAM 4.5 N.V. Lau et al. (2006) Newfoundland Screech-III 4.3 N.V. Dean et al. (2000) S.I.A.P. IAM-9 4 N.V. Klingelhoefer et al. (2009) SW Morocco Dakhla North profile 3.4 N.V. Raum et al. (2002) Vøring Basin Transect1 2.9 V. Bauer et al. (2000) Namibia Transect 1 2.6 V. Morgan et al. (1989) Hatton Bank Ø 1.8 V. Hirsch et al. (2009) SW Africa Springbok 1.8 V. Hopper et al. (2003) SE Greenland Sigma-III 1.6 V. Barton & White (1997) Edoras Bank Cam 77 1.6 V.
C
Crustal structure of the NE Gulf of Aden 589
Figure 15. Velocity-depth profiles in the oceanic domain for ENCR01, 02,
04 and 05. As a comparison, the grey envelop marks the region enclosed by the highest and lowest values from the velocity-depth plots for a Pacific oceanic crust of about the same age (White et al. 1992, Fig. 5, Step 3–15 Ma). Velocity-depth profiles location is shown by red stars on the simplified trackmap.
The 10 km thick crust of ENCR01 could result from the formation of oceanic crust along a volcanic margin but a fraction of its thick-ness may be due to the presence of the thin underplated intermediate body. The decrease in the crustal thickness from west to east may be related (1) to the presence of a second-order discontinuity of the paleo-spreading axis in the vicinity of ENCR04 profile (Leroy et al. 2010b) and/or (2) to the melting anomaly observed apart from the present-day spreading axis, showing thicker-than-normal crust and off-axis volcanic activity in this ridge segment (d’Acremont et al. 2010). That could be related to plume-ridge interaction from the Afar plume along Aden-Sheba ridges system (Leroy et al. 2010a). 5.4 Nature of the transitional crust
Comparison of all profiles shows that both continental and oceanic domains are homogeneous along strike. These contrasted domains are separated by a transitional domain also identified though MCS, gravity and magnetism (Autin et al. 2010; Leroy et al. 2010b). The velocity models of the transitional domain feature (1) a blocky
top-basement interface, similar to the one along the continental slope, and (2) a crustal velocity higher than in the continental domain. The velocities in the transition domain appear to be quite similar to the oceanic velocities and the two layers of the oceanic crust extend continentward until the continental crust is reached. The oceanward boundary of the OCT simply coincides with slick-to-rough transition of the top-basement, corresponding to the oldest seafloor spreading magnetic anomaly and to a ‘flat’ free-air gravity anomaly (Figs 4 and 5). However, the continental transition occurs through a strong horizontal velocity gradient, coincident with the abrupt deepening of the base of the crust. The velocity increase associated to the end of the thinning of the crust is a margin feature of all across strike profiles.
Thus, the OCT described in this study is a 15 km narrow stripe which compares better with the OCT width along volcanic margins (e.g. Barton & White 1997; Mjelde et al. 2007). However, the surface evidences of a high magmatic supply are subdued, compared to proven volcanic margins (oceanic crust thickness is lower than on volcanic margins and no SDR sequence is observed). Moreover, the continentward tip of the SDR wedge usually coincides with the further extent of the continental crust (Eldholm & Grue 1994; Planke et al. 1999; Bauer et al. 2000) whereas along ENCR02 profile the thin volcano-sedimentary edifice rather locates at the transition from the OCT and the oceanic domain (Fig. 7). As the thinning of the continental crust is large enough to cause mantle serpentinisation and as WAS data show no high velocity gradient in the OCT which may be a proof for upper-mantle serpentinisation, we propose that the OCT may be partly serpentinised mantle that was modified by later thermal event.
5.5 Low velocity/density upper-mantle
Low velocity/density upper-mantle is commonly observed on pas-sive margins (P-wave velocities from 7.7 to 8 km s−1and densities of 3200 kg m−3; P´erez-Gussiny´e et al. 2003; Fern`andez et al. 2004; Bullock & Minshull 2005; Lau et al. 2006). Mantle serpentinisation (Lau et al. 2006) or the presence of a thermal anomaly (Fern`andez
et al. 2004) may explain these values. Lucazeau et al. (2008) showed
that the eastern Gulf of Aden sustains a post-rift thermal anomaly persisting up to now: high heat-flow values are measured in ad-joining segment of this margin by small-scale convection occur-ring duoccur-ring and after the rifting beneath the continental slope. The low velocity/density mantle observed here is in agreement with the presence of the post-rift thermal anomaly and consistent with the presence of the mafic body.
6 C O N C L U S I O N S
Modelling of the wide-angle data along the Ashawq–Salalah seg-ment, north-eastern Gulf of Aden, constrain the crustal structure of the margin, from continental to oceanic domain.
Our main observations are:
(1) The thinning of the continental crust occurs over distances ranging from 50 to 100 km with thinning factors varying from 3.2 to 5.3. Such values suggest that the crust becomes entirely brittle during the end of the rifting with possible mantle serpentinisation according to Autin et al. (2010).
(2) The oceanic crust, intermediate body excluded, shows a dras-tic thickening along the margin possibly related to a variable magma supply along the slow spreading ridge and at the ridge centre, due to the paleo-ridge segmentation.
(3) A narrow OCT domain, approximately 15 km wide, exhibit-ing a post-rift volcanic activity, separates the thinned continental domain from the oceanic one.
(4) An intermediate velocity body at the base of the OCT and oceanic crusts, featuring a clear double reflector and a low vertical velocity gradient, interpreted as a post-rift mafic body probably related to the volcanic activity of the Ashawq–Salalah segment.
Thus, this margin shows some characteristic features observed on volcanic margins (volcano, mafic body) but these features seems to be post-rift events. Indeed, the volcano is located in the OCT, the mafic body double reflections are observed below the oceanic crust and its thickness is really lower than mafic body thicknesses observed at volcanic margins. So, the emplacement of this body is probably a post-rift event on a margin affected by few post-rift magmatism.
We conclude that this non-volcanic passive margin, characterised by a post-rift mafic body at the base of the crust and a volcano, is affected by a post-rift thermal anomaly. This thermal anomaly may have erased the WAS observation of serpentinisation that could be observed on non-volcanic passive margins.
A C K N O W L E D G M E N T S
This project was funded by the GDRMarges; ‘Actions Marges’ and ANR YOCMAL projects. The data were acquired thanks to GDRMarges, INSU and Total funds. We deeply thank the of-ficers and crew of R/V L’Atalante (Ifremer/Genavir) and the G´eosciences-Azur ‘OBS-Team’: Yann Hello, Olivier Desprez and Alain Anglade for their implication in the wide-angle seismic data acquisition. We would like to thank Royal Holloway University of London, NERC/SEIS-UK and Sultan Qaboos University (Sultanate of Oman) who lent the landstations for the Encens cruise. We are grateful for Dr Hilal Al-Azri, Dr Salim Al Busaidi and Sami Zubedi for logistical support in Oman. Seismic-Unix (Stockwell 1997) and OBSTOOL (Christeson 1995) were used to process the wide-angle seismic data. The GMT software package (Wessel & Smith 1995) was used to produce the figures of this paper. We give a lot of thanks to Marie-Odile Beslier who spent some time to do comments which have contributed to improve this study. We thank Karsten Gohl, Philippe Charvis and Ingo Grevenmeyer for constructive reviews and comments.
R E F E R E N C E S
Autin, J., Leroy, S., d’Acremont, E., Beslier, M.-O., Ribodetti, A., Bellahsen, N., Razin, P. & Robin, C., 2010. Continental break-up history of a deep magma-poor margin from seismic reflection data (northeastern Gulf of Aden margin, offshore Oman), Geophys. J. Int., 180, 501–519. Avedik, F., Renard, V., Allenou, J. & Morvan, B., 1993. Single bubble air-gun
array for deep exploration, Geophysics, 58, 366–382.
Barton, A. & White, R., 1997. Crustal structure of Edoras Bank continen-tal margin and mantle thermal anomalies beneath the North Atlantic, J.
geophys. Res., 102(B2), 3109–3129.
Bassi, G., 1995. Relative importance of strain rate and rheology for the mode of continental extension, Geophys. J. Int., 122(1), 195–210.
Basuyau, C., Tiberi, C., Leroy, S., Stuart, G., Al-Lazki, A.I., Al-Toubi, K. & Ebinger, C., 2010. Evidence of partial melting beneath a continental margin: case of Dhofar, in the Northern Gulf of Aden (Sultanate of Oman)., Geophys. J. Int, 180, 520–534.
Bauer, K. et al., 2000. Deep structure of the Namibia continental margin as derived from integrated geophysical studies, J. geophys. Res., 105(B 11), 25 829–25 853.
Bellahsen, N., Fournier, M., d’Acremont, E., Leroy, S. & Daniel, J.-M., 2006. Fault reactivation and rift localization: the northeastern Gulf of Aden margin., Tectonics, 25, TC1007, doi:10.1029/2004TC001626. Beslier, M., Cornen, G. & Girardeau, J., 1996. Tectono-metamorphic
evo-lution of peridotites from the ocean/continent transition of the Iberia Abyssal Plain margin, Proceedings of ODP, 149, 397–412.
Bevington, P., 1969. Data Reduction and Error Analysisfor the Physical
Sciences, Vol. 13, pp. 985–993, McGraw-Hill, New York.
Boillot, G. & Froitzheim, N., 2001. Non-volcanic rifted margins, continental break-up and the onset of sea-floor spreading: some outstanding questions,
Geol. Soc. Lond. Spec. Publ., 187(1), 9–30.
Boillot, G., Fraud, G., Recq, M. & Girardeau, J., 1989. Undercrusting by serpentinite beneath rifted margins., Nature, 341, 523–525.
Bott, W.F., Smith, B.A., Oakes, G., Sikander, A.H. & Ibrahim, A.I., 1992. The tectonic framework and regional hydrocarbon, prospectivity of the Gulf of Aden, J. Petrol. Geol., 15, 211–243.
Bown, J. & White, R., 1994. Variation with spreading rate of oceanic crustal thickness and geochemistry, Earth; planet. Sci. lett., 121(3-4), 435–449. Brannan, J., Gerdes, K. & Newth, I., 1997. Tectono-stratigraphic develop-ment of the Qamar basin, eastern Yemen, Mar. Pet. Geol., 14(6), 701–730. Brun, J. & Beslier, M., 1996. Mantle exhumation at passive margins, Earth
planet. Sci. Lett., 142(1-2), 161–173.
Buck, W., 2004. Consequences of athenospheric variability on continental rifting, in Rheology and Deformation of the Lithosphere at continental
margins, Vol. 62, pp. 1–30, eds Karner, G., Taylor, B., Driscoll, N. &
Kohlstedt, D., Columbia University Press, New York, NY.
Bullock, A. & Minshull, T., 2005. From continental extension to seafloor spreading: crustal structure of the Goban Spur rifted margin, southwest of the UK, Geophys. J. Int., 163(2), 527–546.
Cannat, M., 1993. Emplacement of mantle rocks in the seafloor at mid-ocean ridges., J. geophys. Res., 98(B3), 4163–4172.
Cannat, M. et al., 1995. Thin crust, ultramafic exposures, and rugged faulting patterns at the Mid-Atlantic Ridge (22–24 N), Geology, 23(1), 49. Carlson, R. & Raskin, G., 1984. Density of the ocean crust, Nature, 311,
555–558.
Chian, D., Louden, K. & Reid, I., 1995. Crustal structure of the Labrador Sea conjugate margin and implications for the formation of nonvolcanic continental margins, J. geophys. Res., 100(B12), 24 239–24 254. Christeson, G., 1995. OBSTOOL: Software for Processing UTIG OBS Data,
Technical Report, Vol. 134, University of Texas Institute for Geophysics, pp. 1–27.
Contrucci, I., Klingelhofer, F., Perrot, J., Bartolome, R., Gutscher, M., Sa-habi, M., Malod, J. & Rehault, J., 2004. The crustal structure of the NW Moroccan continental margin from wide-angle and reflection seismic data, Geophys. J. Int., 159(1), 117–128.
Davis, M. & Kusznir, N., 2004. Depth-dependent lithospheric stretching at rifted continental margins, in Proceedings of NSF Rifted Margins
Theo-retical Institute. Columbia University Press, New York, pp. 92–136.
Davison, I., 1997. Wide and narrow margins of the Brazilian South Atlantic,
J. Geol. Soc., 154(3), 471–476.
Dean, S., Minshull, T., Whitmarsh, R. & Louden, K., 2000. Deep structure of the ocean-continent transition in the southern Iberia Abyssal Plain from seismic refraction profiles- The IAM-9 transect at 40 deg 20 min N, J.
geophys. Res., 105(B3), 5859–5885.
d’Acremont, E., Leroy, S., Beslier Marie, O., Bellahsen, N., Fournier, M., Robin, C., Maia, M. & Gente, P., 2005. Structure and evolution of the eastern Gulf of Aden conjugate margins from seismic reflection data.,
Geophys. J. Int., 160(3), 869–890.
d’Acremont, E., Leroy, S., Maia, M., Patriat, P., Beslier Marie, O., Bellahsen, N., Fournier, M. & Gente, P., 2006. Structure and evolution of the eastern Gulf of Aden; insights from magnetic and gravity data (Encens-Sheba MD117 cruise), Geophys. J. Int., 165(3), 786–803.
d’Acremont, E., Leroy, S., Maia, M., Gente, P. & Autin, J., 2010. Volcanism, jump and propagation on the Sheba Ridge, eastern Gulf of Aden: seg-mentation evolution and implications for accretion processes, Geophys.
J. Int., 180, 535–551.
Ebinger, C. & Sleep, N., 1998. Cenozoic magmatism throughout east Africa resulting from impact of a single plume, Nature, 395(6704), 788.
C