HAL Id: hal-01849388
https://hal.archives-ouvertes.fr/hal-01849388
Submitted on 5 Jun 2019
HAL is a multi-disciplinary open access
archive for the deposit and dissemination of
sci-entific research documents, whether they are
pub-lished or not. The documents may come from
teaching and research institutions in France or
abroad, or from public or private research centers.
L’archive ouverte pluridisciplinaire HAL, est
destinée au dépôt et à la diffusion de documents
scientifiques de niveau recherche, publiés ou non,
émanant des établissements d’enseignement et de
recherche français ou étrangers, des laboratoires
publics ou privés.
Comparative transcriptome analysis between original
and evolved recombinant lactose-consuming
Saccharomyces cerevisiae strains
Pedro Guimarães, Véronique Le Berre, Serguei Sokol, Jean François, José
Teixeira, Lucília Domingues
To cite this version:
Pedro Guimarães, Véronique Le Berre, Serguei Sokol, Jean François, José Teixeira, et al..
Com-parative transcriptome analysis between original and evolved recombinant lactose-consuming
Saccha-romyces cerevisiae strains. Biotechnology Journal, Wiley-VCH Verlag, 2008, 3 (12), pp.1591 - 1597.
�10.1002/biot.200800111�. �hal-01849388�
Cheese whey is a highly pollutant by-product of dairy industries that is produced in high amounts [1]. The lactose in whey (about 5%) is interesting as a substrate for the production of a variety of prod-ucts, including bio-ethanol [1]. However, the yeast Saccharomyces cerevisiae, which is most frequently the microorganism of choice for alcoholic fermen-tation bioprocesses, is unable to metabolize lactose, unlike some other yeasts such as Kluyveromyces species.
A recombinant S. cerevisiae flocculent strain that expressed both the LAC4 (β-galactosidase)
and LAC12 (lactose permease) genes of
Kluyveromyces lactis was previously constructed [2]. The original recombinant strain (NCYC869-A3/T1, hereafter referred as T1) metabolized lac-tose slowly and its flocculation performance was poor when compared to the strongly flocculent host strain. Hence, the recombinant T1 was subjected to a long-term evolutionary engineering experiment (previously described; [3]), designed to keep the re-combinant growing in lactose for many genera-tions, as well as to select for flocculent cells. That experiment yielded an evolved recombinant (strain T1-E) that efficiently fermented lactose to ethanol. In lactose cultivations, the evolved strain showed improved growth rate, ethanol productivity and yield, as well as improved flocculation, compared to the original recombinant [3]. At the molecular lev-el, we found two alterations that targeted the LAC
Short Communication
Comparative transcriptome analysis between original and
evolved recombinant lactose-consuming Saccharomyces
cerevisiae strains
Pedro M. R. Guimarães
1, Véronique Le Berre
2,3,4, Serguei Sokol
2,3,4, Jean François
2,3,4, José A. Teixeira
1and
Lucília Domingues
11IBB – Institute for Biotechnology and Bioengineering, Centre of Biological Engineering, Universidade do Minho, Braga, Portugal 2Université de Toulouse, INSA, UPS, INP, LISBP, Toulouse, France
3INRA, UMR792 Ingénierie des Systèmes Biologiques et des Procédés, Toulouse, France 4CNRS, UMR5504, Toulouse, France
The engineering of Saccharomyces cerevisiae strains for lactose utilization has been attempted with the intent of developing high productivity processes for alcoholic fermentation of cheese whey. A recombinant S. cerevisiae flocculent strain that efficiently ferments lactose to ethanol was previ-ously obtained by evolutionary engineering of an original recombinant that displayed poor lactose fermentation performance. We compared the transcriptomes of the original and the evolved re-combinant strains growing in lactose, using cDNA microarrays. Microarray data revealed 173 genes whose expression levels differed more than 1.5-fold. About half of these genes were related to RNA-mediated transposition. We also found genes involved in DNA repair and recombination mechanisms, response to stress, chromatin remodeling, cell cycle control, mitosis regulation, gly-colysis and alcoholic fermentation. These transcriptomic data are in agreement with some of the previously identified physiological and molecular differences between the recombinants, and point to further hypotheses to explain those differences.
Keywords: cDNA microarrays · Evolutionary engineering · Lactose fermentation · Recombinant Saccharomyces cerevisiae
Correspondence: Dr. Lucília Domingues, IBB – Institute for Biotechnology
and Bioengineering, Centre of Biological Engineering, Universidade do Minho, Campus de Gualtar, 4710-057 Braga, Portugal
E-mail: [email protected] Fax: +351-253-678-986
Received 16 May 2008 Revised 15 August 2008 Accepted 24 October 2008
Biotechnology
Journal Biotechnol. J. 2008, 3, 1591–1597
construct in the evolved strain: (1) a 1593-bp dele-tion in the intergenic region (promoter) between LAC4 and LAC12 and (2) the plasmid copy number decreased by about tenfold in T1-E as compared to T1. Our previous results suggest that these two al-terations are related to changes in the transcription of the LAC genes and consequently contributed to the improved lactose fermentation phenotype of T1-E [3].
Systems-wide analyses, such as DNA microar-rays, are valuable tools for integrated strain devel-opment approaches [4, 5]. These tools can be used to study the underlying changes in strains subject-ed to improvement programs. Mapping of differ-ences between strains with different degree of a certain desired phenotype and subsequent identi-fication of factors conferring that phenotype are an essential part of inverse metabolic engineering ap-proaches [6]. Once a strain with desired character-istics is obtained, e.g., by evolutionary engineering strategies [7], it can be characterized using sys-tems-wide tools to elucidate key metabolic path-ways and targets for future rounds of rational metabolic engineering. The identified genes and factors contributing to the desired phenotype can also be introduced into other strains or organisms to achieve a similar phenotype [6].
Here, we discuss the comparison between the global gene expression profiles of the original (T1) and the evolved (T1-E) recombinant strains [3] growing under the same conditions in lactose, us-ing S. cerevisiae cDNA microarrays.
The two yeast strains (T1 and T1-E) were grown in defined mineral medium with 20 g/L lactose as previously described [3]. Harvesting of yeast (at an OD600of 0.5–0.7) and RNA extraction was also done as previously described [3].
The DNA chips were manufactured at the Biochip platform (Genopole Toulouse, France) on dendrislides [8] using 70-mer oligonucleotides, representing 99% of the yeast genome, purchased from Operon. The list of corresponding genes can be found at http://biopuce.insa-toulouse.fr/ oligosets/. Synthesis of fluorescently labeled cDNA was carried out with 5 ng total RNA using the Chip-Shot™ direct labeling system (Promega) and then purified with the ChipShot™ Labeling and Cleanup System. This labeling method allows di-rect incorporation of dCTP-Cy3 or dCTP-Cy5 (Perkin-Elmer) nucleotides during the reverse transcription step. The quality of the labeled cDNA was verified by the NanoDrop® ND-1000 UV-Vis Spectrophotometer. Hybridization was carried out in an automatic hybridation chamber (Discovery™, Ventana). Microarrays were prehybridized in 1% BSA, 2× SSC (300 mM sodium chloride, 30 mM
sodium citrate, pH 7.0), 0.2% SDS for 30 min at 42ºC, followed by prehybridization for 30 min with the Chip Prep 1 reagent (Ventana) then 30 min with the Chip Prep 2 reagent (Ventana) at 42°C. Hybridiza-tion was done by addiHybridiza-tion of a mixture containing 180 µL ChipHybe™ (Ventana), 10 µL Cy3-labeled cDNA and 10 µL Cy5-labeled cDNA.After 8 h of hy-bridization at 42ºC, the DNA chips were washed with the ChipClean (Ventana) solution. Subse-quently the slides were washed manually for 5 min in 2× SSC with 0.1% SDS, then for 2 min in 0.1× SSC buffer at room temperature. Slides were dried with a microarray high-speed centrifuge (ArrayIt). The hybridization signal was detected by scanning the microarrays with a GenePix 4000A laser scanner (Axon Instruments) and quantified using the GenePix Pro 6.0 software. To reduce the bias due to unequal incorporation or differences in quantum efficiency of the two dyes, RNA samples from a sec-ond independent experiment were labeled by op-posite dye to the first experiment (method called dye switch), and this procedure was repeated four times, leading to four independent intensity values for each gene (spots) on the microarray. This ex-perimental design minimizes the intrinsic biologi-cal noise between identibiologi-cal culture conditions and the technical variations inherent to the DNA mi-croarray technology.
Data analysis was performed using the BioPlot web service from the Biochip platform (Genopole Toulouse, France), which enables comparison of the transcriptome data from two biological condi-tions and selection of significantly changed genes. Strain T1 was selected as the control biological con-dition and T1-E as the test concon-dition. Thus, the ex-pression ratios were calculated as T1-E/T1.The av-erages of the log-transformed ratios for the four replicate microarray slides were used for the sta-tistical analysis. Local background correction was applied. Locally weighed linear regression (lowess) analysis was performed for data normalization. Genes with significantly changed expression level were identified by combining ratio thresholds and Student’s test. Overexpression and underexpres-sion thresholds were set to 1.5 and 0.66, respec-tively. Genes with p value lower than 0.05 were con-sidered to be significantly differentially expressed. False discovery rate with this p value cut-off was 0.082, which gave an estimation of 14 false positives (among 173 transcripts with changed expression). Gene descriptions and annotations were found in the Saccharomyces Genome Database, SGD (http://www.yeastgenome.org). The microarray ex-periment data described here have been deposited in the Gene Expression Omnibus of the NCBI [9] and are accessible through GEO series accession
number GSE12433 (http://www.ncbi.nlm.nih.gov/ geo/query/acc.cgi?acc=GSE12433).
The microarray analysis revealed 173 tran-scripts whose levels in T1 and T1-E differed more than 1.5-fold. Most of the overexpressed ORFs identified (80 out of 122) were related with RNA-mediated transposition. Retrotransposons are ubiquitous components of eukaryotic genomes. Kim et al. [10] found 331 yeast transposons (Ty el-ements) insertions throughout the S. cerevisiae genome.Ty transposition is described to be induced naturally under some stress conditions (such as low temperature, UV irradiation or nitrogen starva-tion), and may allow adaptation to an extreme en-vironment by providing an opportunity for genetic modifications [11]. Ty elements have been docu-mented as agents of mutagenesis and as mediators of genome rearrangement through recombination [10, 12, 13]. In particular, these elements are re-sponsible for adaptive mutations in evolving yeast populations [12, 13]. Therefore, it is not surprising to find overexpression of Ty elements genes in T1-E. This was probably a response to the stress con-ditions that the yeast faced during the evolutionary engineering experiment. Moreover, transposition mechanisms may have been involved in adaptive mutations that occurred during the process.
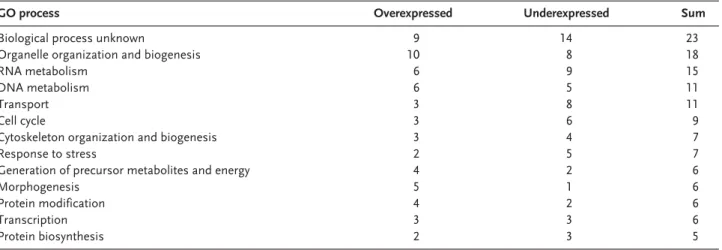
The genes with altered expression were grouped according to Gene Ontology (GO) process terms, using the SGD Gene Ontology Slim Mapper tool (Table 1). Apart from Ty transposition, few dif-ferences were found in the S. cerevisiae genome transcriptional expression between the original and the evolved recombinants. We found 42 genes overexpressed and 51 genes underexpressed more than 1.5-fold in T1-E. From these, 8 and 19 were, respectively, over- and underexpressed more than
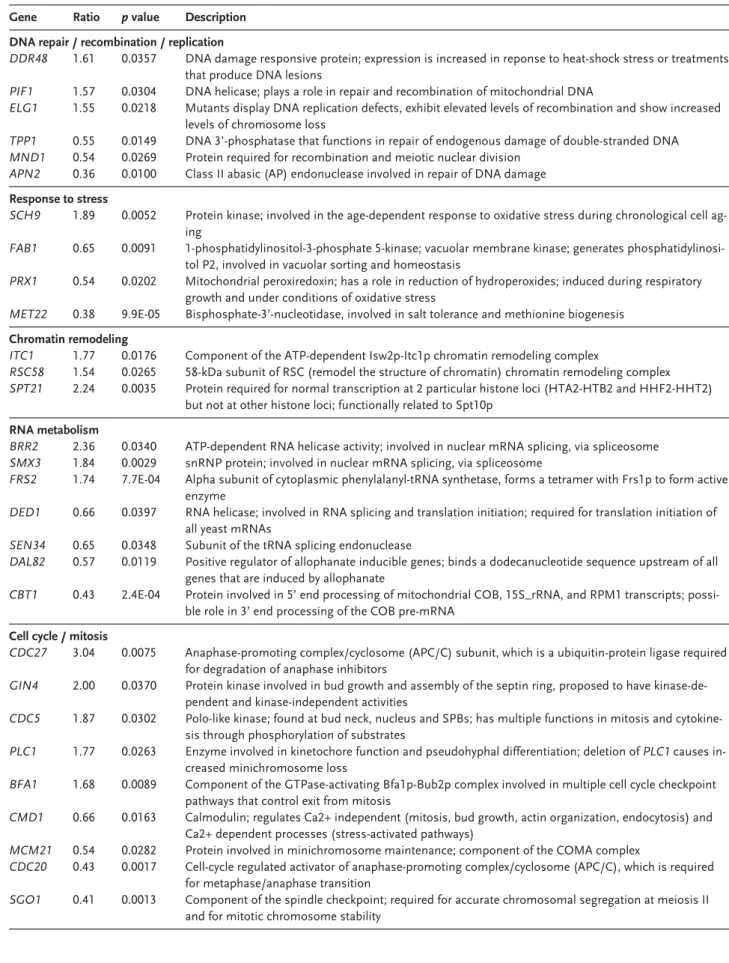
2-fold in T1-E. A fold change above 3 was found for only 2 genes: CDC27 was overexpressed 3-fold, and MDR1 was underexpressed 4-fold in T1-E (Table 2). Among the 93 transcripts with altered ex-pression (>1.5-fold change), 23 currently have un-known biological function. The other genes are as-signed to several distinct GO process terms (Table 1). Based on the analysis of GO trees, we se-lected genes of possible interest to this study with-in the groups with-in Table 1. These genes are listed with-in Table 2 (re-grouped according to common GO process terms).
Several genes with altered expression were found to be involved in DNA repair and recombi-nation mechanisms, which suggests that the re-combinant was exposed to DNA damaging stress during the adaptation.
The differential expression of genes associated with (mini)chromosome stability (ELG1, PLC1, MCM21, and SGO1) is particularly relevant, since we previously observed differences in plasmid copy number and mitotic stability between T1 and T1-E. The original recombinant carries more copies of the plasmid per cell than the evolved strain. On the other hand, under non-selective growth conditions the fraction of plasmid-bearing cells is higher in T1-E cultures than in T1 cultures [3]. Mutations in MCM21 are reported to have caused a decrease in the stability of a minichromo-some, together with an increase in the copy num-ber of the minichromosome in cells carrying it [14]. Surprisingly, MCM21 was underexpressed 1.8-fold in T1-E, which showed increased stability and low-er copy numblow-er of the plasmid. Mutations in gene PLC1 have also been described to result in in-creased levels of minichromosome loss and chro-mosome missegregation [15]. The overexpression
Table 1. Classification of genes with significantly changed expression level into GO process terms, according to the SGD GO Slim Mapper Toola)
GO process Overexpressed Underexpressed Sum
Biological process unknown 9 14 23
Organelle organization and biogenesis 10 8 18
RNA metabolism 6 9 15
DNA metabolism 6 5 11
Transport 3 8 11
Cell cycle 3 6 9
Cytoskeleton organization and biogenesis 3 4 7
Response to stress 2 5 7
Generation of precursor metabolites and energy 4 2 6
Morphogenesis 5 1 6
Protein modification 4 2 6
Transcription 3 3 6
Protein biosynthesis 2 3 5
a) The number of genes classified in a particular group changing 1.5-fold or more is indicated. Only groups with five or more genes with changed expression are shown. Terms are redundant, thus some genes are represented in more than one group.
Biotechnology
Journal Biotechnol. J. 2008, 3, 1591–1597
Table 2. Genes of interest to this study with significantly changed expression (higher than 1.5-fold) between T1 and T1-E. The ratio between expression
levels in T1-E and T1 is indicated
Gene Ratio p value Description DNA repair / recombination / replication
DDR48 1.61 0.0357 DNA damage responsive protein; expression is increased in reponse to heat-shock stress or treatments
that produce DNA lesions
PIF1 1.57 0.0304 DNA helicase; plays a role in repair and recombination of mitochondrial DNA
ELG1 1.55 0.0218 Mutants display DNA replication defects, exhibit elevated levels of recombination and show increased levels of chromosome loss
TPP1 0.55 0.0149 DNA 3’-phosphatase that functions in repair of endogenous damage of double-stranded DNA
MND1 0.54 0.0269 Protein required for recombination and meiotic nuclear division
APN2 0.36 0.0100 Class II abasic (AP) endonuclease involved in repair of DNA damage
Response to stress
SCH9 1.89 0.0052 Protein kinase; involved in the age-dependent response to oxidative stress during chronological cell ag-ing
FAB1 0.65 0.0091 1-phosphatidylinositol-3-phosphate 5-kinase; vacuolar membrane kinase; generates phosphatidylinosi-tol P2, involved in vacuolar sorting and homeostasis
PRX1 0.54 0.0202 Mitochondrial peroxiredoxin; has a role in reduction of hydroperoxides; induced during respiratory growth and under conditions of oxidative stress
MET22 0.38 9.9E-05 Bisphosphate-3’-nucleotidase, involved in salt tolerance and methionine biogenesis
Chromatin remodeling
ITC1 1.77 0.0176 Component of the ATP-dependent Isw2p-Itc1p chromatin remodeling complex
RSC58 1.54 0.0265 58-kDa subunit of RSC (remodel the structure of chromatin) chromatin remodeling complex
SPT21 2.24 0.0035 Protein required for normal transcription at 2 particular histone loci (HTA2-HTB2 and HHF2-HHT2)
but not at other histone loci; functionally related to Spt10p
RNA metabolism
BRR2 2.36 0.0340 ATP-dependent RNA helicase activity; involved in nuclear mRNA splicing, via spliceosome
SMX3 1.84 0.0029 snRNP protein; involved in nuclear mRNA splicing, via spliceosome
FRS2 1.74 7.7E-04 Alpha subunit of cytoplasmic phenylalanyl-tRNA synthetase, forms a tetramer with Frs1p to form active enzyme
DED1 0.66 0.0397 RNA helicase; involved in RNA splicing and translation initiation; required for translation initiation of all yeast mRNAs
SEN34 0.65 0.0348 Subunit of the tRNA splicing endonuclease
DAL82 0.57 0.0119 Positive regulator of allophanate inducible genes; binds a dodecanucleotide sequence upstream of all
genes that are induced by allophanate
CBT1 0.43 2.4E-04 Protein involved in 5’ end processing of mitochondrial COB, 15S_rRNA, and RPM1 transcripts; possi-ble role in 3’ end processing of the COB pre-mRNA
Cell cycle / mitosis
CDC27 3.04 0.0075 Anaphase-promoting complex/cyclosome (APC/C) subunit, which is a ubiquitin-protein ligase required
for degradation of anaphase inhibitors
GIN4 2.00 0.0370 Protein kinase involved in bud growth and assembly of the septin ring, proposed to have kinase-de-pendent and kinase-indekinase-de-pendent activities
CDC5 1.87 0.0302 Polo-like kinase; found at bud neck, nucleus and SPBs; has multiple functions in mitosis and cytokine-sis through phosphorylation of substrates
PLC1 1.77 0.0263 Enzyme involved in kinetochore function and pseudohyphal differentiation; deletion of PLC1 causes in-creased minichromosome loss
BFA1 1.68 0.0089 Component of the GTPase-activating Bfa1p-Bub2p complex involved in multiple cell cycle checkpoint pathways that control exit from mitosis
CMD1 0.66 0.0163 Calmodulin; regulates Ca2+ independent (mitosis, bud growth, actin organization, endocytosis) and Ca2+ dependent processes (stress-activated pathways)
MCM21 0.54 0.0282 Protein involved in minichromosome maintenance; component of the COMA complex
CDC20 0.43 0.0017 Cell-cycle regulated activator of anaphase-promoting complex/cyclosome (APC/C), which is required
for metaphase/anaphase transition
SGO1 0.41 0.0013 Component of the spindle checkpoint; required for accurate chromosomal segregation at meiosis II and for mitotic chromosome stability
(1.8-fold) of PLC1 in T1-E is in accordance with those previous observations.
Two genes that code for components of chro-matin remodeling complexes (ITC1 and RSC58) were overexpressed in T1-E. Moreover, SPT21 was also overexpressed in T1-E. This gene affects the transcription of yeast histone genes. Mutations in SPT21 greatly decrease the transcript levels of two of the four histone loci in S. cerevisiae [16]. Altered histone levels can cause effects on transcription and chromatin structure. Alterations in chromatin structure, particularly of the plasmid, may have been relevant to the adaptive process of the combinant to lactose. These alterations may be re-lated with the higher stability of the plasmid in T1-E. Moreover, chromatin structure may influence the activity of the LAC genes promoter region, in which a deletion occurred during the adaptation [3].
CMD1, the single gene encoding calmodulin in S. cerevisiae, was underexpressed 1.5-fold in T1-E. Calmodulin, a small Ca2+-binding protein that is
found in all eukaryotic organisms, has many func-tions in yeast. This protein plays essential roles in mitosis and bud growth, and is also required for en-docytosis in yeast. Calmodulin also participates in Ca2+-dependent stress-activated signaling
path-ways [17].
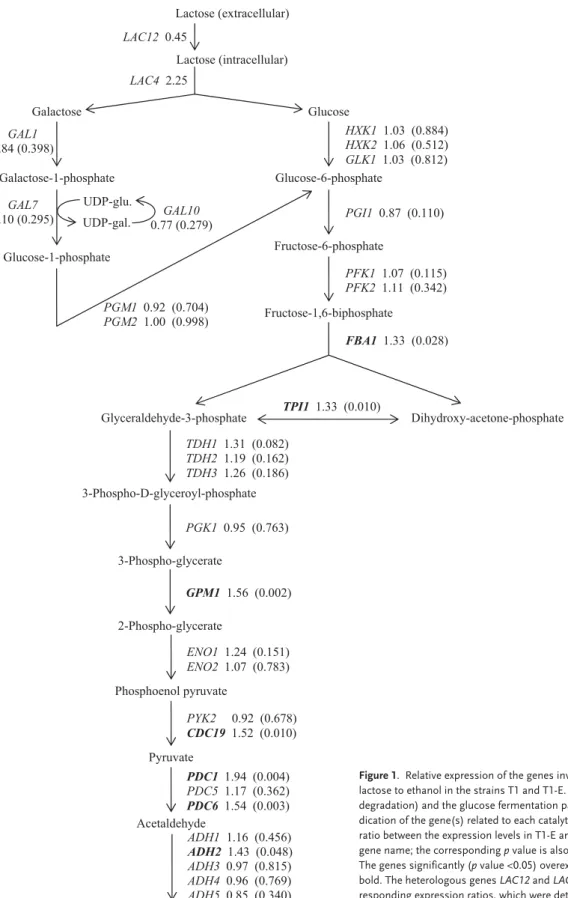
Figure 1 shows the relative expression of the genes involved in the fermentation of lactose to ethanol in the strains T1 and T1-E.Two genes of the glycolytic pathway (GPM1, encoding phosphoglyc-erate mutase, and CDC19, encoding pyruvate ki-nase) were significantly (p value <0.05) overex-pressed more than 1.5-fold in T1-E. In addition, the genes FBA1 (encoding aldolase) and TPI1 (encod-ing triosephosphate isomerase) were also
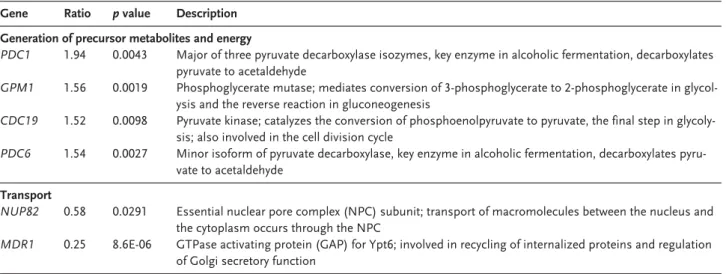
signifi-cantly overexpressed 1.3-fold in T1-E. Overexpres-sion of these glycolytic enzymes is consistent with the higher growth and lactose consumption rates presented by the evolved strain. Moreover, PDC1 and PDC6 genes (encode isoforms of pyruvate de-carboxylase) were significantly overexpressed more than 1.5-fold in T1-E. The ADH2 gene (en-coding alcohol dehydrogenase) was also signifi-cantly overexpressed 1.4-fold in T1-E. Overexpres-sion of these two key enzymes of alcoholic fermen-tation is in agreement with our observation that the flux of carbon (lactose) through fermentation was higher in the evolved strain, which presented high-er ethanol productivity and lowhigh-er biomass yield.
The microarray analysis did not find significant differences in the expression of genes specific for galactose (one of the products of the intracellular hydrolysis of lactose, together with glucose) metab-olism (GAL genes). Furthermore, although the floc-culation capacity of T1-E is improved compared to T1, no significant differences were found in the ex-pression of genes related with flocculation (FLO genes).
In conclusion, few differences were found in the S. cerevisiae genome transcriptional expression be-tween the original and the evolved recombinants. Some of the changes in gene expression are con-sistent with the physiological and molecular differ-ences previously identified between the two strains [3], providing clues to explain some of those differ-ences at the genetic level, even though the changes identified in the S. cerevisiae transcriptome analy-sis could not directly explain the behavior of the evolved strain.
Table 2. Continued
Gene Ratio p value Description Generation of precursor metabolites and energy
PDC1 1.94 0.0043 Major of three pyruvate decarboxylase isozymes, key enzyme in alcoholic fermentation, decarboxylates pyruvate to acetaldehyde
GPM1 1.56 0.0019 Phosphoglycerate mutase; mediates conversion of 3-phosphoglycerate to 2-phosphoglycerate in glycol-ysis and the reverse reaction in gluconeogenesis
CDC19 1.52 0.0098 Pyruvate kinase; catalyzes the conversion of phosphoenolpyruvate to pyruvate, the final step in
glycoly-sis; also involved in the cell division cycle
PDC6 1.54 0.0027 Minor isoform of pyruvate decarboxylase, key enzyme in alcoholic fermentation, decarboxylates pyru-vate to acetaldehyde
Transport
NUP82 0.58 0.0291 Essential nuclear pore complex (NPC) subunit; transport of macromolecules between the nucleus and
the cytoplasm occurs through the NPC
MDR1 0.25 8.6E-06 GTPase activating protein (GAP) for Ypt6; involved in recycling of internalized proteins and regulation of Golgi secretory function
Biotechnology Journal Biotechnol. J. 2008, 3, 1591–1597 Glucose Glucose-6-phosphate HXK1 1.03 (0.884) HXK2 1.06 (0.512) GLK1 1.03 (0.812) Fructose-6-phosphate PGI1 0.87 (0.110) Fructose-1,6-biphosphate PFK1 1.07 (0.115) PFK2 1.11 (0.342) FBA1 1.33 (0.028) e t a h p s o h p -e n o t e c a -y x o r d y h i D e t a h p s o h p -3 -e d y h e d l a r e c y l G TPI1 1.33 (0.010) 3-Phospho-D-glyceroyl-phosphate TDH1 1.31 (0.082) TDH2 1.19 (0.162) TDH3 1.26 (0.186) 3-Phospho-glycerate PGK1 0.95 (0.763) 2-Phospho-glycerate GPM1 1.56 (0.002) Phosphoenol pyruvate ENO1 1.24 (0.151) ENO2 1.07 (0.783) Pyruvate PYK2 0.92 (0.678) CDC19 1.52 (0.010) PDC1 1.94 (0.004) PDC5 1.17 (0.362) PDC6 1.54 (0.003) Ethanol ADH1 1.16 (0.456) ADH2 1.43 (0.048) ADH3 0.97 (0.815) ADH4 0.96 (0.769) ADH5 0.85 (0.340) Lactose (intracellular) UDP-gal. UDP-glu. Acetaldehyde GAL1 0.84 (0.398) GAL7 1.10 (0.295) 0.77 (0.279)GAL10 Galactose Galactose-1-phosphate Glucose-1-phosphate PGM1 0.92 (0.704) PGM2 1.00 (0.998) LAC4 2.25 Lactose (extracellular) LAC12 0.45
Figure 1. Relative expression of the genes involved in the fermentation of
lactose to ethanol in the strains T1 and T1-E. The Leloir pathway (galactose degradation) and the glucose fermentation pathway are shown, with the in-dication of the gene(s) related to each catalytic step, according to SGD. The ratio between the expression levels in T1-E and T1 is indicated next to each gene name; the corresponding p value is also indicated (on parentheses). The genes significantly (p value <0.05) overexpressed in T1-E are shown in bold. The heterologous genes LAC12 and LAC4 are also shown with the cor-responding expression ratios, which were determined by quantitative real-time RT-PCR as previously reported [3].
P.M.R.G. acknowledges support from Fundação para a Ciência e a Tecnologia, Portugal (grant SFRH/ BD/13463/2003).
The authors have declared no conflict of interest.
References
[1] Siso, M. I. G., The biotechnological utilization of cheese whey: A review. Bioresour. Technol. 1996, 57, 1-11.
[2] Domingues, L., Teixeira, J. A., Lima, N., Construction of a flocculent Saccharomyces cerevisiae fermenting lactose. Appl. Microbiol. Biotechnol. 1999, 51, 621-626.
[3] Guimarães, P. M. R., François, J., Parrou, J. L., Teixeira, J. A., Domingues, L., Adaptive evolution of a lactose-consuming Saccharomyces cerevisiae recombinant. Appl. Environ. Mi-crobiol. 2008, 74, 1748-1756.
[4] Kim, T.Y., Sohn, S. B., Kim, H. U., Lee, S.Y., Strategies for sys-tems-level metabolic engineering. Biotechnol. J. 2008, 3, 612-623.
[5] Otero, J. M., Panagiotou, G., Olsson, L., Fueling industrial biotechnology growth with bioethanol. Adv. Biochem. Eng. Biotechnol. 2007, 108, 1-40.
[6] Bro, C., Nielsen, J., Impact of “ome” analyses on inverse metabolic engineering. Metab. Eng. 2004, 6, 204-211. [7] Sauer, U., Evolutionary engineering of industrially
impor-tant microbial phenotypes. Adv. Biochem. Eng. Biotechnol. 2001, 73, 129-170.
[8] Le Berre, V., Trévisiol, E., Dagkessamanskaia, A., Sokol, S., Caminade, A.-M., Majoral, J. P., Meunier, B., François, J.,
Den-drimeric coating of glass slides for sensitive DNA microar-rays analysis. Nucleic Acids Res. 2003, 31, e88, 1-8. [9] Edgar, R., Domrachev, M., Lash, A. E., Gene Expression
Om-nibus: NCBI gene expression and hybridization array data repository. Nucleic Acids Res. 2002, 30, 207-210.
[10] Kim, J. M., Vanguri, S., Boeke, J. D., Gabriel, A., Voytas, D. F., Transposable elements and genome organization: a com-prehensive survey of retrotransposons revealed by the complete Saccharomyces cerevisiae genome sequence. Genome Res. 1998, 8, 464-478.
[11] Roth, J.,The yeast Ty virus-like particles. Yeast 2000, 16, 785-795.
[12] Adams, J., Microbial evolution in laboratory environments. Res. Microbiol. 2004, 155, 311-318.
[13] Zeyl, C., Capturing the adaptive mutation in yeast. Res. Mi-crobiol. 2004, 155, 217-223.
[14] Poddar, A., Roy, N., Sinha, P., MCM21 and MCM22, two nov-el genes of the yeast Saccharomyces cerevisiae are required for chromosome transmission. Mol. Microbiol. 1999, 31, 349-360.
[15] Lin, H., Choi, J. H., Hasek, J., DeLillo, N. et al., Phospholipase C is involved in kinetochore function in Saccharomyces cerevisiae. Mol. Cell. Biol. 2000, 20, 3597-3607.
[16] Dollard, C., Ricupero-Hovasse, S. L., Natsoulis, G., Boeke, J. D., Winston, F., SPT10 and SPT21 are required for tran-scription of particular histone genes in Saccharomyces cere-visiae. Mol. Cell. Biol. 1994, 14, 5223-5228.
[17] Cyert, M. S., Genetic analysis of calmodulin and its targets in Saccharomyces cerevisiae. Annu. Rev. Genet. 2001, 35, 647-672.